

- Market Size (2026)
- USD 415.1 Mn
- Forecast (2036)
- USD 1210.9 Mn
- CAGR (2026 to 2036)
- 11.3%
How big is 800VDC Rack Power Safety Validation Services Market in 2026?
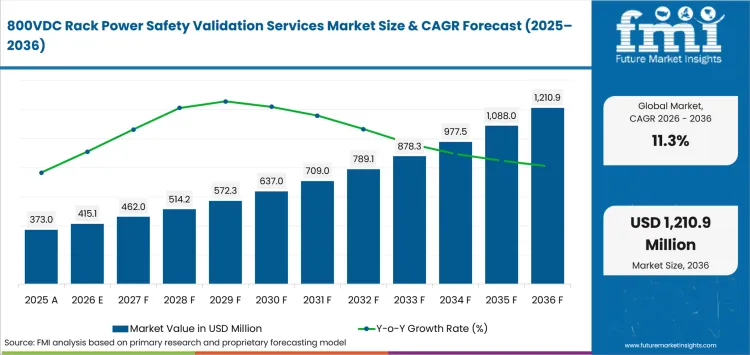
USD 415.1 million in 2026 and USD 1,210.9 million by 2036 at an 11.3% CAGR.
The demand for 800VDC rack power safety validation services is projected to push valuation from USD 415.1 million in 2026 to USD 1,210.9 million by 2036 at 11.3% CAGR. The data center power shift toward megawatt AI racks pulls safety validation into architecture approval and pre-energization work. NVIDIA documented in May 2025 that 54 VDC distribution hits physical constraints above 200 kW. An 800 VDC backbone changes fault-energy and protection assumptions that engineering teams must prove before handover.
Large greenfield AI campuses bring validation revenue forward because electrical interfaces are fixed early enough for protection studies to enter detailed design. In May 2025 the UAE President’s office announced a 5 GW AI campus in Abu Dhabi for approved cloud operators and USA hyperscalers. Campus-scale planning gives datacenter infrastructure services teams a defined point to freeze protection settings and acceptance criteria before equipment delivery.
Key Takeaways
- Demand rises as AI rack-power architectures shift validation from a final field check toward design review and controlled pre-energization acceptance.
- By service scope, commissioning & acceptance is estimated to account for 26.0% in 2026 because final energization concentrates technical sign-off at one project gate.
- The 750-850 VDC segment is projected to hold 49.0% of nominal DC voltage demand in 2026 owing to direct alignment with emerging 800 VDC architectures.
- For rack power density, 250-500 kW is anticipated to represent 36.0% in 2026 as projects enter the range where lower-voltage distribution becomes harder to package.
- Uneven code interpretation and limited field familiarity with higher-voltage DC can extend approval schedules even after the electrical architecture is technically complete.
- Some of the key players in this market include Eaton, ABB, Schneider Electric, Vertiv, Delta Electronics, Siemens, UL Solutions, and TÜV Rheinland.
Analyst Perspective
"800 VDC validation earns value through a protection case that governs energization and later expansion. Strong engagements carry digital fault studies into installed settings, then leave reusable acceptance evidence for every additional AI hall."
- Nikhil Kaitwade, Principal Consultant, Future Market Insights
How is the 800VDC Rack Power Safety Validation Services Market segmented?
The market is segmented by service scope, nominal DC voltage, rack power density, data center type and route to market.
Service scope includes commissioning & acceptance, protection / coordination studies, architecture & design, safety validation and retrofit engineering. Nominal DC voltage covers 750-850 VDC, 600-749 VDC, 851-1,000 VDC and above 1,000 VDC. Rack power density spans below 250 kW, 250-500 kW, 501-750 kW and above 750 kW. Data center type covers hyperscale AI, colocation AI, enterprise / sovereign AI and HPC & research centers. Route to market includes power OEM direct, electrical EPC / system integrator, authorized distributor and retrofit / service channel.
What supports Hyperscale AI data centers in the Data center type category?
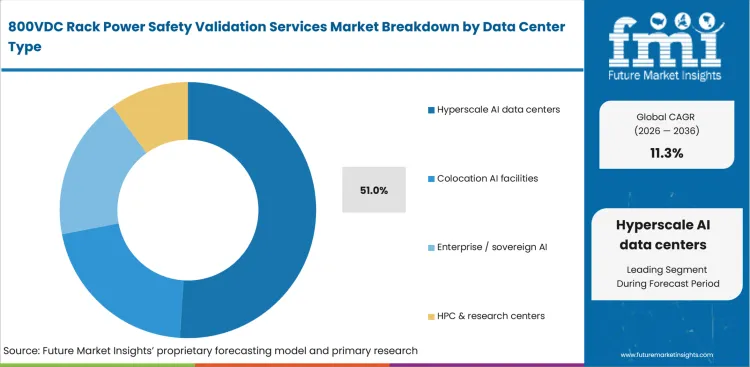
Hyperscale operators repeat electrical blocks through many halls, so one protection defect can affect a large capacity program. Shared upstream power stages also require coordinated AI datacenter liquid cooling acceptance before each hall enters service.
- In 2026, hyperscale AI data centers are expected to lead the data center type category with 51.0% share because standardized hall replication concentrates acceptance risk.
- Delta Electronics presented 800 VDC AI-factory power and digital-twin applications at NVIDIA GTC in March 2026. Hyperscale teams can reuse validated settings and acceptance scripts between standardized halls, increasing the value of documented service packages over isolated field measurements.
What makes Commissioning & Acceptance central to the Service Scope category?
Commissioning & acceptance becomes the handoff point because critical power and cooling systems must prove the installed protection case before expensive compute loads depend on the shared bus. Siemens stated in June 2026 that its AI data-center reference architecture uses factory-tested power skids intended to shorten commissioning cycles and improve repeatability.
- Commissioning & acceptance is estimated to hold 26.0% of service scope demand in 2026 owing to owner and EPC accountability at final energization.
- Field teams compare protection settings and alarm thresholds with the installed configuration before operational transfer, which makes acceptance records reusable during later capacity additions.
Why does 750-850 VDC lead the nominal DC voltage category?
The 750-850 VDC band gives the data center sector a nominal target for high-density distribution without pushing every component into a higher voltage class. Validation teams therefore compare insulation margins and fault-clearing behavior against one defined bus architecture before site acceptance.
- By nominal DC voltage, 750-850 VDC is projected to represent 49.0% in 2026 because the band centers emerging facility-level 800 VDC designs.
- Schneider Electric announced 800 VDC support in October 2025 for high-density NVIDIA rack systems. The announcement gives engineering teams a current architecture reference for protection coordination and insulation review under installed conditions.
How does 250-500 kW shape the Rack power density category?
Rack power from 250 kW to 500 kW changes conductor sizing and conversion placement, which alters acceptance planning in AI halls. Projects in this band force power and data center liquid cooling teams to coordinate commissioning windows. Vertiv stated in May 2025 that AI rack requirements were scaling beyond 300 kW as its roadmap aligned with NVIDIA’s 800 VDC architecture.
- The 250-500 kW segment is anticipated to capture 36.0% in 2026 attributable to near-term AI halls already requiring higher-voltage design discipline.
- Validation expands beyond continuity checks because larger compute loads share the same DC path and expose more equipment to one protection error.
What are the drivers, restraints and opportunities in the 800VDC Rack Power Safety Validation Services Market?
Higher AI rack density pulls validation earlier, unsettled higher-voltage safety practice slows approval, and reusable test packages expand service revenue.
- Driver: 800 VDC standardization increases projects that need common protection assumptions and repeatable acceptance evidence before energization.
- Restraint: Local electrical codes and inspector familiarity are developing more slowly than AI rack-power architectures in several deployment markets.
- Opportunity: Digital studies and field acceptance procedures can become a reusable validation sequence for new halls and later retrofit programs.
One significant demand driver is standardization of facility-level LVDC on a common rack-power architecture. In August 2026 the Open Compute Project said more than 80 partners were developing compatible infrastructure as Google, Microsoft and NVIDIA aligned system requirements. Shared electrical assumptions increase demand for data center power management evidence because rectifiers and rack converters must pass one coordinated protection case before energization.
The restraint is the gap between high-voltage DC architecture and local approval practice. UL Solutions stated in January 2026 that data-center voltages were shifting toward roughly 800 VDC. The same release said many local codes and inspectors were unprepared for the related hazards. Extra review can delay energization because owners may need project-specific evidence beyond established low-voltage procedures.
Digital fault studies give service firms a repeatable route from design review into field acceptance. Schneider Electric released an 800 VDC arc-flash study in August 2026 using digital models to evaluate system risk. Firms that carry those assumptions into installed power distribution units settings can sell the same validation logic through new halls and later retrofit work.
Which country CAGRs are profiled in the 800VDC Rack Power Safety Validation Services Market?
| Country | CAGR |
|---|---|
| UAE | 12.9% |
| Saudi Arabia | 12.6% |
| France | 12.3% |
| South Korea | 12.0% |
| USA | 11.3% |
How do country-level CAGRs compare in the 800VDC Rack Power Safety Validation Services Market?
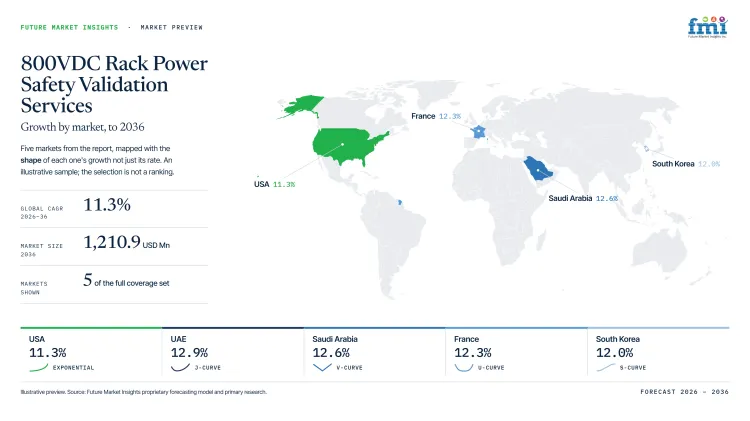
The 1.3 percentage-point spread separates Gulf greenfield programs from markets with staged or site-constrained deployment. UAE and Saudi Arabia occupy the upper band because AI campuses define electrical blocks early. France occupies the middle position between the Gulf pair and East Asia as more candidate sites enter power-planning pipelines.
- UAE operator tenders bundle power design with campus delivery under centralized governance.
- Saudi campus procurement brings electrical engineering into early contracts for AI programs.
- France’s low-carbon power base supports high-load projects across several prospective development zones.
- South Korean integrators secure repeat acceptance work as data halls reach energization.
- USA’s advanced data centers require stricter rack-level safety validation alongside high-density power infrastructure.
Comparable growth rates produce different service economics because contracting and energization routes differ.The full report provides country-level CAGR analysis across North America, Latin America, Europe, East Asia, South Asia, Oceania and the Middle East and Africa.
Country-wise Analysis
- Abu Dhabi is commissioning AI capacity in greenfield clusters that lock electrical interfaces before compute equipment reaches the site. UAE is estimated to post 12.9% CAGR over the forecast period because campus-scale programs can standardize protection evidence before each major power block reaches energization. In May 2025, the President’s office said Stargate UAE would provide 1 GW of compute capacity with the first 200 MW expected in 2026. Greenfield delivery gives validation firms early access to protection studies and owner acceptance planning during detailed design. Restricted operator access and desert cooling constraints favor firms already integrated with campus engineering teams because late testing can disrupt coordinated handover schedules.
- Saudi AI campuses are scaling new power blocks under programs that require grid interfaces and commissioning resources to expand with every hall. Saudi Press Agency reported in December 2025 that stc group through center3 and HUMAIN formed a joint venture for data centers supporting up to 1 GW of AI workloads. The Saudi Arabia sector is projected to record 12.6% CAGR during the assessment period attributable to greenfield programs and centralized digital-infrastructure investment. New-build sequencing gives engineering firms access to protection studies before later halls copy the first accepted electrical configuration. Consistent multi-vendor documentation is the main constraint because every new power block can alter interfaces and commissioning responsibility.
- French data-center developers now see more candidate sites before final grid contracts, which brings protection studies into earlier project design. In May 2025, the Economy Ministry identified 28 additional host sites beyond 35 announced in February and placed four sites in an accelerated grid process. France’s outlook is anticipated to advance at 12.3% CAGR over the assessment period aided by earlier grid coordination for selected high-power projects. Earlier coordination lets engineering teams define utility interfaces and protection assumptions before equipment packages are fully committed. Regional permitting can still separate study timing from firm energization dates, so early validation work does not guarantee an equally early commissioning order.
- South Korean AI capacity is entering service through staged projects that pair domestic technology groups with global cloud infrastructure partners. MSIT documented in June 2025 that the Ulsan AI Data Center planned 41 MW of partial operation in 2027 before reaching 103 MW in 2029. Staged energization lets acceptance teams reuse validated settings between successive power blocks without restarting the entire protection review. Given this phased capacity model the South Korea market is forecast to rise at 12.0% CAGR over the forecast period, with configuration control determining whether earlier records remain usable. Contracts become harder to standardize once design revisions break traceability between partial operation and final buildout.
- U.S. data-center projects depend on coordinated power and infrastructure planning because rapid AI deployment can outpace grid capacity during early electrical design. Adoption of 800VDC rack power safety validation services in the U.S. is estimated to expand at 11.3% CAGR through 2036, tied to accelerated high-density data-center development. The U.S. Department of Energy has emphasized coordinated development of data centers and energy infrastructure, including transmission, substations, switchgear, and other supporting systems. National and utility-level planning gives designers a clearer route for aligning power availability assumptions with data-center infrastructure before equipment selection. Long utility interconnection lead times still reward validation partners that can revise electrical studies without losing traceability to final acceptance criteria.
Who are the notable companies in the 800VDC Rack Power Safety Validation Services Market?
Eaton, ABB, Schneider Electric, Vertiv, Delta Electronics, Siemens, UL Solutions and TÜV Rheinland are the notable companies serving this market.
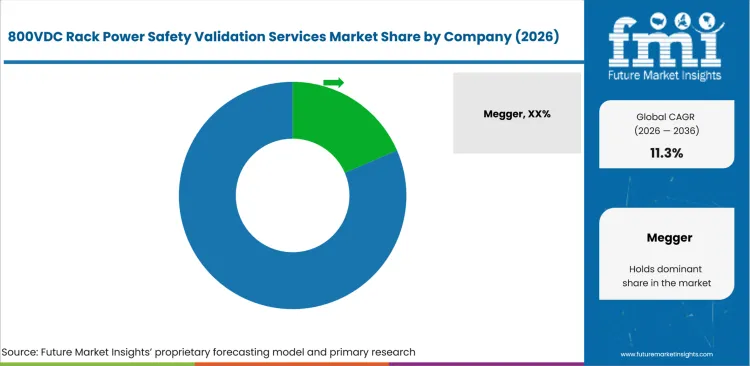
Power-system companies define rack architecture and independent safety organizations test the installed protection case. Entry barriers depend on system-level electrical knowledge and field records from comparable high-density deployments. Experience with data center transformers brings engineering groups into studies before equipment selections are fixed. Work with modular UPS systems carries commissioning logic through medium-voltage interfaces and final facility acceptance. Independent laboratories retain a separate role whenever owners require third-party evidence for protection or certification claims.
- Eaton, ABB and Schneider Electric integrate AI data-center power architecture with protection engineering and digital validation during design.
- Vertiv, Delta Electronics and Siemens pair electrical design with deployment or commissioning support for high-density data-center programs.
- UL Solutions and TÜV Rheinland provide independent testing and certification outside an equipment maker’s own acceptance process.
Competitive Benchmarking: 800VDC Rack Power Safety Validation Services Market
| Company | 800 VDC System Engineering | Safety & Protection Validation | Commissioning & Field Support | Geographic Reach |
|---|---|---|---|---|
| Eaton | High | High | High | Global |
| ABB | High | High | Medium | Global |
| Schneider Electric | High | High | High | Global |
| Vertiv | High | Medium | High | Global |
| Delta Electronics | High | Medium | Medium | Global |
| Siemens | High | High | High | Global |
| UL Solutions | Low | High | High | Global |
| TÜV Rheinland | Low | High | High | Global |
Scoring basis: High 800 VDC system engineering requires documented architecture plus an integration or simulation route. Medium requires a verified subsystem role and Low identifies testing without architecture ownership or design authority. High safety validation requires system-level protection evidence or third-party certification under defined electrical conditions. Medium covers one narrower verified safety function and Low identifies limited documented safety scope. High commissioning support requires documented field acceptance services tied to operating systems or live deployment programs. Medium indicates partial field support and Low indicates laboratory-only work without a verified commissioning route.
Key Developments in the 800VDC Rack Power Safety Validation Services Market
- In August 2026, Siemens and Reinhausen announced a solid-state transformer partnership converting grid voltage up to 36 kV into 800 VDC for AI data centers.
- In June 2026, ABB expanded its NVIDIA collaboration by integrating the DSX Blueprint so engineers can validate electrical and thermal infrastructure in digital models before hardware orders are fixed.
- In March 2026, Eaton unveiled the Beam Rubin DSX platform with NVIDIA to coordinate grid-to-chip power infrastructure for high-density AI data-center deployments.
Key Players in the 800VDC Rack Power Safety Validation Services Market
Integrated Power Architecture Providers
- Eaton
- ABB
- Schneider Electric
- Vertiv
- Delta Electronics
- Siemens
Independent Testing and Certification Providers
- UL Solutions
- TÜV Rheinland
800VDC Rack Power Safety Validation Services Market - Report Scope
| Coverage field | Report scope |
|---|---|
| Market breakdown | By service scope, nominal DC voltage, rack power density, data center type, route to market and region. |
| Quantitative Units | USD Million. |
| Market Definition | Engineering, testing and commissioning services that verify electrical safety, protection behavior and acceptance readiness for 800 VDC rack-power architectures in AI and high-density data centers. |
| Regions Covered | North America, Latin America, Europe, East Asia, South Asia and Pacific, and Middle East and Africa. |
| Countries Covered | UAE, Saudi Arabia, France, South Korea, Japan, and 20+ countries included in the full report. |
| Key Companies Profiled | Eaton, ABB, Schneider Electric, Vertiv, Delta Electronics, Siemens, UL Solutions, TÜV Rheinland. |
| Forecast Period | 2026 to 2036. |
| Approach | Primary and secondary research with market triangulation. |
800VDC Rack Power Safety Validation Services Market - Research Methodology
| Method | Approach |
|---|---|
| Primary Research | FMI analysts gathered input from manufacturers, service providers, technology developers, distributors, end users, procurement teams, and subject-matter experts. Interviews examined purchasing decisions, product or service evaluation, adoption barriers, approval requirements, pricing considerations, and expectations for technical or commercial support. Respondents were also asked what evidence is required before a trial, pilot, or initial order develops into regular purchasing. |
| Desk Research | Desk research covered government statistics, regulatory publications, trade data, industry associations, technical literature, standards, company filings, product information, and official corporate announcements. Sources were reviewed for relevance, publication date, geographic coverage, and consistency with the defined market scope. Claims relating to performance, applications, approvals, capacity, investment, and commercial activity were retained only when supported by credible public evidence. |
| Market Sizing and Forecasting | The market model combined the baseline value with historical performance, segment structure, pricing and volume indicators, adoption levels, company participation, and country-level demand conditions. Forecast assumptions considered economic activity, investment trends, regulatory developments, technology adoption, purchasing cycles, supply availability, and barriers to wider market use. Segment and regional estimates were reconciled before the final market total was calculated. |
| Data Validation | Estimates were checked against multiple independent indicators, including public data, company activity, trade patterns, industry developments, and findings from primary interviews. Validation also tested whether products, services, applications, and company revenues fell within the defined market boundaries. Adjacent categories, unsupported claims, overlapping revenues, and activities without direct market relevance were excluded to reduce double counting and maintain consistency across segments and countries. |
800VDC Rack Power Safety Validation Services Market by Segments
800VDC Rack Power Safety Validation Services Market segmented by Service Scope:
- Commissioning & acceptance
- Protection / coordination studies
- Architecture & design
- Safety validation
- Retrofit engineering
800VDC Rack Power Safety Validation Services Market segmented by Nominal DC Voltage:
- 750-850 VDC
- 600-749 VDC
- 851-1,000 VDC
- Above 1,000 VDC
800VDC Rack Power Safety Validation Services Market segmented by Rack Power Density:
- 250-500 kW
- Below 250 kW
- 501-750 kW
- Above 750 kW
800VDC Rack Power Safety Validation Services Market segmented by Data Center Type:
- Hyperscale AI data centers
- Colocation AI facilities
- Enterprise / sovereign AI
- HPC & research centers
800VDC Rack Power Safety Validation Services Market segmented by Route to Market:
- Power OEM direct
- Electrical EPC / system integrator
- Authorized distributor
- Retrofit / service channel
800VDC Rack Power Safety Validation Services Market by Region:
- North America
- United States
- Canada
- Latin America
- Brazil
- Mexico
- Chile
- Rest of Latin America
- Western Europe
- Germany
- United Kingdom
- Italy
- Spain
- France
- Nordics
- Benelux
- Rest of Western Europe
- Eastern Europe
- Russia
- Poland
- Hungary
- Balkan and Baltic States
- Rest of Eastern Europe
- East Asia
- China
- Japan
- South Korea
- South Asia and Pacific
- India
- ASEAN
- Australia and New Zealand
- Rest of South Asia and Pacific
- Middle East and Africa
- Kingdom of Saudi Arabia
- Other GCC Countries
- Türkiye
- South Africa
- Other African Union Countries
- Rest of Middle East and Africa
Research Sources and Bibliography
- NVIDIA. (2025, May 20). NVIDIA 800 VDC Architecture Will Power the Next Generation of AI Factories.
- Office of the President of the UAE. (2025, May 15). UAE, US Presidents attend unveiling of Phase 1 of new 5GW AI campus in Abu Dhabi.
- Siemens. (2026, June 1). Siemens and partners develop reference architecture purpose-built for NVIDIA AI data centers.
- Schneider Electric. (2025, October 13). Schneider Electric Highlights Innovation in 800 VDC Power Systems in support of NVIDIA’s next generation GPUs.
- Vertiv. (2025, May 19). Vertiv accelerates AI infrastructure evolution in alignment with NVIDIA 800 VDC power architecture announcement.
- Delta Electronics. (2026, March 17). Delta Exhibits Energy-saving Solutions for 800 VDC in Next-Gen AI Factories and Digital Twin Applications Built on Omniverse at NVIDIA GTC 2026.
- Open Compute Project Foundation. (2026, August 11). Powering the Next Era of AI: How Google, Microsoft and Nvidia Are Standardizing and Accelerating the Industry Transition to LVDC.
- UL Solutions. (2026, January 13). UL Solutions and the Open Compute Project to Help Advance Safety and Scalability in New AI Data Center Innovations.
- Schneider Electric. (2026, August 3). Schneider Electric releases pioneering study assessing arc flash risk in 800 VDC data centers aligning with world’s leading hyperscalers.
- Office of the President of the UAE. (2025, May 22). Global tech alliance launches 'Stargate UAE'.
- Saudi Press Agency. (2025, December 18). stc and HUMAIN announce JV partnership to develop data centers supporting up to 1 GW of AI workloads in Saudi Arabia.
- Ministry of the Economy, Finance and Industrial and Digital Sovereignty. (2025, May 20). Sommet Choose France 2025.
- Ministry of Science and ICT, Republic of Korea. (2025, June 20). Ulsan AI Data Center Launch Sparks Dialogue on Advancing Korea into a Top-Three Global AI Power.
- Ministry of Economy, Trade and Industry, Japan. (2025, June 12). Report 1.0 of the Public-Private Advisory Council on Watt-Bit Collaboration Published.
- Eaton. (2026, March 16). Eaton collaborates with NVIDIA to unveil the Eaton Beam Rubin DSX platform.
- ABB. (2026, June 1). ABB Expands Collaboration with NVIDIA through Integration of DSX Blueprint for AI Infrastructure.
- Siemens. (2026, August 14). Siemens and Reinhausen develop direct current power solutions for AI data centers.
- Eaton. (2026, January 28). Eaton expands modular data center offering for rapid deployment of AI factories from grid to chip.
- ABB. (2025, October 13). ABB to develop next-generation AI data centers with NVIDIA.
- Schneider Electric. (2026, March 16). Schneider Electric teams with NVIDIA to develop validated blueprints for gigawatt-scale AI factories.
- Vertiv. (2025, October 13). From vision to readiness: Vertiv collaborates with NVIDIA to advance 800 VDC platform designs.
- Delta Electronics. (2026, May 28). Delta bolsters 800 VDC architecture for next-gen AI factories with power, cooling and microgrid solutions.
- Siemens. (2026, March 17). Siemens and Rittal enter into strategic partnership for data center energy infrastructure.
- UL Solutions. (2026, April 21). ABB Achieves First Certification from UL Solutions for System Designed to Advance Data Center Safety and Reliability.
- TÜV Rheinland. (2026, May 12). New Laboratory for High-Performance Technologies: TÜV Rheinland Opens Power Test Center Cologne.
- TÜV Rheinland. (2026). AI Data Center Power Infrastructure Solutions. Retrieved August 26, 2026.
- Delta Electronics. (2026, June 2). Delta debuts prefabricated AI modular data center solution at COMPUTEX 2026 to reduce deployment time by up to 60%.
- Schneider Electric. (2026, June 15). Schneider Electric and Hon Hai Technology Group (Foxconn) announce collaboration to accelerate next-generation AI data centers.
- Siemens. (2025, December 9). Siemens and nVent to release joint reference architecture purpose-built for NVIDIA AI data centers.
- Schneider Electric. (2026, July 23). Schneider Electric and AMD release first Helios platform reference design to accelerate AI Factory deployment.
- Vertiv. (2026, June 1). Vertiv introduces Vertiv SmartRun digital twin.
This bibliography is provided for reader reference and is not exhaustive. The full report contains the complete reference list and detailed citations
This Report Answers
- How large is the 800VDC rack power safety validation services market in 2026 and 2036?
- Which electrical changes are increasing demand for rack-power safety validation before energization?
- Why does commissioning & acceptance account for 26.0% of service scope demand in 2026?
- Why does 750-850 VDC represent 49.0% of nominal DC voltage demand in 2026?
- How do the five profiled country CAGRs differ between 11.6% and 12.9%?
- Which companies provide architecture engineering, commissioning and independent safety validation services?
- What code and inspection gaps can delay higher-voltage DC data-center acceptance?
- Which service capabilities improve repeatability between new-build halls and later retrofit programs?
Frequently Asked Questions
How big is the 800VDC Rack Power Safety Validation Services Market in 2026?
The 800VDC rack power safety validation services market is valued at USD 415.1 million in 2026 and is projected to reach USD 1,210.9 million by 2036. Growth follows higher AI rack power and earlier demand for documented electrical acceptance.
What is the CAGR of the 800VDC Rack Power Safety Validation Services Market from 2026 to 2036?
The 800VDC rack power safety validation services market is projected to grow at a CAGR of 11.3% between 2026 and 2036. Expansion is supported by higher rack density and broader adoption of facility-level 800 VDC distribution.
Which service scope segment leads the 800VDC Rack Power Safety Validation Services Market?
The commissioning & acceptance segment is expected to hold 26.0% of the 800VDC rack power safety validation services market in 2026. Final energization concentrates owner and EPC accountability for protection settings and installed-system evidence at one acceptance gate.
Which nominal DC voltage segment leads the 800VDC Rack Power Safety Validation Services Market?
The 750–850 VDC segment is expected to hold 49.0% of the 800VDC rack power safety validation services market in 2026. Its position follows direct alignment with 800 VDC architectures being specified for high-density AI racks.
Which companies are active in the 800VDC Rack Power Safety Validation Services Market?
Key companies operating in the market include Eaton, ABB, Schneider Electric, Vertiv, Delta Electronics, Siemens, UL Solutions, and TÜV Rheinland. Their roles differ through architecture engineering and field commissioning plus independent protection testing and certification.
Preview the report firsthand - request a free sample
Get SampleGet the brochure for pricing and purchase details.
Get PDFTable of Content
- Key Takeaways
- Market Size and CAGR
- Top Growth Driver
- Fastest Growing Segment
- Leading Region
- Key Companies
- Emerging Opportunities
- Executive Summary
- Global Market Outlook
- Demand-side Trends
- Supply-side Trends
- Technology Roadmap Analysis
- Analysis and Recommendations
- Analyst Perspective (What is happening? Why now? What should investors know?)
- Key Questions Answered
- How large is the market?
- What is the CAGR?
- What are key trends?
- Which region dominates?
- Who are the leaders?
- Market Overview
- Market Coverage / Taxonomy
- Market Definition / Scope / Limitations
- Research Methodology
- Chapter Orientation
- Analytical Lens and Working Hypotheses
- Market Structure, Signals, and Trend Drivers
- Benchmarking and Cross-market Comparability
- Market Sizing, Forecasting, and Opportunity Mapping
- Research Design and Evidence Framework
- Desk Research Programme (Secondary Evidence)
- Expert Input and Fieldwork (Primary Evidence)
- Tooling, Models, and Reference Databases
- Data Engineering and Model Build
- Quality Assurance and Audit Trail
- Market Background
- Market Dynamics (Drivers, Restraints, Opportunity, Trends)
- Scenario Forecast (Optimistic, Likely, Conservative)
- Impact Analysis
- AI Impact
- Sustainability Impact
- Regulatory Impact
- Technology Impact
- Consumer / Buyer Analysis
- Purchase Drivers
- Adoption Barriers
- Buyer Journey
- Opportunity Map Analysis
- Product Life Cycle Analysis
- Supply Chain Analysis
- Investment Feasibility Matrix
- Value Chain Analysis
- PESTLE and Porter's Analysis
- Regulatory Landscape
- Regional Parent Market Outlook
- Production and Consumption Statistics
- Import and Export Statistics
- Global Market Analysis and Forecast, 2021 to 2036
- Historical Market Size Value (USD Million) Analysis, 2021 to 2025
- Current and Future Market Size Value (USD Million) Projections, 2026 to 2036
- Y-o-Y Growth Trend Analysis
- Absolute $ Opportunity Analysis
- Global Market Pricing Analysis, 2021 to 2036
- Global Market Analysis and Forecast, By Service Scope, 2021 to 2036
- Introduction / Key Findings
- Historical Market Size Value (USD Million) Analysis By Service Scope, 2021 to 2025
- Current and Future Market Size Value (USD Million) Analysis and Forecast By Service Scope, 2026 to 2036
- Commissioning & acceptance
- Protection / coordination studies
- Architecture & design
- Safety validation
- Retrofit engineering
- Commissioning & acceptance
- Y-o-Y Growth Trend Analysis By Service Scope, 2021 to 2025
- Absolute $ Opportunity Analysis By Service Scope, 2026 to 2036
- Global Market Analysis and Forecast, By Nominal DC Voltage, 2021 to 2036
- Introduction / Key Findings
- Historical Market Size Value (USD Million) Analysis By Nominal DC Voltage, 2021 to 2025
- Current and Future Market Size Value (USD Million) Analysis and Forecast By Nominal DC Voltage, 2026 to 2036
- 750-850 VDC
- 600-749 VDC
- 851-1,000 VDC
- Above 1,000 VDC
- 750-850 VDC
- Y-o-Y Growth Trend Analysis By Nominal DC Voltage, 2021 to 2025
- Absolute $ Opportunity Analysis By Nominal DC Voltage, 2026 to 2036
- Global Market Analysis and Forecast, By Rack Power Density, 2021 to 2036
- Introduction / Key Findings
- Historical Market Size Value (USD Million) Analysis By Rack Power Density, 2021 to 2025
- Current and Future Market Size Value (USD Million) Analysis and Forecast By Rack Power Density, 2026 to 2036
- 250-500 kW
- Below 250 kW
- 501-750 kW
- Above 750 kW
- 250-500 kW
- Y-o-Y Growth Trend Analysis By Rack Power Density, 2021 to 2025
- Absolute $ Opportunity Analysis By Rack Power Density, 2026 to 2036
- Global Market Analysis and Forecast, By Data Center Type, 2021 to 2036
- Introduction / Key Findings
- Historical Market Size Value (USD Million) Analysis By Data Center Type, 2021 to 2025
- Current and Future Market Size Value (USD Million) Analysis and Forecast By Data Center Type, 2026 to 2036
- Hyperscale AI data centers
- Colocation AI facilities
- Enterprise / sovereign AI
- HPC & research centers
- Hyperscale AI data centers
- Y-o-Y Growth Trend Analysis By Data Center Type, 2021 to 2025
- Absolute $ Opportunity Analysis By Data Center Type, 2026 to 2036
- Global Market Analysis and Forecast, By Route to Market, 2021 to 2036
- Introduction / Key Findings
- Historical Market Size Value (USD Million) Analysis By Route to Market, 2021 to 2025
- Current and Future Market Size Value (USD Million) Analysis and Forecast By Route to Market, 2026 to 2036
- Power OEM direct
- Electrical EPC / system integrator
- Authorized distributor
- Retrofit / service channel
- Power OEM direct
- Y-o-Y Growth Trend Analysis By Route to Market, 2021 to 2025
- Absolute $ Opportunity Analysis By Route to Market, 2026 to 2036
- Global Market Analysis and Forecast, By Region, 2021 to 2036
- Introduction
- Historical Market Size Value (USD Million) Analysis By Region, 2021 to 2025
- Current Market Size Value (USD Million) Analysis and Forecast By Region, 2026 to 2036
- North America
- Latin America
- Western Europe
- Eastern Europe
- East Asia
- South Asia and Pacific
- Middle East & Africa
- Market Attractiveness Analysis By Region
- North America Market Analysis and Forecast, By Country, 2021 to 2036
- Historical Market Size Value (USD Million) Trend Analysis By Market Taxonomy, 2021 to 2025
- Market Size Value (USD Million) Forecast By Market Taxonomy, 2026 to 2036
- By Country
- USA
- Canada
- By Service Scope
- By Nominal DC Voltage
- By Rack Power Density
- By Data Center Type
- By Route to Market
- By Country
- Market Attractiveness Analysis
- By Country
- By Service Scope
- By Nominal DC Voltage
- By Rack Power Density
- By Data Center Type
- By Route to Market
- Key Takeaways
- Latin America Market Analysis and Forecast, By Country
- Historical Market Size Value (USD Million) Trend Analysis By Market Taxonomy, 2021 to 2025
- Market Size Value (USD Million) Forecast By Market Taxonomy, 2026 to 2036
- By Country
- Brazil
- Mexico
- Chile
- Rest of Latin America
- By Service Scope
- By Nominal DC Voltage
- By Rack Power Density
- By Data Center Type
- By Route to Market
- By Country
- Market Attractiveness Analysis
- By Country
- By Service Scope
- By Nominal DC Voltage
- By Rack Power Density
- By Data Center Type
- By Route to Market
- Key Takeaways
- Western Europe Market Analysis and Forecast, By Country
- Historical Market Size Value (USD Million) Trend Analysis By Market Taxonomy, 2021 to 2025
- Market Size Value (USD Million) Forecast By Market Taxonomy, 2026 to 2036
- By Country
- Germany
- UK
- Italy
- Spain
- France
- Nordic
- BENELUX
- Rest of Western Europe
- By Service Scope
- By Nominal DC Voltage
- By Rack Power Density
- By Data Center Type
- By Route to Market
- By Country
- Market Attractiveness Analysis
- By Country
- By Service Scope
- By Nominal DC Voltage
- By Rack Power Density
- By Data Center Type
- By Route to Market
- Key Takeaways
- Eastern Europe Market Analysis and Forecast, By Country
- Historical Market Size Value (USD Million) Trend Analysis By Market Taxonomy, 2021 to 2025
- Market Size Value (USD Million) Forecast By Market Taxonomy, 2026 to 2036
- By Country
- Russia
- Poland
- Hungary
- Balkan & Baltic
- Rest of Eastern Europe
- By Service Scope
- By Nominal DC Voltage
- By Rack Power Density
- By Data Center Type
- By Route to Market
- By Country
- Market Attractiveness Analysis
- By Country
- By Service Scope
- By Nominal DC Voltage
- By Rack Power Density
- By Data Center Type
- By Route to Market
- Key Takeaways
- East Asia Market Analysis and Forecast, By Country
- Historical Market Size Value (USD Million) Trend Analysis By Market Taxonomy, 2021 to 2025
- Market Size Value (USD Million) Forecast By Market Taxonomy, 2026 to 2036
- By Country
- China
- Japan
- South Korea
- By Service Scope
- By Nominal DC Voltage
- By Rack Power Density
- By Data Center Type
- By Route to Market
- By Country
- Market Attractiveness Analysis
- By Country
- By Service Scope
- By Nominal DC Voltage
- By Rack Power Density
- By Data Center Type
- By Route to Market
- Key Takeaways
- South Asia and Pacific Market Analysis and Forecast, By Country
- Historical Market Size Value (USD Million) Trend Analysis By Market Taxonomy, 2021 to 2025
- Market Size Value (USD Million) Forecast By Market Taxonomy, 2026 to 2036
- By Country
- India
- ASEAN
- Australia & New Zealand
- Rest of South Asia and Pacific
- By Service Scope
- By Nominal DC Voltage
- By Rack Power Density
- By Data Center Type
- By Route to Market
- By Country
- Market Attractiveness Analysis
- By Country
- By Service Scope
- By Nominal DC Voltage
- By Rack Power Density
- By Data Center Type
- By Route to Market
- Key Takeaways
- Middle East & Africa Market Analysis and Forecast, By Country
- Historical Market Size Value (USD Million) Trend Analysis By Market Taxonomy, 2021 to 2025
- Market Size Value (USD Million) Forecast By Market Taxonomy, 2026 to 2036
- By Country
- Kingdom of Saudi Arabia
- Other GCC Countries
- Türkiye
- South Africa
- Other African Union
- Rest of Middle East & Africa
- By Service Scope
- By Nominal DC Voltage
- By Rack Power Density
- By Data Center Type
- By Route to Market
- By Country
- Market Attractiveness Analysis
- By Country
- By Service Scope
- By Nominal DC Voltage
- By Rack Power Density
- By Data Center Type
- By Route to Market
- Key Takeaways
- Key Countries Market Analysis
- USA
- Pricing Analysis
- Market Share Analysis, 2025
- By Service Scope
- By Nominal DC Voltage
- By Rack Power Density
- By Data Center Type
- By Route to Market
- Canada
- Pricing Analysis
- Market Share Analysis, 2025
- By Service Scope
- By Nominal DC Voltage
- By Rack Power Density
- By Data Center Type
- By Route to Market
- Mexico
- Pricing Analysis
- Market Share Analysis, 2025
- By Service Scope
- By Nominal DC Voltage
- By Rack Power Density
- By Data Center Type
- By Route to Market
- Brazil
- Pricing Analysis
- Market Share Analysis, 2025
- By Service Scope
- By Nominal DC Voltage
- By Rack Power Density
- By Data Center Type
- By Route to Market
- Chile
- Pricing Analysis
- Market Share Analysis, 2025
- By Service Scope
- By Nominal DC Voltage
- By Rack Power Density
- By Data Center Type
- By Route to Market
- Germany
- Pricing Analysis
- Market Share Analysis, 2025
- By Service Scope
- By Nominal DC Voltage
- By Rack Power Density
- By Data Center Type
- By Route to Market
- UK
- Pricing Analysis
- Market Share Analysis, 2025
- By Service Scope
- By Nominal DC Voltage
- By Rack Power Density
- By Data Center Type
- By Route to Market
- Italy
- Pricing Analysis
- Market Share Analysis, 2025
- By Service Scope
- By Nominal DC Voltage
- By Rack Power Density
- By Data Center Type
- By Route to Market
- Spain
- Pricing Analysis
- Market Share Analysis, 2025
- By Service Scope
- By Nominal DC Voltage
- By Rack Power Density
- By Data Center Type
- By Route to Market
- France
- Pricing Analysis
- Market Share Analysis, 2025
- By Service Scope
- By Nominal DC Voltage
- By Rack Power Density
- By Data Center Type
- By Route to Market
- India
- Pricing Analysis
- Market Share Analysis, 2025
- By Service Scope
- By Nominal DC Voltage
- By Rack Power Density
- By Data Center Type
- By Route to Market
- ASEAN
- Pricing Analysis
- Market Share Analysis, 2025
- By Service Scope
- By Nominal DC Voltage
- By Rack Power Density
- By Data Center Type
- By Route to Market
- Australia & New Zealand
- Pricing Analysis
- Market Share Analysis, 2025
- By Service Scope
- By Nominal DC Voltage
- By Rack Power Density
- By Data Center Type
- By Route to Market
- China
- Pricing Analysis
- Market Share Analysis, 2025
- By Service Scope
- By Nominal DC Voltage
- By Rack Power Density
- By Data Center Type
- By Route to Market
- Japan
- Pricing Analysis
- Market Share Analysis, 2025
- By Service Scope
- By Nominal DC Voltage
- By Rack Power Density
- By Data Center Type
- By Route to Market
- South Korea
- Pricing Analysis
- Market Share Analysis, 2025
- By Service Scope
- By Nominal DC Voltage
- By Rack Power Density
- By Data Center Type
- By Route to Market
- Russia
- Pricing Analysis
- Market Share Analysis, 2025
- By Service Scope
- By Nominal DC Voltage
- By Rack Power Density
- By Data Center Type
- By Route to Market
- Poland
- Pricing Analysis
- Market Share Analysis, 2025
- By Service Scope
- By Nominal DC Voltage
- By Rack Power Density
- By Data Center Type
- By Route to Market
- Hungary
- Pricing Analysis
- Market Share Analysis, 2025
- By Service Scope
- By Nominal DC Voltage
- By Rack Power Density
- By Data Center Type
- By Route to Market
- Kingdom of Saudi Arabia
- Pricing Analysis
- Market Share Analysis, 2025
- By Service Scope
- By Nominal DC Voltage
- By Rack Power Density
- By Data Center Type
- By Route to Market
- Türkiye
- Pricing Analysis
- Market Share Analysis, 2025
- By Service Scope
- By Nominal DC Voltage
- By Rack Power Density
- By Data Center Type
- By Route to Market
- South Africa
- Pricing Analysis
- Market Share Analysis, 2025
- By Service Scope
- By Nominal DC Voltage
- By Rack Power Density
- By Data Center Type
- By Route to Market
- USA
- Market Structure Analysis
- Competition Dashboard
- Competition Benchmarking
- Market Share Analysis of Top Players
- By Regional
- By Service Scope
- By Nominal DC Voltage
- By Rack Power Density
- By Data Center Type
- By Route to Market
- Emerging Startups
- Innovation Benchmarking
- Competition Analysis
- Competition Deep Dive
- Megger
- Overview
- Product Portfolio
- Profitability by Market Segments
- Sales Footprint
- Strategy Overview
- Marketing Strategy
- Product Strategy
- Channel Strategy
- Eaton
- Fluke
- Bender
- Megger
- Case Studies
- Success Stories
- Recent Developments
- Competition Deep Dive
- Assumptions & Acronyms Used


