

- Market Size (2026)
- USD 404.8 Mn
- Forecast (2036)
- USD 1609.5 Mn
- CAGR (2026 to 2036)
- 14.8%
How big is 800VDC Rack Solid-State Disconnects Market in 2026?
USD 404.8 million in 2026 and USD 1,609.5 million by 2036 at a 14.8% CAGR.
Sales of 800VDC rack solid-state disconnects are estimated to rise at 14.8% CAGR through 2036, increasing valuation from USD 404.8 million in 2026 to USD 1,609.5 million by 2036. Expansion is attributable to data center power architectures built for much higher rack loads. In May 2025, NVIDIA said its 800 VDC design would support 1 MW racks and beyond with overcurrent protection at defined power boundaries. The defined boundary gives disconnect makers a clear rack or row fault zone to isolate.
More high-density projects require protection choices during design. Later changes to the DC fault boundary can force wider electrical redesign. The IEA projected in April 2025 that global data center electricity use would reach about 945 TWh by 2030, more than twice the 2022 level. The electricity forecast does not guarantee 800 VDC adoption, but it increases infrastructure services engagements that decide conversion, distribution, and isolation together.
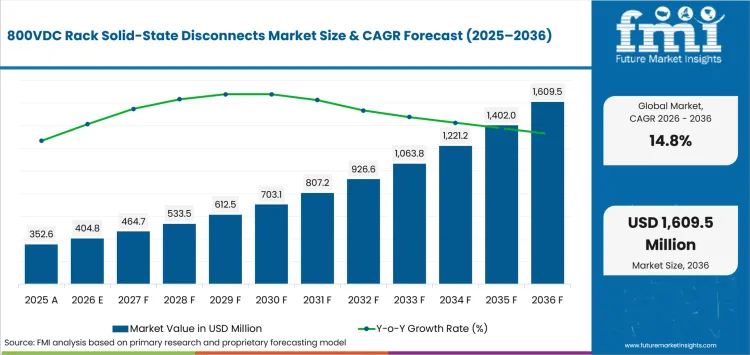
Key Takeaways
- Megawatt-class AI racks raise the cost of slow DC fault clearing, increasing demand for electronic isolation near high-value compute loads.
- By product configuration, rack-integrated assembly is estimated to hold 31.0% in 2026 owing to sensing, interruption, and service access sharing one rack boundary.
- In 2026, 750-850 VDC is expected to lead nominal DC voltage with 49.0% share because current AI power programs use 800 VDC as the common design target.
- By rack power density, 250-500 kW is forecast to represent 36.0% in 2026 driven by higher-voltage distribution needs as rack designs approach megawatt-class loads.
- Stored bus energy and millisecond fault behavior extend qualification until operators verify insulation, protection coordination, and safe maintenance for design release.
- Some of the key players in this market include Eaton, Schneider Electric, Vertiv, ABB, Delta Electronics, Infineon Technologies, Texas Instruments, and onsemi.
Analyst Perspective
"At 800 VDC, qualification depends on clearing behavior and service isolation at the actual rack fault boundary as much as nameplate voltage. A stronger design limits stored-energy release and coordinates with the selected power path so technicians can isolate a fault without redefining the rack interface."
- Sudip saha, Principal Consultant, Future Market Insights
How is the 800 VDC rack solid-state disconnects market segmented?
The market is segmented by product configuration, nominal DC voltage, rack power density, data center type, and route to market.
The 800 VDC rack solid-state disconnects market is classified by product configuration, nominal DC voltage, rack power density, data center type, route to market, and region. Product formats range from rack-integrated assemblies to standalone modules and prefabricated cabinets. The voltage taxonomy centers on 800 VDC, and rack density extends from below 250 kW to above 750 kW. Data center and route-to-market categories separate hyperscale, colocation, enterprise or sovereign, research, OEM, integrator, distributor, and service channels.
How does 250-500 kW shape demand within the rack power density category?
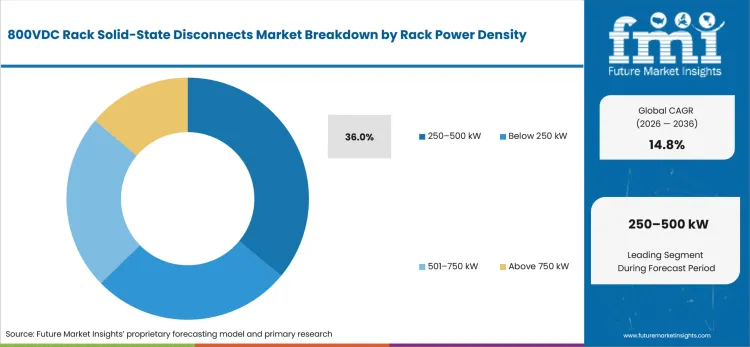
The 250-500 kW range exposes current and fault-energy limits ahead of widespread one-megawatt racks. At this density, power-quality monitoring and selective DC isolation become useful during rack design. NVIDIA documented in October 2025 that its Kyber rack uses 800 VDC input and a 64:1 conversion stage occupying 26% less area than a traditional multistage design.
- By rack power density, 250-500 kW is forecast to represent 36.0% in 2026 owing to near-term AI racks moving beyond lower-voltage distribution limits.
- Protection manufacturers can test conduction loss and interruption speed in this range ahead of denser rack generations that raise stored energy and complicate service isolation.
What makes rack-integrated assembly central to the product configuration category?
Rack-integrated assemblies place sensing and interruption at one rack boundary, letting engineers study the DC feed and compute load as a fault zone. Power distribution units can follow the isolation plan. Open Compute Project guidance in August 2026 identified the LVDC side power rack as the fastest route to 800 VDC capability in existing AI factories.
- By product configuration, rack-integrated assembly is projected to account for 31.0% in 2026, attributable to one defined interface for sensing, interruption, and maintenance access.
- The side-power-rack route places conversion near compute rows, letting disconnect makers test one rack-facing interface instead of coordinating several separately owned protection boundaries.
Why does 750-850 VDC lead the nominal DC voltage category?
The 750-850 VDC band gives engineers headroom for a nominal 800 VDC bus without moving into the next component voltage class. It also aligns protection with high-voltage DC power supplies. In May 2025, Texas Instruments said it was developing power-management and sensing technology with NVIDIA for 800 VDC server distribution.
- In 2026, 750-850 VDC is expected to lead nominal DC voltage with 49.0% share, driven by the common 800 VDC target used in major AI infrastructure programs.
- A common voltage class lets engineers compare insulation margin, hot-swap protection, fault sensing, and transient control without changing the basic rack interface between programs.
What supports hyperscale AI data centers within the data center type category?
Hyperscale operators can repeat a protection scheme over many racks and align power management plans with compute roadmaps, spreading engineering work over a larger deployment. Schneider Electric announced in June 2025 that its NVIDIA collaboration covered power, cooling, controls, and high-density rack systems and included a new NVIDIA-enabled rack system.
- Hyperscale AI data centers are estimated to hold 51.0% in 2026, supported by concentrated rack density and repeated use of the same power-protection requirements.
- Large operators can freeze common interfaces early, giving disconnect makers a clearer qualification target but increasing redesign exposure for products that cannot scale between rack generations.
What are the drivers, restraints and opportunities in the 800 VDC rack solid-state disconnects market?
Higher rack power raises the need for fast DC interruption. Safety evidence can delay approval, and rack-adjacent conversion gives existing facilities a practical 800 VDC transition path.
- Driver: Megawatt-class rack designs require higher-voltage distribution and fast electronic isolation at defined DC fault boundaries.
- Restraint: Stored energy and millisecond fault behavior extend testing as operators validate arc-flash exposure, switching transients, and safe isolation.
- Opportunity: Rack-adjacent conversion lets power OEMs package rectification, protection, monitoring, and service access without replacing all upstream AC infrastructure.
Higher rack power raises current and copper requirements unless distribution voltage also rises. Infineon Technologies stated in October 2025 that 800 VDC server boards need controlled hot-swap operation, protection, and high-efficiency conversion for service without shutting down the entire rack. Disconnect designs therefore compete on fast interruption and low conduction loss, which raises the relevance of silicon carbide switching in compact high-voltage paths.
Safety evidence can keep an otherwise workable disconnect outside a released bill of materials. Schneider Electric published an 800 VDC arc-flash study in August 2026 that assessed two representative architectures and found fault outcomes depend on topology, capacitor placement, and clearing behavior. Operators therefore need architecture-specific circuit-breaker coordination and test records prior to accepting a voltage rating as proof of safe interruption.
Existing data halls can introduce 800 VDC near the rack without rebuilding every upstream AC stage. Eaton said in July 2025 that its NVIDIA collaboration covered design practices and reference architectures for high-voltage DC infrastructure serving one-megawatt rack systems. The commercial opening is the complete rack-adjacent package: conversion, protection, controls, and storage components such as HVDC capacitors must pass one maintenance and availability review.
Which country CAGRs are profiled in the 800 VDC rack solid-state disconnects market?
| Country | CAGR |
|---|---|
| Saudi Arabia | 15.7% |
| Japan | 15.4% |
| France | 15.1% |
| South Korea | 14.8% |
| UAE | 14.4% |
| USA | 14.1% |
How do country-level CAGRs compare in the 800 VDC rack solid-state disconnects market?
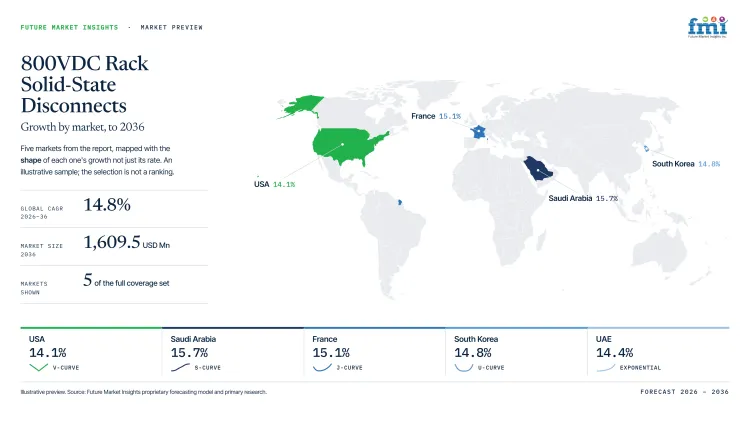
The profiled CAGRs span 1.6 percentage points from Saudi Arabia at 15.7% to USA at 14.1%. Saudi Arabia, Japan at 15.4%, and France at 15.1% form the faster-growth band. South Korea at 14.8% and UAE at 14.4% occupy a middle band. USA remains a substantial engineering and deployment market while showing the lowest profiled growth rate.
- Saudi Arabia concentrates procurement in large greenfield campus programs.
- Japan ties equipment releases to staged electrical and site-development schedules.
- France brings protection reviews into design earlier through utility connection planning.
- South Korea relies on concentrated system-partner qualification in AI programs.
- USA demand spans both new builds and campus upgrades.
- UAE adoption is concentrated around large AI infrastructure alliances and design-build programs where power architecture decisions are made at campus level.
Comparable rates produce different order-conversion risks for companies serving these five markets. The full report provides country-level CAGR analysis across North America, Latin America, Europe, East Asia, South Asia, Oceania and the Middle East and Africa.
Country-wise Analysis
- Saudi Arabia is building large greenfield data center campuses that can fix rack power architecture ahead of final equipment procurement, giving EPC teams more freedom to define rack-level isolation than retrofit projects allow. The Saudi 800 VDC rack solid-state disconnects outlook is projected to expand at 15.7% CAGR over the forecast period, owing to campuses that can specify higher-voltage DC protection without inherited rack constraints. The Saudi Press Agency said in April 2026 that operational capacity exceeded 440 MW in 2025, and rapid construction schedules favor prefabricated protection assemblies backed by local commissioning and service teams that can meet EPC handover dates.
- For new Japanese AI campuses, grid capacity and telecom availability are increasingly planned as one site-readiness decision, so rack power design cannot advance independently from wider infrastructure sequencing or local utility schedules. METI and MIC published Watt-Bit Collaboration Report 1.0 in June 2025 to coordinate electricity and telecommunications infrastructure, making equipment approval timing a practical constraint for power-system companies entering new projects. Demand for 800 VDC rack solid-state disconnects in Japan is forecast to rise at 15.4% CAGR during the assessment period, supported by coordinated infrastructure planning and local standards documentation that is ready locally before rack power design is frozen.
- With confirmed grid potential reserved at selected French sites, electrical design can move earlier and bring rack power decisions forward during construction planning for large AI campuses under accelerated schedules. France is estimated to post 15.1% CAGR through 2036, aided by projects that can begin detailed power design earlier despite permitting, land-use approval, and site execution remaining material schedule risks. The Ministry of Economy said in January 2026 that five fast-track sites each had connection potential above 700 MW, but project execution still favors rack-protection companies that enter prequalification before distribution topology and switchgear interfaces are fixed for construction release.
- The large Ulsan AI data center program concentrates power-interface qualification among a small group of domestic system partners, making domestic EPC relationships part of the route to a rack design. MSIT said in June 2025 that the project is scheduled to reach 103 MW by February 2029, and local equipment preferences plus site power availability can narrow the equipment list ahead of detailed design. The South Korean market is positioned to record 14.8% CAGR over the assessment period, tied to large AI projects and favoring companies that bring standards documentation, maintainable fault isolation, and local commissioning support into early qualification.
- UAE procurement is concentrated around large AI infrastructure alliances and design-build programs where power architecture decisions are made at campus level. Demand for 800VDC Rack Solid-State Disconnects in UAE is forecast to expand at 14.4% CAGR from 2026 to 2036. Abu Dhabi announced Stargate UAE in May 2025 as a 1 GW compute cluster with an initial 200 MW phase expected to go live in 2026. The main constraint is synchronization of power supply, long-lead equipment, and system qualification across very large project packages. Suppliers need early design engagement, secure component availability, and integrated service arrangements with the power OEM and local EPC.
- At operating US campuses, operators qualify protection against owner standards and existing service procedures, making retrofit fit as important as electrical performance on a new rack design and raising the value of field support. USA sales are forecast to expand at 14.1% CAGR by 2036, given a large installed base that must balance greenfield AI builds with grid constraints, retrofit interfaces, and differing owner standards. Lawrence Berkeley National Laboratory estimated in June 2026 that data centers could account for 11.8% of US electricity use by 2030, so manufacturers with documented interruption performance and multi-architecture service can avoid repeating protection studies at operating campuses.
Who are the notable companies in the 800 VDC rack solid-state disconnects market?
Eaton, Schneider Electric, Vertiv, ABB, Delta Electronics, Infineon Technologies, Texas Instruments, and onsemi are notable companies serving this market.
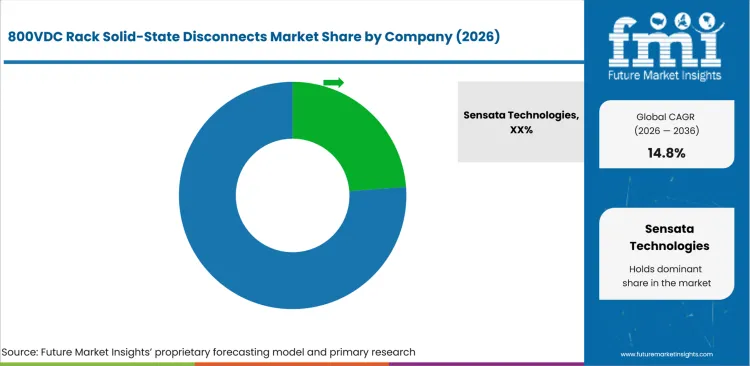
Competition spans system-level power companies and semiconductor specialists, but entry depends on proof at the exact 800 VDC rack boundary. Eaton, Schneider Electric, Vertiv, ABB, and Delta Electronics can test protection inside a wider power architecture. Infineon Technologies, Texas Instruments, and onsemi enter closer to the switching layer. Project teams also coordinate electrical release with data center chillers because higher rack density ties power commissioning to the same heat-load assumptions.
- Eaton, Schneider Electric, Vertiv, ABB, and Delta Electronics cover system-level conversion, distribution, protection, and rack or row integration.
- Infineon Technologies, Texas Instruments, and onsemi cover high-voltage semiconductors, hot-swap control, power conversion, and protection nearer the switching layer.
Competitive Benchmarking: 800VDC Rack Solid-State Disconnects Market
| Company | 800 VDC Architecture Scope | Rack Protection / Switching | Deployment Integration | Geographic Reach |
|---|---|---|---|---|
| Eaton | High | High | High | Global |
| Schneider Electric | High | High | High | Global |
| Vertiv | High | Medium | High | Global |
| ABB | High | High | High | Global |
| Delta Electronics | High | High | High | Global, with strong Asia, North America, and Europe coverage |
| Infineon Technologies | Medium | High | Medium | Global semiconductor customer base |
| Texas Instruments | Medium | High | Medium | Global semiconductor customer base |
| onsemi | High | Medium | Medium | Global semiconductor and data center customer base |
Scoring basis: High architecture scope requires a documented rack-to-facility 800 VDC design. Medium covers a defined subsystem and Low covers one component role. High rack protection requires explicit hot-swap, e-fuse, solid-state protection, or integrated protection evidence. Medium covers a narrower protection function and Low covers conversion without a documented protection role. High deployment integration requires a public system or reference architecture. Medium means participation inside that architecture and Low means a single device path. Geographic reach describes the company's documented commercial footprint.
Key Developments in the 800VDC Rack Solid-State Disconnects Market
- In June 2026, ABB expanded its NVIDIA collaboration by integrating electrical distribution and UPS assets into the Omniverse DSX blueprint for source-to-rack validation.
- In March 2026, Texas Instruments unveiled a complete NVIDIA-aligned 800 VDC architecture that included an 800 V hot-swap controller for input power protection.
- In July 2025, onsemi announced work with NVIDIA on 800 VDC AI data center power architectures covering solid-state transformers, power supplies, distribution, and core delivery.
Key Players in the 800VDC Rack Solid-State Disconnects Market
Integrated 800 VDC Power Architecture
- Eaton
- Schneider Electric
- Vertiv
- ABB
Rack and Row Power Systems
- Delta Electronics
Semiconductor Switching and Protection
- Infineon Technologies
- Texas Instruments
- onsemi
800VDC Rack Solid-State Disconnects Market - Report Scope
| Coverage field | Report scope |
|---|---|
| Market breakdown | By product configuration, nominal DC voltage, rack power density, data center type, route to market, and region. |
| Quantitative Units | USD million. |
| Market Definition | Commercial solid-state or hybrid solid-state DC disconnect devices, modules, and assemblies used for high-voltage isolation and fault interruption near AI data center rack and row power boundaries. |
| Regions Covered | North America, Latin America, Western Europe, Eastern Europe, East Asia, South Asia and Pacific, and Middle East and Africa. |
| Countries Covered | Saudi Arabia, Japan, France, South Korea, USA, and 20+ countries included in the full report. |
| Key Companies Profiled | Eaton, Schneider Electric, Vertiv, ABB, Delta Electronics, Infineon Technologies, Texas Instruments, and onsemi. |
| Forecast Period | 2026 to 2036. |
| Approach | Primary and secondary research with market triangulation. |
800VDC Rack Solid-State Disconnects Market - Research Methodology
| Method | Approach |
|---|---|
| Primary Research | FMI analysts gathered input from manufacturers, service providers, technology developers, distributors, end users, procurement teams, and subject-matter experts. Interviews examined purchasing decisions, product or service evaluation, adoption barriers, approval requirements, pricing considerations, and expectations for technical or commercial support. Respondents were also asked what evidence is required before a trial, pilot, or initial order develops into regular purchasing. |
| Desk Research | Desk research covered government statistics, regulatory publications, trade data, industry associations, technical literature, standards, company filings, product information, and official corporate announcements. Sources were reviewed for relevance, publication date, geographic coverage, and consistency with the defined market scope. Claims relating to performance, applications, approvals, capacity, investment, and commercial activity were retained only when supported by credible public evidence. |
| Market Sizing and Forecasting | The market model combined the baseline value with historical performance, segment structure, pricing and volume indicators, adoption levels, company participation, and country-level demand conditions. Forecast assumptions considered economic activity, investment trends, regulatory developments, technology adoption, purchasing cycles, supply availability, and barriers to wider market use. Segment and regional estimates were reconciled before the final market total was calculated. |
| Data Validation | Estimates were checked against multiple independent indicators, including public data, company activity, trade patterns, industry developments, and findings from primary interviews. Validation also tested whether products, services, applications, and company revenues fell within the defined market boundaries. Adjacent categories, unsupported claims, overlapping revenues, and activities without direct market relevance were excluded to reduce double counting and maintain consistency across segments and countries. |
800VDC Rack Solid-State Disconnects Market by Segments
800VDC Rack Solid-State Disconnects Market segmented by Product Configuration:
- Rack-integrated assembly
- Standalone device/module
- Busway / distribution-integrated
- Prefabricated power cabinet
800VDC Rack Solid-State Disconnects Market segmented by Nominal DC Voltage:
- 750-850 VDC
- 600-749 VDC
- 851-1,000 VDC
- Above 1,000 VDC
800VDC Rack Solid-State Disconnects Market segmented by Rack Power Density:
- 250-500 kW
- Below 250 kW
- 501-750 kW
- Above 750 kW
800VDC Rack Solid-State Disconnects Market segmented by Data Center Type:
- Hyperscale AI data centers
- Colocation AI facilities
- Enterprise / sovereign AI
- HPC & research centers
800VDC Rack Solid-State Disconnects Market segmented by Route to Market:
- Power OEM direct
- Electrical EPC / system integrator
- Authorized distributor
- Retrofit / service channel
800VDC Rack Solid-State Disconnects Market by Region:
- North America
- United States
- Canada
- Latin America
- Brazil
- Mexico
- Argentina
- Chile
- Rest of Latin America
- Western Europe
- Germany
- France
- United Kingdom
- Italy
- Spain
- Benelux
- Nordics
- Rest of Western Europe
- Eastern Europe
- Poland
- Czech Republic
- Romania
- Hungary
- Balkan and Baltic States
- Rest of Eastern Europe
- East Asia
- China
- Japan
- South Korea
- South Asia and Pacific
- India
- ASEAN
- Australia and New Zealand
- Rest of South Asia and Pacific
- Middle East and Africa
- Kingdom of Saudi Arabia
- Other GCC Countries
- Türkiye
- South Africa
- Other African Union Countries
- Rest of Middle East and Africa
Research Sources and Bibliography
- NVIDIA. (2025, May 20). NVIDIA 800 VDC architecture will power the next generation of AI factories.
- International Energy Agency. (2025, April 10). Energy and AI.
- Open Compute Project Foundation. (2026, August 11). Powering the next era of AI: How Google, Microsoft and Nvidia are standardizing and accelerating the industry transition to LVDC.
- Texas Instruments. (2025, May 23). TI teams with NVIDIA to bring efficient power distribution to AI infrastructure.
- NVIDIA. (2025, October 13). Building the 800 VDC ecosystem for efficient, scalable AI factories.
- Schneider Electric. (2025, June 11). Schneider Electric accelerates the development and deployment of AI factories at scale with NVIDIA.
- Infineon Technologies. (2025, October 13). Infineon advances leading-edge 800 Volt AI data center power architecture enabling better efficiency and serviceability.
- Schneider Electric. (2026, August 3). Schneider Electric releases pioneering study assessing arc flash risk in 800 VDC data centers aligning with world’s leading hyperscalers.
- Eaton. (2025, July 15). Eaton accelerates the transformation of data center infrastructure in the AI era with NVIDIA.
- Saudi Press Agency. (2026, April 27). Saudi Arabia strengthens its global position in artificial intelligence through data center growth and accelerated smart manufacturing.
- Ministry of Economy, Trade and Industry, Japan. (2025, June 12). Report 1.0 of the Public-Private Advisory Council on Watt-Bit Collaboration published.
- French Ministry of Economy. (2026, January 30). Rencontres des centres de données : la dynamique des projets d’infrastructures numériques se confirme.
- Ministry of Science and ICT, Republic of Korea. (2025, June 20). Ulsan AI Data Center launch sparks dialogue on advancing Korea into a top-three global AI power.
- Lawrence Berkeley National Laboratory. (2026, June). United States data center energy usage report: 2025 update.
- ABB. (2026, June 1). ABB expands collaboration with NVIDIA through integration of DSX Blueprint for AI infrastructure.
- Texas Instruments. (2026, March 16). TI unveils complete 800 VDC power architecture for future generation AI data centers with NVIDIA.
- onsemi. (2025, July 29). onsemi collaborates with NVIDIA to accelerate transition to 800 VDC power solutions for next-generation AI data centers.
- Eaton. (2025, October 13). Eaton unveils next-generation architecture to advance 800 VDC power infrastructure for AI factories.
- Schneider Electric. (2025, October 13). Schneider Electric highlights innovation in 800 VDC power systems in support of NVIDIA’s next generation GPUs.
- Vertiv. (2025, October 13). From vision to readiness: Vertiv collaborates with NVIDIA to advance 800 VDC platform designs to power the next generation of AI factories.
- Delta Electronics. (2026, March 17). Delta exhibits energy-saving solutions for 800 VDC in next-gen AI factories and digital twin applications built on Omniverse at NVIDIA GTC 2026.
- Infineon Technologies. (2025, May 20). Infineon to revolutionize power delivery architecture for future AI server racks with NVIDIA.
- Eaton. (2026, March 16). Eaton collaborates with NVIDIA to unveil the Eaton Beam Rubin DSX platform to address the nearly $7 trillion data center buildout market from grid to chip.
- Schneider Electric. (2026, March 16). Schneider Electric teams with NVIDIA to develop validated blueprints to design, simulate, build, operate and maintain gigawatt-scale AI Factories.
- Vertiv. (2025, May 19). Vertiv accelerates AI infrastructure evolution in alignment with NVIDIA 800 VDC power architecture announcement.
- ABB. (2025, October 13). ABB to develop next-generation AI data centers with NVIDIA.
- Delta Electronics. (2026, May 28). Delta Bolsters 800 VDC Architecture for Next-gen AI Factories with Cutting-Edge Power, Cooling and Microgrid Solutions.
- Infineon Technologies. (2026, March 17). Infineon introduces CoolGaN-based HV IBC reference designs for 800 VDC architectures in AI data centers.
- Texas Instruments. (2025, October 13). TI’s new power-management solutions enable scalable AI infrastructures.
- onsemi. (2025, October 27). onsemi completes acquisition of Vcore power technology from Aura Semiconductor.
This bibliography is provided for reader reference and is not exhaustive. The full report contains the complete reference list and detailed citations
This Report Answers
- How large is the 800 VDC rack solid-state disconnects market in 2026 and 2036?
- Which rack-power conditions make fast 800 VDC isolation a design requirement?
- Why does rack-integrated assembly hold 31.0% of product configuration in 2026?
- Why does the 750-850 VDC band account for 49.0% of nominal DC voltage in 2026?
- What makes 250-500 kW the leading rack power density band in 2026?
- How do Saudi Arabia, Japan, France, South Korea, and USA compare by forecast CAGR?
- Which companies cover system architecture, rack protection, and semiconductor switching?
- Which safety and service conditions can delay solid-state disconnect qualification?
- Where can side-power-rack architectures shorten the route to 800 VDC deployment?
Frequently Asked Questions
How big is the 800VDC Rack Solid-State Disconnects Market in 2026?
The 800 VDC rack solid-state disconnects market is valued at USD 404.8 million in 2026 and is projected to reach USD 1,609.5 million by 2036. Higher AI rack power increases the need for fast DC isolation near compute loads.
What is the CAGR of the 800VDC Rack Solid-State Disconnects Market from 2026 to 2036?
The 800 VDC rack solid-state disconnects market is projected to grow at a CAGR of 14.8% between 2026 and 2036. Expansion is tied to 800 VDC distribution and coordinated high-voltage fault protection near rack power boundaries.
Which product configuration leads the 800VDC Rack Solid-State Disconnects Market?
The rack-integrated assembly segment is expected to hold 31.0% of the 800 VDC rack solid-state disconnects market in 2026, attributable to one defined interface for sensing and interruption. Power OEMs can qualify protection and service access at the same rack boundary.
Which nominal DC voltage band leads the 800VDC Rack Solid-State Disconnects Market?
The 750-850 VDC segment is expected to hold 49.0% of the 800 VDC rack solid-state disconnects market in 2026, supported by the common 800 VDC target in current AI power architectures. One voltage class simplifies protection and insulation qualification.
Which countries are projected to record the highest growth in the 800VDC Rack Solid-State Disconnects Market?
Saudi Arabia is projected to grow at 15.7% CAGR, followed by Japan at 15.4% and France at 15.1% through 2036. Large data center projects and earlier electrical planning support faster qualification of higher-voltage rack power systems.
Which companies are active in the 800VDC Rack Solid-State Disconnects Market?
Key companies operating in the 800 VDC rack solid-state disconnects market include Eaton, Schneider Electric, Vertiv, ABB, Delta Electronics, Infineon Technologies, Texas Instruments, and onsemi. Their roles span system integration, rack protection, power conversion, semiconductor switching, and engineering support.
Preview the report firsthand - request a free sample
Get SampleGet the brochure for pricing and purchase details.
Get PDFTable of Content
- Key Takeaways
- Market Size and CAGR
- Top Growth Driver
- Fastest Growing Segment
- Leading Region
- Key Companies
- Emerging Opportunities
- Executive Summary
- Global Market Outlook
- Demand-side Trends
- Supply-side Trends
- Technology Roadmap Analysis
- Analysis and Recommendations
- Analyst Perspective (What is happening? Why now? What should investors know?)
- Key Questions Answered
- How large is the market?
- What is the CAGR?
- What are key trends?
- Which region dominates?
- Who are the leaders?
- Market Overview
- Market Coverage / Taxonomy
- Market Definition / Scope / Limitations
- Research Methodology
- Chapter Orientation
- Analytical Lens and Working Hypotheses
- Market Structure, Signals, and Trend Drivers
- Benchmarking and Cross-market Comparability
- Market Sizing, Forecasting, and Opportunity Mapping
- Research Design and Evidence Framework
- Desk Research Programme (Secondary Evidence)
- Expert Input and Fieldwork (Primary Evidence)
- Tooling, Models, and Reference Databases
- Data Engineering and Model Build
- Quality Assurance and Audit Trail
- Market Background
- Market Dynamics (Drivers, Restraints, Opportunity, Trends)
- Scenario Forecast (Optimistic, Likely, Conservative)
- Impact Analysis
- AI Impact
- Sustainability Impact
- Regulatory Impact
- Technology Impact
- Consumer / Buyer Analysis
- Purchase Drivers
- Adoption Barriers
- Buyer Journey
- Opportunity Map Analysis
- Product Life Cycle Analysis
- Supply Chain Analysis
- Investment Feasibility Matrix
- Value Chain Analysis
- PESTLE and Porter's Analysis
- Regulatory Landscape
- Regional Parent Market Outlook
- Production and Consumption Statistics
- Import and Export Statistics
- Global Market Analysis and Forecast, 2021 to 2036
- Historical Market Size Value (USD Million) Analysis, 2021 to 2025
- Current and Future Market Size Value (USD Million) Projections, 2026 to 2036
- Y-o-Y Growth Trend Analysis
- Absolute $ Opportunity Analysis
- Global Market Pricing Analysis, 2021 to 2036
- Global Market Analysis and Forecast, By Product Configuration, 2021 to 2036
- Introduction / Key Findings
- Historical Market Size Value (USD Million) Analysis By Product Configuration, 2021 to 2025
- Current and Future Market Size Value (USD Million) Analysis and Forecast By Product Configuration, 2026 to 2036
- Rack-integrated assembly
- Standalone device/module
- Busway / distribution-integrated
- Prefabricated power cabinet
- Rack-integrated assembly
- Y-o-Y Growth Trend Analysis By Product Configuration, 2021 to 2025
- Absolute $ Opportunity Analysis By Product Configuration, 2026 to 2036
- Global Market Analysis and Forecast, By Nominal DC Voltage, 2021 to 2036
- Introduction / Key Findings
- Historical Market Size Value (USD Million) Analysis By Nominal DC Voltage, 2021 to 2025
- Current and Future Market Size Value (USD Million) Analysis and Forecast By Nominal DC Voltage, 2026 to 2036
- 750-850 VDC
- 600-749 VDC
- 851-1,000 VDC
- Above 1,000 VDC
- 750-850 VDC
- Y-o-Y Growth Trend Analysis By Nominal DC Voltage, 2021 to 2025
- Absolute $ Opportunity Analysis By Nominal DC Voltage, 2026 to 2036
- Global Market Analysis and Forecast, By Rack Power Density, 2021 to 2036
- Introduction / Key Findings
- Historical Market Size Value (USD Million) Analysis By Rack Power Density, 2021 to 2025
- Current and Future Market Size Value (USD Million) Analysis and Forecast By Rack Power Density, 2026 to 2036
- 250-500 kW
- Below 250 kW
- 501-750 kW
- Above 750 kW
- 250-500 kW
- Y-o-Y Growth Trend Analysis By Rack Power Density, 2021 to 2025
- Absolute $ Opportunity Analysis By Rack Power Density, 2026 to 2036
- Global Market Analysis and Forecast, By Data Center Type, 2021 to 2036
- Introduction / Key Findings
- Historical Market Size Value (USD Million) Analysis By Data Center Type, 2021 to 2025
- Current and Future Market Size Value (USD Million) Analysis and Forecast By Data Center Type, 2026 to 2036
- Hyperscale AI data centers
- Colocation AI facilities
- Enterprise / sovereign AI
- HPC & research centers
- Hyperscale AI data centers
- Y-o-Y Growth Trend Analysis By Data Center Type, 2021 to 2025
- Absolute $ Opportunity Analysis By Data Center Type, 2026 to 2036
- Global Market Analysis and Forecast, By Route to Market, 2021 to 2036
- Introduction / Key Findings
- Historical Market Size Value (USD Million) Analysis By Route to Market, 2021 to 2025
- Current and Future Market Size Value (USD Million) Analysis and Forecast By Route to Market, 2026 to 2036
- Power OEM direct
- Electrical EPC / system integrator
- Authorized distributor
- Retrofit / service channel
- Power OEM direct
- Y-o-Y Growth Trend Analysis By Route to Market, 2021 to 2025
- Absolute $ Opportunity Analysis By Route to Market, 2026 to 2036
- Global Market Analysis and Forecast, By Region, 2021 to 2036
- Introduction
- Historical Market Size Value (USD Million) Analysis By Region, 2021 to 2025
- Current Market Size Value (USD Million) Analysis and Forecast By Region, 2026 to 2036
- North America
- Latin America
- Western Europe
- Eastern Europe
- East Asia
- South Asia and Pacific
- Middle East & Africa
- Market Attractiveness Analysis By Region
- North America Market Analysis and Forecast, By Country, 2021 to 2036
- Historical Market Size Value (USD Million) Trend Analysis By Market Taxonomy, 2021 to 2025
- Market Size Value (USD Million) Forecast By Market Taxonomy, 2026 to 2036
- By Country
- USA
- Canada
- By Product Configuration
- By Nominal DC Voltage
- By Rack Power Density
- By Data Center Type
- By Route to Market
- By Country
- Market Attractiveness Analysis
- By Country
- By Product Configuration
- By Nominal DC Voltage
- By Rack Power Density
- By Data Center Type
- By Route to Market
- Key Takeaways
- Latin America Market Analysis and Forecast, By Country
- Historical Market Size Value (USD Million) Trend Analysis By Market Taxonomy, 2021 to 2025
- Market Size Value (USD Million) Forecast By Market Taxonomy, 2026 to 2036
- By Country
- Brazil
- Mexico
- Chile
- Rest of Latin America
- By Product Configuration
- By Nominal DC Voltage
- By Rack Power Density
- By Data Center Type
- By Route to Market
- By Country
- Market Attractiveness Analysis
- By Country
- By Product Configuration
- By Nominal DC Voltage
- By Rack Power Density
- By Data Center Type
- By Route to Market
- Key Takeaways
- Western Europe Market Analysis and Forecast, By Country
- Historical Market Size Value (USD Million) Trend Analysis By Market Taxonomy, 2021 to 2025
- Market Size Value (USD Million) Forecast By Market Taxonomy, 2026 to 2036
- By Country
- Germany
- UK
- Italy
- Spain
- France
- Nordic
- BENELUX
- Rest of Western Europe
- By Product Configuration
- By Nominal DC Voltage
- By Rack Power Density
- By Data Center Type
- By Route to Market
- By Country
- Market Attractiveness Analysis
- By Country
- By Product Configuration
- By Nominal DC Voltage
- By Rack Power Density
- By Data Center Type
- By Route to Market
- Key Takeaways
- Eastern Europe Market Analysis and Forecast, By Country
- Historical Market Size Value (USD Million) Trend Analysis By Market Taxonomy, 2021 to 2025
- Market Size Value (USD Million) Forecast By Market Taxonomy, 2026 to 2036
- By Country
- Russia
- Poland
- Hungary
- Balkan & Baltic
- Rest of Eastern Europe
- By Product Configuration
- By Nominal DC Voltage
- By Rack Power Density
- By Data Center Type
- By Route to Market
- By Country
- Market Attractiveness Analysis
- By Country
- By Product Configuration
- By Nominal DC Voltage
- By Rack Power Density
- By Data Center Type
- By Route to Market
- Key Takeaways
- East Asia Market Analysis and Forecast, By Country
- Historical Market Size Value (USD Million) Trend Analysis By Market Taxonomy, 2021 to 2025
- Market Size Value (USD Million) Forecast By Market Taxonomy, 2026 to 2036
- By Country
- China
- Japan
- South Korea
- By Product Configuration
- By Nominal DC Voltage
- By Rack Power Density
- By Data Center Type
- By Route to Market
- By Country
- Market Attractiveness Analysis
- By Country
- By Product Configuration
- By Nominal DC Voltage
- By Rack Power Density
- By Data Center Type
- By Route to Market
- Key Takeaways
- South Asia and Pacific Market Analysis and Forecast, By Country
- Historical Market Size Value (USD Million) Trend Analysis By Market Taxonomy, 2021 to 2025
- Market Size Value (USD Million) Forecast By Market Taxonomy, 2026 to 2036
- By Country
- India
- ASEAN
- Australia & New Zealand
- Rest of South Asia and Pacific
- By Product Configuration
- By Nominal DC Voltage
- By Rack Power Density
- By Data Center Type
- By Route to Market
- By Country
- Market Attractiveness Analysis
- By Country
- By Product Configuration
- By Nominal DC Voltage
- By Rack Power Density
- By Data Center Type
- By Route to Market
- Key Takeaways
- Middle East & Africa Market Analysis and Forecast, By Country
- Historical Market Size Value (USD Million) Trend Analysis By Market Taxonomy, 2021 to 2025
- Market Size Value (USD Million) Forecast By Market Taxonomy, 2026 to 2036
- By Country
- Kingdom of Saudi Arabia
- Other GCC Countries
- Türkiye
- South Africa
- Other African Union
- Rest of Middle East & Africa
- By Product Configuration
- By Nominal DC Voltage
- By Rack Power Density
- By Data Center Type
- By Route to Market
- By Country
- Market Attractiveness Analysis
- By Country
- By Product Configuration
- By Nominal DC Voltage
- By Rack Power Density
- By Data Center Type
- By Route to Market
- Key Takeaways
- Key Countries Market Analysis
- USA
- Pricing Analysis
- Market Share Analysis, 2025
- By Product Configuration
- By Nominal DC Voltage
- By Rack Power Density
- By Data Center Type
- By Route to Market
- Canada
- Pricing Analysis
- Market Share Analysis, 2025
- By Product Configuration
- By Nominal DC Voltage
- By Rack Power Density
- By Data Center Type
- By Route to Market
- Mexico
- Pricing Analysis
- Market Share Analysis, 2025
- By Product Configuration
- By Nominal DC Voltage
- By Rack Power Density
- By Data Center Type
- By Route to Market
- Brazil
- Pricing Analysis
- Market Share Analysis, 2025
- By Product Configuration
- By Nominal DC Voltage
- By Rack Power Density
- By Data Center Type
- By Route to Market
- Chile
- Pricing Analysis
- Market Share Analysis, 2025
- By Product Configuration
- By Nominal DC Voltage
- By Rack Power Density
- By Data Center Type
- By Route to Market
- Germany
- Pricing Analysis
- Market Share Analysis, 2025
- By Product Configuration
- By Nominal DC Voltage
- By Rack Power Density
- By Data Center Type
- By Route to Market
- UK
- Pricing Analysis
- Market Share Analysis, 2025
- By Product Configuration
- By Nominal DC Voltage
- By Rack Power Density
- By Data Center Type
- By Route to Market
- Italy
- Pricing Analysis
- Market Share Analysis, 2025
- By Product Configuration
- By Nominal DC Voltage
- By Rack Power Density
- By Data Center Type
- By Route to Market
- Spain
- Pricing Analysis
- Market Share Analysis, 2025
- By Product Configuration
- By Nominal DC Voltage
- By Rack Power Density
- By Data Center Type
- By Route to Market
- France
- Pricing Analysis
- Market Share Analysis, 2025
- By Product Configuration
- By Nominal DC Voltage
- By Rack Power Density
- By Data Center Type
- By Route to Market
- India
- Pricing Analysis
- Market Share Analysis, 2025
- By Product Configuration
- By Nominal DC Voltage
- By Rack Power Density
- By Data Center Type
- By Route to Market
- ASEAN
- Pricing Analysis
- Market Share Analysis, 2025
- By Product Configuration
- By Nominal DC Voltage
- By Rack Power Density
- By Data Center Type
- By Route to Market
- Australia & New Zealand
- Pricing Analysis
- Market Share Analysis, 2025
- By Product Configuration
- By Nominal DC Voltage
- By Rack Power Density
- By Data Center Type
- By Route to Market
- China
- Pricing Analysis
- Market Share Analysis, 2025
- By Product Configuration
- By Nominal DC Voltage
- By Rack Power Density
- By Data Center Type
- By Route to Market
- Japan
- Pricing Analysis
- Market Share Analysis, 2025
- By Product Configuration
- By Nominal DC Voltage
- By Rack Power Density
- By Data Center Type
- By Route to Market
- South Korea
- Pricing Analysis
- Market Share Analysis, 2025
- By Product Configuration
- By Nominal DC Voltage
- By Rack Power Density
- By Data Center Type
- By Route to Market
- Russia
- Pricing Analysis
- Market Share Analysis, 2025
- By Product Configuration
- By Nominal DC Voltage
- By Rack Power Density
- By Data Center Type
- By Route to Market
- Poland
- Pricing Analysis
- Market Share Analysis, 2025
- By Product Configuration
- By Nominal DC Voltage
- By Rack Power Density
- By Data Center Type
- By Route to Market
- Hungary
- Pricing Analysis
- Market Share Analysis, 2025
- By Product Configuration
- By Nominal DC Voltage
- By Rack Power Density
- By Data Center Type
- By Route to Market
- Kingdom of Saudi Arabia
- Pricing Analysis
- Market Share Analysis, 2025
- By Product Configuration
- By Nominal DC Voltage
- By Rack Power Density
- By Data Center Type
- By Route to Market
- Türkiye
- Pricing Analysis
- Market Share Analysis, 2025
- By Product Configuration
- By Nominal DC Voltage
- By Rack Power Density
- By Data Center Type
- By Route to Market
- South Africa
- Pricing Analysis
- Market Share Analysis, 2025
- By Product Configuration
- By Nominal DC Voltage
- By Rack Power Density
- By Data Center Type
- By Route to Market
- USA
- Market Structure Analysis
- Competition Dashboard
- Competition Benchmarking
- Market Share Analysis of Top Players
- By Regional
- By Product Configuration
- By Nominal DC Voltage
- By Rack Power Density
- By Data Center Type
- By Route to Market
- Emerging Startups
- Innovation Benchmarking
- Competition Analysis
- Competition Deep Dive
- Sensata Technologies
- Overview
- Product Portfolio
- Profitability by Market Segments
- Sales Footprint
- Strategy Overview
- Marketing Strategy
- Product Strategy
- Channel Strategy
- Eaton
- Littelfuse
- Sensata Technologies
- Case Studies
- Success Stories
- Recent Developments
- Competition Deep Dive
- Assumptions & Acronyms Used


