

- Market Size (2026)
- USD 19.8 Bn
- Forecast (2036)
- USD 187.2 Bn
- CAGR (2026 to 2036)
- 25.2%
How big is the AIOps platform market in 2026?
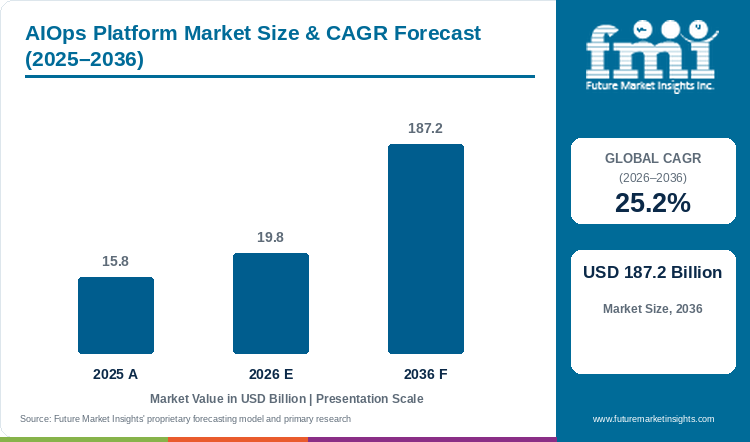
Demand is projected to expand at 25.2% CAGR from 2026 to 2036. Market value rises from USD 15.8 billion in 2025 to USD 19.78 billion in 2026 and USD 187.2 billion by 2036. [1]
FMI values the global AIOps platform market at USD 19.78 billion in 2026, compared with an estimated USD 15.8 billion in 2025. Sales are forecast to reach USD 187.2 billion by 2036, expanding at a massive 25.2% CAGR. AIOps platforms capture 74.6% of solution demand, while real-time analytics accounts for 41.3% of application demand, and the BFSI sector leads vertical adoption at 28.9%. Ultimately, the commercial purchasing case centers on whether a platform can seamlessly connect fragmented logs and metrics to the affected service, drastically reducing the operational work required for a useful, high-fidelity incident investigation.
Key Market Trends and Insights
- AIOps platforms account for 74.6% of solution demand in 2026, reflecting their central role in bringing monitoring evidence and operational investigation into a common environment. [1]
- Real-time analytics holds 41.3% of application demand in 2026, with the need to identify developing service failures supporting its leading position within the AIOps platform market. [1]
- BFSI accounts for 28.9% by vertical in 2026, with clear action permissions remaining part of purchasing when a platform supports financial-sector operational workflows. [1]
Regional Highlights
- Fastest-growing profiled market: China at 23.1% CAGR from 2026 to 2036. [1]
- Different architectures require different test workloads; generic demonstrations can miss the buyer's actual dependencies.
Market Size and Forecast
Table 1: Market size and forecast for the AIOps platform market in USD billion and percentage
| Metric | Value |
|---|---|
| 2025 market size | USD 15.8 billion |
| Estimated market size in 2026 | USD 19.78 billion |
| Projected market size by 2036 | USD 187.2 billion |
| CAGR 2026 to 2036 | 25.2% |
| Added revenue 2026 to 2036 | USD 167.42 billion |
| Market expansion multiple | 9.5x |
Cloud computing environments generate logs and metrics across connected services. AIOps platforms bring these records together so operators can identify the affected workload and investigate an incident with suitable action permissions.
Operational Evaluation and Log Research Evidence
AIOpsLab and Loghub provide defined environments, fault scenarios and log datasets for evaluating operational analysis. [2][3]
Table 2: Evidence and adoption indicators for the AIOps platform market
| Indicator | Data point or finding | Commercial relevance | Source |
|---|---|---|---|
| MLSys 2025 framework | AIOpsLab evaluates operational agents | Moves beyond isolated algorithm demonstrations | [2] |
| Fault-based evaluation | Controlled operational failure conditions | Supports reproducible qualification | [2] |
| Log research | Loghub collects system-log datasets | Provides a transparent evaluation resource | [3] |
Analyst Perspective
"Operational teams need a diagnosis they can trace to the service and records involved in an incident. A platform earns its place when that evidence helps people investigate faster and act with appropriate permissions. Buyers should test realistic faults and recovery paths before expanding automation, because a strong result in a controlled environment still needs to translate into dependable behavior across their own workloads and dependencies."
- Sudip Saha, Principal Consultant, FMI
How is the AIOps platform market segmented?
The market is segmented by solution; application; vertical, and region.
By solution: AIOps platforms; Implementation services; Maintenance; Training; Other services. By application: Real-time analytics; Application performance; Infrastructure management; Other applications. By vertical: BFSI; Healthcare; Retail; IT and telecom; Other industries.
Why do AIOps platforms lead demand within the solution category?
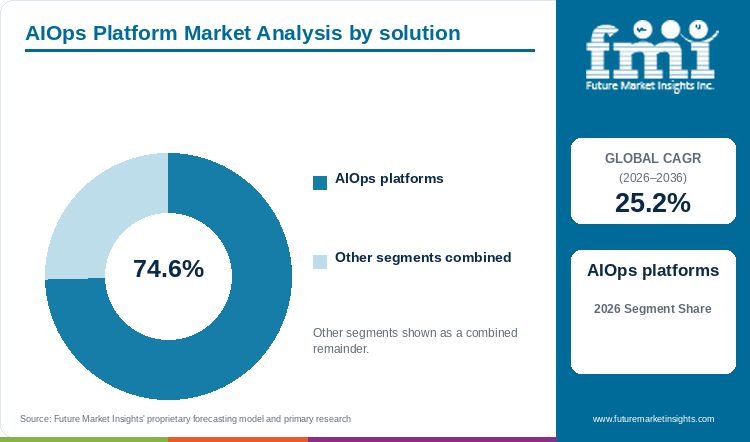
The aiops platforms segment accounts for 74.6% of solution demand in 2026. [1]
AIOps platforms lead the solution category because they connect operational evidence held in separate monitoring tools and make that information available within a shared investigation workflow. IT asset management adds the inventory context needed to associate telemetry with an application, device or service, while dependency mapping helps operators understand which workload is affected. The integrated platform therefore addresses a coordination problem as well as a data-processing task. Its value depends on the completeness of those connections and on whether the resulting diagnosis supports a useful operational response.
- AIOps platforms account for 74.6% of solution demand in 2026, reflecting their central role in bringing monitoring evidence and operational investigation into a common environment. [1]
- Buyers should test whether telemetry maps consistently to their actual services and dependencies, since correlation becomes useful when it identifies the affected workload and supports an appropriate response.
Table 3: Leading solution share for the AIOps platform market
| Solution | Share in 2026 |
|---|---|
| AIOps platforms | 74.6% |
| Other segments combined | 25.4% |
| Total | 100.0% |
Why does real-time analytics lead demand within the application category?
The real-time analytics segment accounts for 41.3% of application demand in 2026. [1]
Real-time analytics leads application demand because operational teams need to recognize a developing failure while its effects are still changing across connected services. Bringing logs and metrics together can help them assess the affected workload and decide which investigation deserves attention, provided the detection is accurate enough for the environment. Help desk software connects those findings with incident records and the people responsible for restoring service. Timeliness therefore has practical value when it improves the response workflow, rather than simply increasing the frequency of alerts delivered to operators.
- Real-time analytics holds 41.3% of application demand in 2026, with the need to identify developing service failures supporting its leading position within the AIOps platform market. [1]
- A timely signal needs accurate service context and a clear incident owner, allowing operational teams to connect detection with investigation, escalation and the actions required to restore service.
What are the drivers restraints and opportunities in the AIOps platform market?
- Correlated logs and metrics can reduce incident investigation work when a platform connects evidence to the failing service, giving operators a clearer basis for prioritizing incidents and selecting an appropriate response within their own environment.
- Production workloads and service dependencies can differ from controlled tests, so buyers need realistic failure scenarios and clear action permissions before operational agents are deployed across systems supporting live services. [2]
- Reproducible fault evaluation creates an opportunity to qualify suppliers through comparable investigations, combining public research datasets with representative labeled incidents from the buyer’s environment and assessing recovery behavior alongside detection quality. [2][3]
Correlated evidence can reduce incident investigation work
Logs and metrics describe different aspects of a failing service, so their correlation becomes useful when it shortens an actual investigation and connects the evidence with the workload requiring attention.
Production failures are harder than isolated tests
AIOpsLab provides end-to-end agent evaluation in controlled environments, while production deployment needs tests reflecting the operator’s workloads and dependencies together with clear permissions and recovery procedures. [2]
Reproducible fault tests can improve qualification
Loghub’s published system-log datasets provide a basis for reproducible research tests, which buyers can combine with their own labeled incidents when comparing operational analysis. AI platform capabilities become useful when the diagnosis is traceable to underlying records and the operator has a clear route for reviewing, approving and reversing an action. [3]
Which country CAGRs are profiled in the AIOps platform market?
Table 5: Country CAGR comparison for the AIOps platform market
| Country | CAGR 2026 to 2036 |
|---|---|
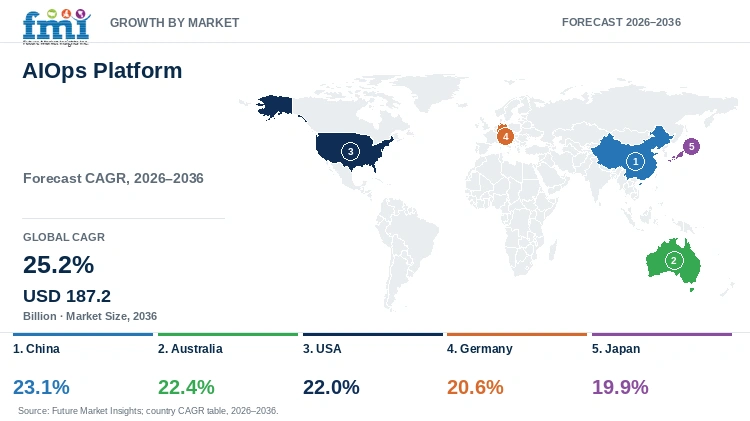
| China | 23.1% |
| Australia | 22.4% |
| USA | 22.0% |
| Germany | 20.6% |
| Japan | 19.9% |
Country-wise Analysis
China
Large monitoring environments in China need consistent service identities across telemetry so that a platform can map evidence to the affected workload and support a useful operational action. This operational visibility must strictly align with China’s Data Security Law (DSL) and Personal Information Protection Law (PIPL), which mandate rigorous data localization and heavily restrict the cross-border transfer of sensitive operational logs and network topology data. Furthermore, the China Academy of Information and Communications Technology (CAICT) actively establishes national standards for intelligent IT operations, guiding enterprises on secure, compliant AIOps deployment and algorithmic transparency. FMI projects a 23.1% CAGR from 2026 to 2036.
Australia
Geographically separated services make dependency and latency incidents highly relevant to Australian buyers, whose tests need to reflect those vast physical conditions and edge-to-core network realities. This necessity for distributed latency monitoring is reinforced by the Australian Cyber Security Centre (ACSC) and the Digital Transformation Agency (DTA), which enforce strict data sovereignty and cloud hosting guidelines for critical infrastructure and government entities, ensuring that automated AIOps remediation actions do not inadvertently route sensitive telemetry outside approved regional boundaries. FMI forecasts a 22.4% CAGR from 2026 to 2036.
USA
Controlled failure scenarios give US cloud buyers a structured approach to agent assessment, although production permissions and automated recovery procedures remain highly specific to the operator and the regulatory sector. In federal, financial, and healthcare environments, AIOps automation must comply with the rigorous security controls of FedRAMP and align with the National Institute of Standards and Technology (NIST) AI Risk Management Framework (AI RMF) and Cybersecurity Framework (CSF). These frameworks ensure that autonomous remediation actions are fully auditable, secure, and safely reversible. The USA market is forecast to grow at a 22.0% CAGR from 2026 to 2036.
Germany
German buyers need to explicitly agree which operational logs and metrics can leave their environment and which automated actions are permitted before integrating an AIOps platform. This intense scrutiny is driven by the strict mandates of the EU’s General Data Protection Regulation (GDPR) since system logs frequently contain personal identifiers such as IP addresses or user behavior patterns and the Federal Office for Information Security (BSI) IT-Grundschutz baseline standards. Additionally, powerful local works councils (Betriebsrat) frequently exercise co-determination rights, requiring extensive review of any AI-driven tools that could be interpreted as monitoring employee productivity or automating IT workflow interventions. The market is projected to expand at a 20.6% CAGR from 2026 to 2036.
Japan
Uneven telemetry from deeply entrenched legacy systems makes actual monitoring gaps highly relevant to platform qualification in Japan. To combat the severe operational and economic risks associated with aging IT infrastructure—widely recognized by the Ministry of Economy, Trade and Industry (METI) as the "2025 Cliff" enterprises are heavily prioritizing AIOps platforms that can bridge the observability gap between modern cloud-native workloads and legacy mainframes. This modernization push requires platforms to normalize fragmented data while strictly complying with the Act on the Protection of Personal Information (APPI). FMI forecasts a 19.9% CAGR from 2026 to 2036 as buyers rigorously assess the completeness and consistency of service records.
Who are the notable companies in the AIOps platform market?
Notable companies include IBM; Dynatrace; BigPanda; BMC; Splunk
Competitive Benchmarking
Table 6: Competitive positioning for the AIOps platform market
| Company or institution | Positioning | Evidence or purchasing distinction |
|---|---|---|
| IBM | Integrated operations software | Enterprise workflow position [1] |
| Dynatrace | Observability platform | Telemetry and application context [1] |
| BigPanda | Event management | Alert correlation position [1] |
| BMC | AIOps and operations software | Helix documentation describes correlated events and AI-assisted grouping of service-impacting situations. [4] |
| Splunk | AIOps and service intelligence software | IT Service Intelligence is described as an AIOps solution for IT operations teams. [5] |
Key Developments in the AIOps Platform Market
- AIOpsLab was published at MLSys 2025 as a framework for evaluating operational agents through controlled cloud environments, faults and workloads, providing a defined approach to examining investigation and action across an incident workflow. [2]
- Loghub provides published system-log datasets for AI-driven analytics research, allowing researchers to work with defined records and compare analysis approaches while retaining the differences between those datasets and an operator’s production environment. [3]
Key Players in the AIOps Platform Market
IBM; BMC; Broadcom; Dynatrace; Splunk; HCL Technologies; BigPanda; ProphetStor.
AIOps Platform Market Report Scope
Table 7: Report coverage for the AIOps platform market
| Coverage field | Report scope |
|---|---|
| Market breakdown | Solution; Application; Vertical; region |
| Quantitative units | USD billion |
| Market definition | Platforms applying AI to operational telemetry and incident workflows. Related implementation and maintenance are included within their defined solution category. General cloud infrastructure is excluded. |
| Regions covered | North America; Latin America; Western Europe; Eastern Europe; East Asia; South Asia and Pacific; Middle East and Africa |
| Countries profiled | China; Australia; USA; Germany; Japan |
| Key companies profiled | IBM; BMC; Broadcom; Dynatrace; Splunk; HCL Technologies; BigPanda; ProphetStor |
| Forecast period | 2026 to 2036 |
AIOps Platform Market Research Methodology
Table 8: Research methods for the AIOps platform market
| Method | Approach |
|---|---|
| Market coverage | AIOps platforms and related implementation, maintenance and training services used to connect operational telemetry with investigation and response. |
| Public industry evidence | The AIOpsLab framework and Loghub system-log datasets. |
| Operating and technical context | Controlled cloud faults, operational-agent workflows and reproducible log analysis. |
| Product and service assessment | Service identities, telemetry completeness, dependency mapping, investigation quality and action permissions. |
| Supplier research | Official company disclosures establish documented products, services and participation roles. |
| Country and segment analysis | Examine local operating conditions and the purchasing requirements of each market category. |
| Interpretation of industry indicators | Results from controlled research environments from behavior in production workloads whose dependencies, permissions and recovery procedures are specific to the operator. |
AIOps Platform Market by Segments
By solution
- AIOps platforms
- Implementation services
- Maintenance
- Training
- Other services
By application
- Real-time analytics
- Application performance
- Infrastructure management
- Other applications
By vertical
- BFSI
- Healthcare
- Retail
- IT and telecom
- Other industries
AIOps Platform Market by Region
- North America
- USA
- Canada
- Latin America
- Brazil
- Mexico
- Argentina
- Chile
- Western Europe
- Germany
- France
- UK
- Italy
- Spain
- Benelux
- Nordics
- Eastern Europe
- Poland
- Czech Republic
- Romania
- Hungary
- East Asia
- China
- Japan
- South Korea
- South Asia and Pacific
- India
- ASEAN
- Australia and New Zealand
- Middle East and Africa
- GCC countries
- South Africa
- Türkiye
- Israel
Research Sources and Bibliography
- [1] Future Market Insights. Published outlook accessed 12 October 2026. AIOps Platform Market.
- [2] Chen and colleagues. MLSys 2025. AIOpsLab: A Holistic Framework to Evaluate AI Agents for Enabling Autonomous Clouds.
- [3] He and colleagues. 2023. Loghub: A Large Collection of System Log Datasets for AI-driven Log Analytics.
- [4] BMC. Situations overview. Accessed 13 October 2026.
- [5] Splunk. Splunk IT Service Intelligence. Accessed 13 October 2026.
This Report Answers
- How big is the AIOps platform market in 2026?
- What market value is projected by 2036?
- Which solution segment leads demand?
- Which other commercial categories shape the market?
- Which countries have the fastest profiled growth?
- Which companies and institutions participate in the market?
Frequently Asked Questions
How large is the AIOps platform market in 2026?
FMI estimates market value at USD 19.78 billion in 2026, compared with an estimated USD 15.8 billion in 2025. [1]
What value and CAGR are projected through 2036?
Market value is projected to reach USD 187.2 billion by 2036 at a 25.2% CAGR from 2026 to 2036. [1]
Which solution segment leads in 2026?
AIOps platforms account for 74.6% of this category. [1]
What is the report segmentation?
Solution; Application; Vertical, and region.
Which profiled market records the highest CAGR?
China has the highest profiled rate at 23.1% from 2026 to 2036. [1]
Who are the key participants?
IBM; BMC; Broadcom; Dynatrace; Splunk; HCL Technologies; BigPanda; ProphetStor.
Preview the report firsthand - request a free sample
Get SampleGet the brochure for pricing and purchase details.
Get PDFTable of Content
- Key Takeaways
- Market Size and CAGR
- Top Growth Driver
- Fastest Growing Segment
- Leading Region
- Key Companies
- Emerging Opportunities
- Executive Summary
- Global Market Outlook
- Demand-side Trends
- Supply-side Trends
- Technology Roadmap Analysis
- Analysis and Recommendations
- Analyst Perspective (What is happening? Why now? What should investors know?)
- Key Questions Answered
- How large is the market?
- What is the CAGR?
- What are key trends?
- Which region dominates?
- Who are the leaders?
- Market Overview
- Market Coverage / Taxonomy
- Market Definition / Scope / Limitations
- Research Methodology
- Chapter Orientation
- Analytical Lens and Working Hypotheses
- Market Structure, Signals, and Trend Drivers
- Benchmarking and Cross-market Comparability
- Market Sizing, Forecasting, and Opportunity Mapping
- Research Design and Evidence Framework
- Desk Research Programme (Secondary Evidence)
- Expert Input and Fieldwork (Primary Evidence)
- Tooling, Models, and Reference Databases
- Data Engineering and Model Build
- Quality Assurance and Audit Trail
- Market Background
- Market Dynamics (Drivers, Restraints, Opportunity, Trends)
- Scenario Forecast (Optimistic, Likely, Conservative)
- Impact Analysis
- AI Impact
- Sustainability Impact
- Regulatory Impact
- Technology Impact
- Consumer / Buyer Analysis
- Purchase Drivers
- Adoption Barriers
- Buyer Journey
- Opportunity Map Analysis
- Product Life Cycle Analysis
- Supply Chain Analysis
- Investment Feasibility Matrix
- Value Chain Analysis
- PESTLE and Porter's Analysis
- Regulatory Landscape
- Regional Parent Market Outlook
- Production and Consumption Statistics
- Import and Export Statistics
- Global Market Analysis and Forecast, 2021 to 2036
- Historical Market Size Value (USD Billion) Analysis, 2021 to 2025
- Current and Future Market Size Value (USD Billion) Projections, 2026 to 2036
- Y-o-Y Growth Trend Analysis
- Absolute $ Opportunity Analysis
- Global Market Pricing Analysis, 2021 to 2036
- Global Market Analysis and Forecast, By solution, 2021 to 2036
- Introduction / Key Findings
- Historical Market Size Value (USD Billion) Analysis By solution, 2021 to 2025
- Current and Future Market Size Value (USD Billion) Analysis and Forecast By solution, 2026 to 2036
- AIOps platforms
- Implementation services
- Maintenance
- Training
- Other services
- Y-o-Y Growth Trend Analysis By solution, 2021 to 2025
- Absolute $ Opportunity Analysis By solution, 2026 to 2036
- Global Market Analysis and Forecast, By application, 2021 to 2036
- Introduction / Key Findings
- Historical Market Size Value (USD Billion) Analysis By application, 2021 to 2025
- Current and Future Market Size Value (USD Billion) Analysis and Forecast By application, 2026 to 2036
- Real-time analytics
- Application performance
- Infrastructure management
- Other applications
- Y-o-Y Growth Trend Analysis By application, 2021 to 2025
- Absolute $ Opportunity Analysis By application, 2026 to 2036
- Global Market Analysis and Forecast, By vertical, 2021 to 2036
- Introduction / Key Findings
- Historical Market Size Value (USD Billion) Analysis By vertical, 2021 to 2025
- Current and Future Market Size Value (USD Billion) Analysis and Forecast By vertical, 2026 to 2036
- BFSI
- Healthcare
- Retail
- IT and telecom
- Other industries
- Y-o-Y Growth Trend Analysis By vertical, 2021 to 2025
- Absolute $ Opportunity Analysis By vertical, 2026 to 2036
- Global Market Analysis and Forecast, By Region, 2021 to 2036
- Introduction
- Historical Market Size Value (USD Billion) Analysis By Region, 2021 to 2025
- Current Market Size Value (USD Billion) Analysis and Forecast By Region, 2026 to 2036
- North America
- Latin America
- Western Europe
- Eastern Europe
- East Asia
- South Asia and Pacific
- Middle East and Africa
- Market Attractiveness Analysis By Region
- North America Market Analysis and Forecast, By Country, 2021 to 2036
- Historical Market Size Value (USD Billion) Trend Analysis By Market Taxonomy, 2021 to 2025
- Market Size Value (USD Billion) Forecast By Market Taxonomy, 2026 to 2036
- By Country
- USA
- Canada
- By solution
- By application
- By vertical
- By Country
- Market Attractiveness Analysis
- By Country
- By solution
- By application
- By vertical
- Key Takeaways
- Latin America Market Analysis and Forecast, By Country
- Historical Market Size Value (USD Billion) Trend Analysis By Market Taxonomy, 2021 to 2025
- Market Size Value (USD Billion) Forecast By Market Taxonomy, 2026 to 2036
- By Country
- Brazil
- Mexico
- Argentina
- Chile
- By solution
- By application
- By vertical
- By Country
- Market Attractiveness Analysis
- By Country
- By solution
- By application
- By vertical
- Key Takeaways
- Western Europe Market Analysis and Forecast, By Country
- Historical Market Size Value (USD Billion) Trend Analysis By Market Taxonomy, 2021 to 2025
- Market Size Value (USD Billion) Forecast By Market Taxonomy, 2026 to 2036
- By Country
- Germany
- France
- UK
- Italy
- Spain
- Benelux
- Nordics
- By solution
- By application
- By vertical
- By Country
- Market Attractiveness Analysis
- By Country
- By solution
- By application
- By vertical
- Key Takeaways
- Eastern Europe Market Analysis and Forecast, By Country
- Historical Market Size Value (USD Billion) Trend Analysis By Market Taxonomy, 2021 to 2025
- Market Size Value (USD Billion) Forecast By Market Taxonomy, 2026 to 2036
- By Country
- Poland
- Czech Republic
- Romania
- Hungary
- By solution
- By application
- By vertical
- By Country
- Market Attractiveness Analysis
- By Country
- By solution
- By application
- By vertical
- Key Takeaways
- East Asia Market Analysis and Forecast, By Country
- Historical Market Size Value (USD Billion) Trend Analysis By Market Taxonomy, 2021 to 2025
- Market Size Value (USD Billion) Forecast By Market Taxonomy, 2026 to 2036
- By Country
- China
- Japan
- South Korea
- By solution
- By application
- By vertical
- By Country
- Market Attractiveness Analysis
- By Country
- By solution
- By application
- By vertical
- Key Takeaways
- South Asia and Pacific Market Analysis and Forecast, By Country
- Historical Market Size Value (USD Billion) Trend Analysis By Market Taxonomy, 2021 to 2025
- Market Size Value (USD Billion) Forecast By Market Taxonomy, 2026 to 2036
- By Country
- India
- ASEAN
- Australia and New Zealand
- By solution
- By application
- By vertical
- By Country
- Market Attractiveness Analysis
- By Country
- By solution
- By application
- By vertical
- Key Takeaways
- Middle East and Africa Market Analysis and Forecast, By Country
- Historical Market Size Value (USD Billion) Trend Analysis By Market Taxonomy, 2021 to 2025
- Market Size Value (USD Billion) Forecast By Market Taxonomy, 2026 to 2036
- By Country
- GCC countries
- South Africa
- Türkiye
- Israel
- By solution
- By application
- By vertical
- By Country
- Market Attractiveness Analysis
- By Country
- By solution
- By application
- By vertical
- Key Takeaways
- Key Countries Market Analysis
- USA
- Pricing Analysis
- Market Share Analysis, 2025
- By solution
- By application
- By vertical
- Canada
- Pricing Analysis
- Market Share Analysis, 2025
- By solution
- By application
- By vertical
- Mexico
- Pricing Analysis
- Market Share Analysis, 2025
- By solution
- By application
- By vertical
- Brazil
- Pricing Analysis
- Market Share Analysis, 2025
- By solution
- By application
- By vertical
- Chile
- Pricing Analysis
- Market Share Analysis, 2025
- By solution
- By application
- By vertical
- Germany
- Pricing Analysis
- Market Share Analysis, 2025
- By solution
- By application
- By vertical
- UK
- Pricing Analysis
- Market Share Analysis, 2025
- By solution
- By application
- By vertical
- Italy
- Pricing Analysis
- Market Share Analysis, 2025
- By solution
- By application
- By vertical
- Spain
- Pricing Analysis
- Market Share Analysis, 2025
- By solution
- By application
- By vertical
- France
- Pricing Analysis
- Market Share Analysis, 2025
- By solution
- By application
- By vertical
- India
- Pricing Analysis
- Market Share Analysis, 2025
- By solution
- By application
- By vertical
- ASEAN
- Pricing Analysis
- Market Share Analysis, 2025
- By solution
- By application
- By vertical
- Australia and New Zealand
- Pricing Analysis
- Market Share Analysis, 2025
- By solution
- By application
- By vertical
- China
- Pricing Analysis
- Market Share Analysis, 2025
- By solution
- By application
- By vertical
- Japan
- Pricing Analysis
- Market Share Analysis, 2025
- By solution
- By application
- By vertical
- South Korea
- Pricing Analysis
- Market Share Analysis, 2025
- By solution
- By application
- By vertical
- Poland
- Pricing Analysis
- Market Share Analysis, 2025
- By solution
- By application
- By vertical
- Hungary
- Pricing Analysis
- Market Share Analysis, 2025
- By solution
- By application
- By vertical
- Türkiye
- Pricing Analysis
- Market Share Analysis, 2025
- By solution
- By application
- By vertical
- South Africa
- Pricing Analysis
- Market Share Analysis, 2025
- By solution
- By application
- By vertical
- Australia
- Pricing Analysis
- Market Share Analysis, 2025
- By solution
- By application
- By vertical
- USA
- Market Structure Analysis
- Competition Dashboard
- Competition Benchmarking
- Market Share Analysis of Top Players
- By Regional
- By solution
- By application
- By vertical
- Emerging Startups
- Innovation Benchmarking
- Competition Analysis
- Competition Deep Dive
- IBM
- Overview
- Product Portfolio
- Profitability by Market Segments
- Sales Footprint
- Strategy Overview
- Marketing Strategy
- Product Strategy
- Channel Strategy
- Dynatrace
- BigPanda
- BMC
- Splunk
- IBM
- Case Studies
- Success Stories
- Recent Developments
- Competition Deep Dive
- Assumptions & Acronyms Used


