
- Market Size (2026)
- USD 15.6 Bn
- Forecast (2036)
- USD 38.3 Bn
- CAGR (2026 to 2036)
- 9.4%
How big is Help Desk Software Market in 2026?
The global help desk software market is estimated at USD 14.3 billion in 2025 and is expected to reach USD 15.6 billion in 2026. Over 2026 to 2036, sales of help desk software are likely to grow at a CAGR of 9.4% and reach USD 38.3 billion. In FMI analysis, cloud-based software leads type with an estimated 61.3% share in 2026.
Demand for help desk software is rising as AI agents now handle a large part of routine service requests. Sales of hosted help desks also benefit from broad cloud use among businesses. This is visible in Eurostat data, as 52.7% of EU enterprises paid for cloud services in 2025, nearly triple the 17.8% of 2014. Consequently, most mid-sized buyers can switch to hosted tools without new infrastructure. For instance, Zendesk said in March 2026 that Zendesk AI agents routinely resolve over 80% of interactions end-to-end. FMI analysis indicates that buyers now judge platforms on resolved outcomes, as Freshworks said Freddy AI Copilot was attached to over 71% of new enterprise deals in the second quarter of 2026. Adoption of AI agents is therefore likely to become a normal part of help desk contracts through 2036.
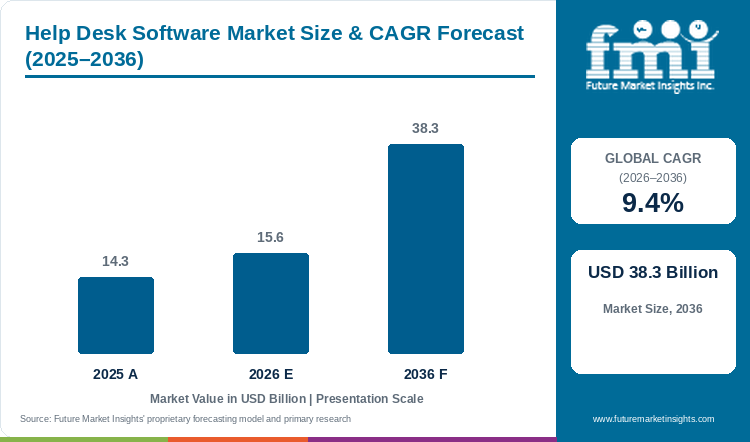
Table 1: Help Desk Software Market Size and Forecast (USD billion), 2025 to 2036
| Market size and forecast | Value |
|---|---|
| 2025 market size | USD 14.3 billion |
| Estimated market size in 2026 | USD 15.6 billion |
| Projected market size by 2036 | USD 38.3 billion |
| CAGR (2026 to 2036) | 9.4% |
| Added sales, 2026 to 2036 | USD 22.7 billion |
Key Market Trends & Insights
- By type: Hosted tools need no servers and update automatically, so cloud-based help desks will hold 61.3% of 2026 type sales against 38.7% for web-based tools.
- By application: Large enterprises account for an estimated 58.7% of 2026 application sales, as multi-team service desks need routing, analytics and integrations at scale.
- By region: North America leads with about 41.5% of sales, supported by early cloud adoption and a large base of service staff.
Regional Highlights
- Fastest-growing country: India has the top rate among profiled countries, a 12.6% CAGR for 2026 to 2036, as software exporters and digital service firms build support teams.
- Growth across other countries: China is projected at 11.3% and Brazil at 10.5%, as online commerce grows in both. The United States (9.1%) and the United Kingdom (8.7%) grow more slowly, since adoption there is already high. Germany is projected at 8.2%, and Japan closes the table at 7.6%.
Service labour is the main constraint on capacity, and software fills the gap. The US Bureau of Labor Statistics counts 2,666,000 customer service representative jobs in 2025 and projects a 5% decline from 2025 to 2035. With fewer agents handling more contacts, each remaining agent needs better tools, which supports spend per seat. Hosted infrastructure is already in place at most mid-sized firms. Customer relationship management software was used by 27.9% of EU enterprises in 2025. Consequently, help desk vendors can sell into existing CRM estates through integrations, which shortens deployment.
Buyer preference for AI-led service platforms is rising, and large vendors are growing faster than the market. Salesforce reported Agentforce ARR above USD 1.5 billion in the second quarter of fiscal 2027, up over 240%. Rapid AI growth at the largest CRM vendor shows customers paying for automated service agents on top of seats. Consolidation is also reshaping the field, as large help desks buy AI start-ups. Zendesk agreed in March 2026 to acquire Forethought, an AI agent platform. Deals of this kind fold specialist AI start-ups into established help desks, which raises entry barriers for smaller vendors.
IT service management tools are growing fastest, as supplier results confirm. Freshworks said EX ARR grew 24% year over year in the second quarter of 2026. Faster growth in employee service than in the group overall shows IT help desks moving to cloud platforms. Results at Atlassian point the same way for IT service desks. Atlassian reported fourth-quarter fiscal 2026 cloud revenue of USD 1,213 million, up 31%. Cloud gains of this size reflect customers moving Jira Service Management and related tools off self-managed servers. AI use across businesses supports the shift, so vendors without AI agents risk losing renewals.
Table 2: Supporting Industry Indicators for the Help Desk Software Market, 2024 to 2026
| Indicator | Data point | Why it matters | Source |
|---|---|---|---|
| US customer service representatives | 2,666,000 jobs in 2025 | Sets the size of the agent base using help desks | |
| Projected agent employment change | 5% decline from 2025 to 2035 | Fewer agents push more work onto software | |
| EU enterprises paying for cloud | 52.7% in 2025, up from 17.8% in 2014 | Cloud buying is now mainstream | |
| EU enterprises using cloud CRM | 27.9% in 2025 | CRM estates offer integration points for help desks | |
| EU enterprises using AI | 20% in 2025, up from 13.5% in 2024 | AI use supports automated ticket handling | |
| Zendesk AI resolution | Over 80% of interactions resolved end-to-end, March 2026 | Automation shifts pricing toward outcomes | |
| Freshworks EX ARR growth | 24% in the second quarter of 2026 | IT service desks are moving to cloud tools | |
| Freddy AI Copilot attach rate | Over 71% of new enterprise deals, second quarter 2026 | AI modules are becoming standard | |
| Atlassian cloud revenue | USD 1,213 million in fourth-quarter fiscal 2026, up 31% | Self-managed customers are moving to cloud | |
| Salesforce Agentforce ARR | Above USD 1.5 billion, up over 240%, second quarter fiscal 2027 | Buyers pay for AI service agents | |
| ServiceNow subscription sales | USD 3,877 million in the second quarter of 2026, up 24.5% | Enterprise service platforms keep scaling |
Demand Intensity Analysis
Labour cost gives the clearest outside yardstick for help desk budgets. The US had 2,666,000 customer service representatives in 2025, with median pay of USD 44,770 a year. On those figures, the US median-pay bill for these agents comes to about USD 119.4 billion. Set against that bill, the help desk software market, estimated at USD 14.3 billion in 2025, equals about 12% of US agent pay alone. The market is global and also serves IT staff, so the true ratio to all service labour is lower, which leaves ample room for software to replace manual work.
The leading type segment can also be checked against the size of a large vendor. Multiplying the 61.3% cloud share by 2026 sales gives about USD 9.6 billion for hosted help desks. Atlassian reported fiscal 2026 revenue of USD 6,572 million, up 26%. The cloud segment is therefore about 1.45 times the entire Atlassian business, which also includes developer and collaboration tools. The comparison shows a segment large enough to support several platform vendors of Atlassian scale.
Growth at active vendors puts the forecast in context. Freshworks expects 2026 revenue of USD 963.5 million to USD 966.5 million, roughly 15% growth, and ServiceNow guides subscription growth of 22.5%. The 9.4% market CAGR for 2026 to 2036 runs well below those rates. Older on-premise and small vendors are losing customers to these platforms. The forecast therefore implies that platform leaders gain share, so growth concentrates among a few AI-led suppliers.
Looking at value per agent shows how much more software each service worker now uses. Dividing the 2025 estimate by US agent jobs gives about USD 5,364 of software per customer service representative. BLS projects a 5% fall in these jobs from 2025 to 2035. With the market rising 2.46 times from 2026 to 2036 and agent numbers falling, software value per agent would rise about 10% a year. With value per agent rising, vendors will price on automation and resolution, more than on seat counts.
Table 3: Demand Intensity Metrics for the Help Desk Software Market, 2024 to 2026 Data Against 2025 and 2026 Market Values
| Demand intensity metric | Value | Basis |
|---|---|---|
| US customer service representative jobs, 2025 | 2,666,000 | US Bureau of Labor Statistics |
| Median pay, May 2025 | USD 44,770 a year | US Bureau of Labor Statistics |
| US median-pay bill for customer service representatives | About USD 119.4 billion | Calculated from US Bureau of Labor Statistics jobs and median pay |
| 2025 market value as a share of the US median-pay bill | About 12% | Calculated from US Bureau of Labor Statistics figures and the 2025 market value |
| Atlassian revenue, fiscal 2026 | USD 6,572 million | Atlassian, fourth-quarter fiscal 2026 results |
| Cloud-based segment value against Atlassian revenue | About 1.45 times | Calculated from Atlassian revenue and the 61.3% cloud-based share of the 2026 market value |
| Freshworks revenue guidance, 2026 | USD 963.5 million to USD 966.5 million | Freshworks, second-quarter 2026 results |
| Market value per US customer service representative | About USD 5,364 | Calculated from US Bureau of Labor Statistics jobs and the 2025 market value |
| Projected change in agent jobs, 2025 to 2035 | 5% decline | US Bureau of Labor Statistics |
| Implied annual rise in software value per agent | About 10% | Calculated from the 2026 to 2036 market CAGR and the projected agent decline |
Analyst Perspective
“Help desk software is moving from ticket queues to AI agents that close cases unaided. Vendors that price on resolved outcomes will win larger contracts than those selling seats. IT service desks are now growing faster than customer support desks, and that gap is likely to persist through the decade.”
- Sudip saha, Principal Consultant, Future Market Insights.
How is the help desk software market segmented?
The market is segmented into type, application, and region. Cloud-based software is expected to lead type with 61.3% share in 2026, and large enterprises lead application with an estimated 58.7%.
By type: cloud-based and web-based.
By application: large enterprises and small and medium enterprises.
By region: customer support and IT service desks across North America, Latin America, Western Europe, Eastern Europe, East Asia, South Asia and Pacific, and Middle East and Africa.
Why does cloud-based software lead help desk sales by type?
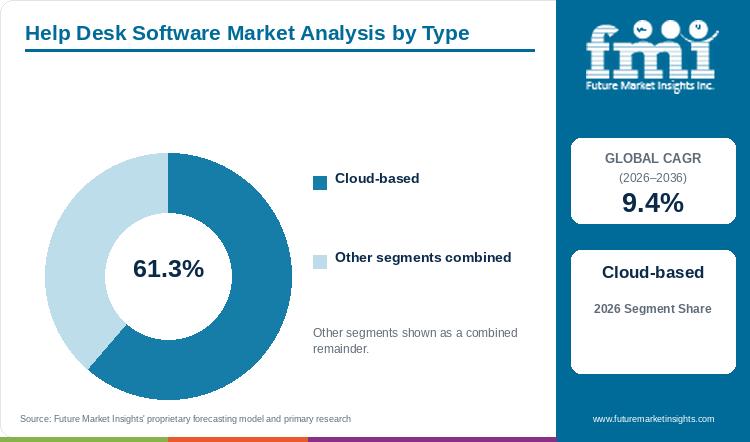
Cloud-based software is expected to lead type sales with 61.3% share in 2026, ahead of web-based tools at an estimated 38.7%.
Table 4: Type Share for the Help Desk Software Market (percentage share), 2026
| Type | Estimated Share (2026) |
|---|---|
| Cloud-based | 61.3% |
| Web-based | 38.7% |
| Total | 100.0% |
Table 5: Type Leadership and Market Growth for the Help Desk Software Market (segment and CAGR percentage), 2026 to 2036
| Metric | Value |
|---|---|
| Global CAGR (2026 to 2036) | 9.4% |
| Leading Segment | Cloud-based |
Adoption of hosted help desks removes server upkeep and delivers AI features as soon as vendors release them, so cloud-based software leads type sales. FMI estimates cloud-based tools at 61.3% of 2026 type sales, against 38.7% for web-based tools hosted by customers or partners. Web-based tools stay common in regulated firms that keep data on in-house systems. Migration away from self-managed products is visible at large vendors. Atlassian expects Data Center revenue to decline about 17% in fiscal 2027, after fiscal 2026 cloud growth of 31% in the fourth quarter. The planned decline in self-managed sales confirms that new spend goes to cloud versions, which widens the cloud lead through 2036.
- Sales of cloud-based help desks cover multi-tenant ticketing, hosted knowledge bases, cloud chat and AI agent services.
- Broader cloud spend supports this shift, and the cloud service market is projected to grow at a 15.7% CAGR through 2035. Larger cloud estates make hosted help desks the default choice.
Why do large enterprises lead help desk sales by application?
Large enterprises are expected to lead application sales with 58.7% share in 2026, ahead of small and medium enterprises at an estimated 41.3%.
Table 6: Application Share for the Help Desk Software Market (percentage share), 2026
| Application | Estimated Share (2026) |
|---|---|
| Large Enterprises | 58.7% |
| Small and Medium Enterprises | 41.3% |
| Total | 100.0% |
Large organisations run separate desks for customers, IT, HR and facilities, so large enterprises lead application sales. FMI places large enterprises at 58.7% of 2026 sales, with small and medium enterprises at 41.3%. Smaller firms buy simpler plans online, which keeps deal sizes low but volumes high. Large accounts are expanding faster than small ones at the major help desk vendors. Freshworks counted 1,746 customers contributing more than USD 100,000 in ARR in the second quarter of 2026, up 25%. Faster growth among large accounts shows vendors moving upmarket, which keeps large enterprises ahead.
- Global customer support centres, enterprise IT service desks and shared service centres make up the large enterprise group.
- Remote support tools sit beside help desks in IT teams, and the remote desktop software market is projected to reach USD 10.2 billion by 2035. Joint purchases of ticketing and remote access raise spend per IT desk.
Why does North America lead help desk sales by region?
North America is expected to lead regional sales with about 41.5% share, ahead of Europe at an estimated 25%.
Table 7: Regional Share for the Help Desk Software Market (percentage share), 2026
| Region | Estimated Share (2026) |
|---|---|
| North America | 41.5% |
| Europe | 25% |
| Asia Pacific | 23.2% |
| Latin America | 5.8% |
| Middle East and Africa | 4.5% |
| Total | 100.0% |
North America adopted hosted service tools early and employs a large service workforce, so the region leads help desk sales. In FMI estimates, North America holds about 41.5% of sales, ahead of Europe at 25% and Asia Pacific at 23.2%. Latin America and the Middle East and Africa hold smaller shares but are growing from a low base. European adoption of hosted business tools is broad, especially in the Nordic countries. Finland had the highest share of enterprises paying for cloud services in 2025, at 79.2%. High cloud use in northern Europe points to fast help desk migration there, though North America keeps the lead.
- Demand for help desks in North America comes from US and Canadian customer support centres, IT departments and outsourcing providers.
- AI use across European firms rose to 20% in 2025 from 13.5% a year earlier. Faster AI use in Europe is expected to narrow the gap with North America over time.
What are the drivers, restraints, and opportunities in the help desk software market?
Agent shortages and AI automation push firms toward modern help desks. Price pressure and switching costs slow some purchases, and IT service management opens a fast-growing line.
- Driver: Service teams face hiring limits and rising contact volumes, so companies turn to software that routes, answers and closes requests automatically.
- Restraint: Many small vendors compete on price, and data migration makes switching platforms slow, which delays upgrades.
- Opportunity: IT and employee service desks are moving to cloud platforms, which opens larger contracts beyond customer support.
Agent Shortages and AI Automation Drive Adoption
Tight labour and maturing AI push companies toward modern help desks. BLS projects about 289,500 openings for customer service representatives each year, despite a falling total. High turnover brings constant hiring and training, so companies invest in tools that cut handling time. AI agents now absorb a large share of routine work. Salesforce reported Agentforce and Data 360 ARR of nearly USD 3.9 billion, up over 210%. Rapid AI growth at a market leader shows that automated service is moving into mainstream budgets.
Price Pressure and Switching Costs Restrain Upgrades
Crowded competition and costly migrations slow growth of the help desk software market. Freshworks reported a net dollar retention rate of 104% in the second quarter of 2026, down from 106% in the first quarter. Slower expansion within existing accounts shows customers buying seats carefully and negotiating on price. Switching costs also keep many customers on older tools for longer than planned. Customers often hold years of tickets and knowledge articles, so moving platforms requires data migration and retraining. Vendors offering migration support and AI that works on existing data will win more replacement deals.
IT Service Management Opens a Faster-growing Line
Sales of IT service desks are growing faster than customer support tools. ServiceNow remaining performance obligations, the contracted sales still to be recognised, reached USD 29.0 billion, up 21%. A growing contracted backlog at the leading IT service platform shows long commitments to enterprise service workflows. License control is part of the same workflow, and the software license management market is projected to grow at a 14.6% CAGR through 2035. Vendors that combine IT tickets, assets and licences in one platform will gain share through 2036.
Which country CAGRs are profiled in the help desk software market?
Table 8: Country CAGR Comparison for the Help Desk Software Market (CAGR percentage), 2026 to 2036
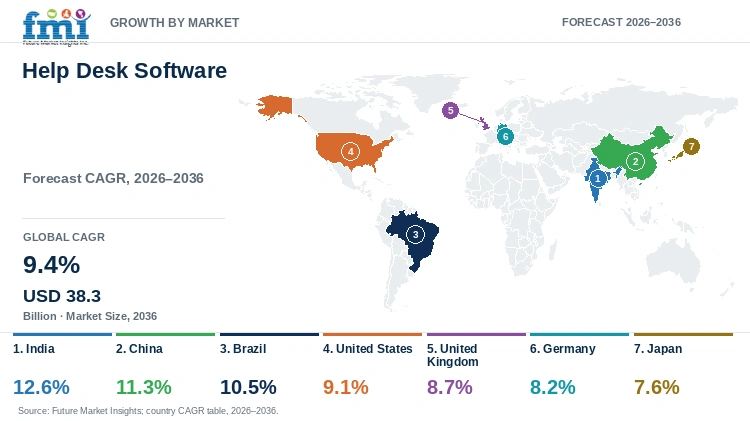
| Country | CAGR |
|---|---|
| India | 12.6% |
| China | 11.3% |
| Brazil | 10.5% |
| United States | 9.1% |
| United Kingdom | 8.7% |
| Germany | 8.2% |
| Japan | 7.6% |
How do country-level CAGRs compare in the help desk software market?
FMI projects India at 12.6%, 3.2 points above the 9.4% global CAGR, as service exporters and digital firms build support operations. China, at 11.3%, and Brazil, at 10.5%, grow faster, since large online shops and marketplaces need big support teams. The United States at 9.1% runs just below the global rate, since adoption is already high. Mature service sectors upgrade slowly, so the United Kingdom (8.7%), Germany (8.2%) and Japan (7.6%) end the ranking.
- Demand for help desk seats and AI tools in India rises with each new outsourced support contract for global clients.
- Use of routing and automation grows in China, as online commerce drives large customer service teams.
- Adoption of ticketing tools in Brazil is rising with digital banking and retail growth, as companies formalise customer support.
- Buyer preference for AI agents on existing platforms is rising in the United States, given high cloud adoption.
- Key trends in the United Kingdom point to contact centre modernisation by public services and banks, giving vendors steady replacement orders.
- Popularity of web-based tools lasts longer in Germany, as data protection concerns slow cloud moves.
- Japan favours long-standing systems, so adoption of new platforms comes gradually.
Full report country CAGRs cover: a profiled spread led by India at 12.6% and ending with Japan at 7.6%, with other standard countries shown in regional tables.
Country-wise Analysis
India Help Desk Software Market Outlook (2026 to 2036)
India hosts large outsourced support operations for global clients, and domestic digital firms are building in-house service teams. Each new support contract adds ticketing seats, knowledge tools and AI assistants. FMI gives India a 12.6% CAGR to 2036, ahead of every other profiled country.
Key takeaway: Outsourcing centres and digital service firms in India keep adding support teams, which makes India the fastest-growing buyer of help desk tools.
China Help Desk Software Market Outlook (2026 to 2036)
Large e-commerce and platform businesses in China handle heavy customer service volumes, which drives help desk purchases. Local vendors supply much of the demand, and AI chat handles a growing share of contacts. China is projected to grow at an 11.3% CAGR as AI chat spreads across large service teams.
Key takeaway: Chinese e-commerce and platform companies buy automation tools to handle very high contact volumes, and most of this business goes to local vendors.
Brazil Help Desk Software Market Outlook (2026 to 2036)
Brazil has fast-growing digital banking and online retail sectors that need structured customer support. Messaging-based service is common, so help desks with chat integration sell well. With banks and retailers serving customers through chat, Brazil is projected to grow at a 10.5% CAGR.
Key takeaway: Banks and retailers in Brazil serve customers mainly through messaging apps, so these firms prefer help desks with built-in chat.
United States Help Desk Software Market Outlook (2026 to 2036)
The United States has the largest service workforce and high cloud adoption. BLS counts 2,666,000 customer service representative jobs in 2025, with a projected 5% decline by 2035. A shrinking agent base pushes companies to automate more contacts with AI. The United States is projected to grow at 9.1% a year, mainly through AI upgrades on existing platforms.
Key takeaway: US companies will put more money into AI agents that resolve requests automatically than into extra agent seats, as the service workforce shrinks.
United Kingdom Help Desk Software Market Outlook (2026 to 2036)
British banks, utilities and public services run large contact centres that are moving to cloud platforms. Replacement of older contact centre systems provides steady demand for cloud help desks. The United Kingdom is projected to grow at an 8.7% CAGR as contact centres are renewed.
Key takeaway: British banks, utilities and public services are replacing older contact centre systems, which gives cloud help desk vendors a steady stream of orders.
Germany Help Desk Software Market Outlook (2026 to 2036)
German firms move carefully to hosted tools, given data protection concerns. Vendors with EU data centres and strong privacy controls win most new deals. Germany is projected to grow at an 8.2% CAGR through 2036, as buyers move cautiously over privacy.
Key takeaway: German buyers usually choose help desk vendors that keep data in EU data centres, since data protection is the first concern.
Japan Help Desk Software Market Outlook (2026 to 2036)
Japanese companies keep long-standing service systems and adopt new tools only gradually. Labour shortages are raising interest in automation, though change remains slow. FMI places Japan last among profiled countries, at a 7.6% CAGR.
Key takeaway: Japanese companies want automation to cope with labour shortages, but existing service systems are replaced slowly, which keeps growth low.
Who are the notable companies in the help desk software market?
Customer service platforms, IT service management vendors and specialist help desk providers make up the profiled field. The companies are Zendesk, Freshworks, Salesforce, Zoho Corporation, Intercom, BMC Software, Jira Service Desk, Hiver, Sparkcentral, Smart Tribune, Watermelon and Column Technologies.
The leading players in the help desk software market range from broad CRM and service platforms to specialists focused on email, chat or IT tickets. The profiled companies divide into three groups by role, since buyers in customer support and IT choose differently. Platform vendors are buying AI capabilities instead of building every feature in-house. Zendesk announced the planned acquisition of Forethought on March 11, 2026, expecting the deal to speed the product roadmap by over a year. Buying AI capability lets large help desks match newer AI-first rivals, which raises pressure on small specialists.
- Customer service platforms: Zendesk, Salesforce, Freshworks, Zoho Corporation and Intercom, which serve support teams of every size.
- IT service management vendors: BMC Software and Jira Service Desk.
- Specialist help desk providers: Hiver, Sparkcentral, Smart Tribune, Watermelon and Column Technologies, focused on email, social and chatbot support.
Competitive Benchmarking: Help Desk Software Market
Table 9: Competitive Benchmarking for the Help Desk Software Market (qualitative ratings), 2026
| Company | Customer Support | IT Service Management | AI Agents | Recent Activity |
|---|---|---|---|---|
| Zendesk | High | Medium | High | High |
| Salesforce | High | Low | High | High |
| Freshworks | High | High | High | High |
| Zoho Corporation | Medium | Medium | Medium | Low |
| Intercom | High | Low | High | Low |
| BMC Software | Low | High | Medium | Low |
| Jira Service Desk | Medium | High | Medium | High |
Ratings compare the companies on customer support, IT service management, AI agents and recent activity.
Key Developments in the Help Desk Software Market
- Salesforce reported Agentforce ARR above USD 1.5 billion on August 26, 2026, up over 240%, confirming fast demand for AI service agents.
- In August 2026, Atlassian reported fiscal 2026 revenue of USD 6,572 million, up 26%, with Jira Service Management sold inside the AI-powered Service Collection.
- Freshworks reported second-quarter 2026 revenue of USD 237.4 million on August 4, 2026, up 16%, and said EX ARR grew 24%.
- ServiceNow reported 658 customers above USD 5 million in annual contract value in July 2026, a sign of growing scale in enterprise service.
- On March 11, 2026, Zendesk announced the planned acquisition of Forethought to add self-improving AI agents, strengthening automated resolution.
- Eurostat data released in December 2025 showed 20% of EU enterprises using AI in 2025, widening the base of buyers ready for AI help desks.
Key Players in the Help Desk Software Market
Customer Service Platforms
- Zendesk
- Salesforce
- Freshworks
- Zoho Corporation
- Intercom
IT Service Management Vendors
- BMC Software
- Jira Service Desk
Specialist Help Desk Providers
- Hiver
- Sparkcentral
- Smart Tribune
- Watermelon
- Column Technologies
Help Desk Software Market - Report Scope
Table 10: Report Scope for the Help Desk Software Market (coverage fields and definitions), 2026 to 2036
| Coverage field | Report scope |
|---|---|
| Market breakdown | Type; application; region |
| Quantitative units | USD billion |
| Market definition | Software that receives, routes, monitors and resolves customer and employee service requests, including ticketing, knowledge bases, self-service portals, chat and AI agents, delivered as cloud-based or web-based tools. |
| Regions covered | North America; Latin America; Western Europe; Eastern Europe; East Asia; South Asia and Pacific; Middle East and Africa |
| Countries covered | India; China; Brazil; United States; United Kingdom; Germany; Japan |
| Key companies profiled | Zendesk, Freshworks, Salesforce, Zoho Corporation, Intercom, BMC Software, Jira Service Desk, Hiver, Sparkcentral, Smart Tribune, Watermelon, Column Technologies |
| Forecast period | 2026 to 2036 |
Help Desk Software Market - Research Methodology
Table 11: Research Methodology for the Help Desk Software Market (research methods and approach), 2026 edition
| Method | Approach |
|---|---|
| Data Sources | Company results, industry associations, government statistics and trade publications. |
| Desk Research | Desk research covers customer support software, IT service management, AI agents and service labour trends. |
| Market Sizing | Market size is built from software sales by type, application and region. |
| Data Validation | Figures are cross-checked across company, industry and government sources. |
Help Desk Software Market by Segments
Help Desk Software Market segmented by Type:
- Cloud-based
- Web-based
Help Desk Software Market segmented by Application:
- Large Enterprises
- Small and Medium Enterprises
Help Desk Software Market by Region
- North America
- United States
- Canada
- Latin America
- Brazil
- Mexico
- Argentina
- Chile
- Western Europe
- Germany
- France
- United Kingdom
- Italy
- Spain
- Benelux
- Nordics
- Eastern Europe
- Poland
- Czech Republic
- Romania
- Hungary
- East Asia
- China
- Japan
- South Korea
- South Asia and Pacific
- India
- ASEAN
- Australia and New Zealand
- Middle East and Africa
- GCC Countries
- South Africa
- Türkiye
- Israel
Research Sources and Bibliography
- [1] The Brussels Times. (2026, February 3). EU cloud computing use surges, adoption triples in a decade. https://www.brusselstimes.com/eu-affairs/1951347/eu-cloud-computing-use-surges-adoption-triples-in-a-decade
- [2] Zendesk. (2026, March 11). Zendesk Advances Resolution Platform with Self-improving AI Agents from Proposed Forethought Acquisition. https://www.zendesk.com/newsroom/press-releases/zendesk-advances-resolution-platform-with-self-improving-ai-agents-from-proposed-forethought-acquisition
- [3] Freshworks Inc. (2026, August 4). Freshworks Reports Record Second Quarter 2026 Results. https://www.sec.gov/Archives/edgar/data/0001544522/000154452226000135/q226quarterlyearningsrelea.htm
- [4] U.S. Bureau of Labor Statistics. (2026, August 27). Customer Service Representatives, Occupational Outlook Handbook. https://www.bls.gov/ooh/office-and-administrative-support/customer-service-representatives.htm
- [5] Salesforce, Inc. (2026, August 26). Salesforce Delivers Record Second Quarter Fiscal 2027 Results. https://investor.salesforce.com/news/news-details/2026/Salesforce-Delivers-Record-Second-Quarter-Fiscal-2027-Results/default.aspx
- [6] Atlassian Corporation. (2026, August 6). Atlassian Announces Fourth Quarter and Fiscal Year 2026 Results. https://www.sec.gov/Archives/edgar/data/0001650372/000165037226000031/ex991q4fy26.htm
- [7] Sofia Globe. (2025, December 12). Eurostat: Close to 9% of businesses in Bulgaria use AI. https://sofiaglobe.com/2025/12/12/eurostat-close-to-9-of-businesses-in-bulgaria-use-ai/
- [8] ServiceNow, Inc. (2026, July 22). ServiceNow Reports Second Quarter 2026 Financial Results. https://www.sec.gov/Archives/edgar/data/0001373715/000137371526000072/erq2fy26.htm
This bibliography is provided for reader reference. The full report contains the complete reference list and detailed citations.
This Report Answers
- How big is the help desk software market during 2026?
- What market size is projected by 2036?
- Which type holds notable share?
- Which application holds notable share?
- Which countries have notable growth?
- Which companies are notable in the market?
Table of Content
- Key Takeaways
- Market Size and CAGR
- Top Growth Driver
- Fastest Growing Segment
- Leading Region
- Key Companies
- Emerging Opportunities
- Executive Summary
- Global Market Outlook
- Demand-side Trends
- Supply-side Trends
- Technology Roadmap Analysis
- Analysis and Recommendations
- Analyst Perspective (What is happening? Why now? What should investors know?)
- Key Questions Answered
- How large is the market?
- What is the CAGR?
- What are key trends?
- Which region dominates?
- Who are the leaders?
Read More...
- Market Overview
- Market Coverage / Taxonomy
- Market Definition / Scope / Limitations
- Research Methodology
- Chapter Orientation
- Analytical Lens and Working Hypotheses
- Market Structure, Signals, and Trend Drivers
- Benchmarking and Cross-market Comparability
- Market Sizing, Forecasting, and Opportunity Mapping
- Research Design and Evidence Framework
- Desk Research Programme (Secondary Evidence)
- Expert Input and Fieldwork (Primary Evidence)
- Tooling, Models, and Reference Databases
- Data Engineering and Model Build
- Quality Assurance and Audit Trail
- Market Background
- Market Dynamics (Drivers, Restraints, Opportunity, Trends)
- Scenario Forecast (Optimistic, Likely, Conservative)
- Impact Analysis
- AI Impact
- Sustainability Impact
- Regulatory Impact
- Technology Impact
- Consumer / Buyer Analysis
- Purchase Drivers
- Adoption Barriers
- Buyer Journey
- Opportunity Map Analysis
- Product Life Cycle Analysis
- Supply Chain Analysis
- Investment Feasibility Matrix
- Value Chain Analysis
- PESTLE and Porter's Analysis
- Regulatory Landscape
- Regional Parent Market Outlook
- Production and Consumption Statistics
- Import and Export Statistics
- Global Market Analysis and Forecast, 2021 to 2036
- Historical Market Size Value (USD Billion) Analysis, 2021 to 2025
- Current and Future Market Size Value (USD Billion) Projections, 2026 to 2036
- Y-o-Y Growth Trend Analysis
- Absolute $ Opportunity Analysis
- Global Market Pricing Analysis, 2021 to 2036
- Global Market Analysis and Forecast, By Type, 2021 to 2036
- Introduction / Key Findings
- Historical Market Size Value (USD Billion) Analysis By Type, 2021 to 2025
- Current and Future Market Size Value (USD Billion) Analysis and Forecast By Type, 2026 to 2036
- Cloud-based
- Web-based
- Y-o-Y Growth Trend Analysis By Type, 2021 to 2025
- Absolute $ Opportunity Analysis By Type, 2026 to 2036
- Global Market Analysis and Forecast, By Application, 2021 to 2036
- Introduction / Key Findings
- Historical Market Size Value (USD Billion) Analysis By Application, 2021 to 2025
- Current and Future Market Size Value (USD Billion) Analysis and Forecast By Application, 2026 to 2036
- Large Enterprises
- Small and Medium Enterprises
- Y-o-Y Growth Trend Analysis By Application, 2021 to 2025
- Absolute $ Opportunity Analysis By Application, 2026 to 2036
- Global Market Analysis and Forecast, By Region, 2021 to 2036
- Introduction
- Historical Market Size Value (USD Billion) Analysis By Region, 2021 to 2025
- Current Market Size Value (USD Billion) Analysis and Forecast By Region, 2026 to 2036
- North America
- Latin America
- Western Europe
- Eastern Europe
- East Asia
- South Asia and Pacific
- Middle East and Africa
- Market Attractiveness Analysis By Region
- North America Market Analysis and Forecast, By Country, 2021 to 2036
- Historical Market Size Value (USD Billion) Trend Analysis By Market Taxonomy, 2021 to 2025
- Market Size Value (USD Billion) Forecast By Market Taxonomy, 2026 to 2036
- By Country
- United States
- Canada
- By Type
- By Application
- By Country
- Market Attractiveness Analysis
- By Country
- By Type
- By Application
- Key Takeaways
- Latin America Market Analysis and Forecast, By Country
- Historical Market Size Value (USD Billion) Trend Analysis By Market Taxonomy, 2021 to 2025
- Market Size Value (USD Billion) Forecast By Market Taxonomy, 2026 to 2036
- By Country
- Brazil
- Mexico
- Argentina
- Chile
- By Type
- By Application
- By Country
- Market Attractiveness Analysis
- By Country
- By Type
- By Application
- Key Takeaways
- Western Europe Market Analysis and Forecast, By Country
- Historical Market Size Value (USD Billion) Trend Analysis By Market Taxonomy, 2021 to 2025
- Market Size Value (USD Billion) Forecast By Market Taxonomy, 2026 to 2036
- By Country
- Germany
- France
- United Kingdom
- Italy
- Spain
- Benelux
- Nordics
- By Type
- By Application
- By Country
- Market Attractiveness Analysis
- By Country
- By Type
- By Application
- Key Takeaways
- Eastern Europe Market Analysis and Forecast, By Country
- Historical Market Size Value (USD Billion) Trend Analysis By Market Taxonomy, 2021 to 2025
- Market Size Value (USD Billion) Forecast By Market Taxonomy, 2026 to 2036
- By Country
- Poland
- Czech Republic
- Romania
- Hungary
- By Type
- By Application
- By Country
- Market Attractiveness Analysis
- By Country
- By Type
- By Application
- Key Takeaways
- East Asia Market Analysis and Forecast, By Country
- Historical Market Size Value (USD Billion) Trend Analysis By Market Taxonomy, 2021 to 2025
- Market Size Value (USD Billion) Forecast By Market Taxonomy, 2026 to 2036
- By Country
- China
- Japan
- South Korea
- By Type
- By Application
- By Country
- Market Attractiveness Analysis
- By Country
- By Type
- By Application
- Key Takeaways
- South Asia and Pacific Market Analysis and Forecast, By Country
- Historical Market Size Value (USD Billion) Trend Analysis By Market Taxonomy, 2021 to 2025
- Market Size Value (USD Billion) Forecast By Market Taxonomy, 2026 to 2036
- By Country
- India
- ASEAN
- Australia and New Zealand
- By Type
- By Application
- By Country
- Market Attractiveness Analysis
- By Country
- By Type
- By Application
- Key Takeaways
- Middle East and Africa Market Analysis and Forecast, By Country
- Historical Market Size Value (USD Billion) Trend Analysis By Market Taxonomy, 2021 to 2025
- Market Size Value (USD Billion) Forecast By Market Taxonomy, 2026 to 2036
- By Country
- GCC Countries
- South Africa
- Türkiye
- Israel
- By Type
- By Application
- By Country
- Market Attractiveness Analysis
- By Country
- By Type
- By Application
- Key Takeaways
- Key Countries Market Analysis
- United States
- Pricing Analysis
- Market Share Analysis, 2025
- By Type
- By Application
- Canada
- Pricing Analysis
- Market Share Analysis, 2025
- By Type
- By Application
- Mexico
- Pricing Analysis
- Market Share Analysis, 2025
- By Type
- By Application
- Brazil
- Pricing Analysis
- Market Share Analysis, 2025
- By Type
- By Application
- Chile
- Pricing Analysis
- Market Share Analysis, 2025
- By Type
- By Application
- Germany
- Pricing Analysis
- Market Share Analysis, 2025
- By Type
- By Application
- United Kingdom
- Pricing Analysis
- Market Share Analysis, 2025
- By Type
- By Application
- Italy
- Pricing Analysis
- Market Share Analysis, 2025
- By Type
- By Application
- Spain
- Pricing Analysis
- Market Share Analysis, 2025
- By Type
- By Application
- France
- Pricing Analysis
- Market Share Analysis, 2025
- By Type
- By Application
- India
- Pricing Analysis
- Market Share Analysis, 2025
- By Type
- By Application
- ASEAN
- Pricing Analysis
- Market Share Analysis, 2025
- By Type
- By Application
- Australia and New Zealand
- Pricing Analysis
- Market Share Analysis, 2025
- By Type
- By Application
- China
- Pricing Analysis
- Market Share Analysis, 2025
- By Type
- By Application
- Japan
- Pricing Analysis
- Market Share Analysis, 2025
- By Type
- By Application
- South Korea
- Pricing Analysis
- Market Share Analysis, 2025
- By Type
- By Application
- Poland
- Pricing Analysis
- Market Share Analysis, 2025
- By Type
- By Application
- Hungary
- Pricing Analysis
- Market Share Analysis, 2025
- By Type
- By Application
- Türkiye
- Pricing Analysis
- Market Share Analysis, 2025
- By Type
- By Application
- South Africa
- Pricing Analysis
- Market Share Analysis, 2025
- By Type
- By Application
- United States
- Market Structure Analysis
- Competition Dashboard
- Competition Benchmarking
- Market Share Analysis of Top Players
- By Regional
- By Type
- By Application
- Emerging Startups
- Innovation Benchmarking
- Competition Analysis
- Competition Deep Dive
- Zendesk
- Overview
- Product Portfolio
- Profitability by Market Segments
- Sales Footprint
- Strategy Overview
- Marketing Strategy
- Product Strategy
- Channel Strategy
- Salesforce
- Freshworks
- Zoho Corporation
- Intercom
- BMC Software
- Jira Service Desk
- Hiver
- Sparkcentral
- Smart Tribune
- Watermelon
- Column Technologies
- Zendesk
- Case Studies
- Success Stories
- Recent Developments
- Competition Deep Dive
- Assumptions & Acronyms Used
List of Tables
- Table 1: Global Market Value (USD Billion) Forecast by Region, 2021 to 2036
- Table 2: Global Market Value (USD Billion) Forecast by Type, 2021 to 2036
- Table 3: Global Market Value (USD Billion) Forecast by Application, 2021 to 2036
- Table 4: North America Market Value (USD Billion) Forecast by Country, 2021 to 2036
- Table 5: North America Market Value (USD Billion) Forecast by Type, 2021 to 2036
- Table 6: North America Market Value (USD Billion) Forecast by Application, 2021 to 2036
- Table 7: Latin America Market Value (USD Billion) Forecast by Country, 2021 to 2036
- Table 8: Latin America Market Value (USD Billion) Forecast by Type, 2021 to 2036
- Table 9: Latin America Market Value (USD Billion) Forecast by Application, 2021 to 2036
- Table 10: Western Europe Market Value (USD Billion) Forecast by Country, 2021 to 2036
- Table 11: Western Europe Market Value (USD Billion) Forecast by Type, 2021 to 2036
- Table 12: Western Europe Market Value (USD Billion) Forecast by Application, 2021 to 2036
- Table 13: Eastern Europe Market Value (USD Billion) Forecast by Country, 2021 to 2036
- Table 14: Eastern Europe Market Value (USD Billion) Forecast by Type, 2021 to 2036
- Table 15: Eastern Europe Market Value (USD Billion) Forecast by Application, 2021 to 2036
- Table 16: East Asia Market Value (USD Billion) Forecast by Country, 2021 to 2036
- Table 17: East Asia Market Value (USD Billion) Forecast by Type, 2021 to 2036
- Table 18: East Asia Market Value (USD Billion) Forecast by Application, 2021 to 2036
- Table 19: South Asia and Pacific Market Value (USD Billion) Forecast by Country, 2021 to 2036
- Table 20: South Asia and Pacific Market Value (USD Billion) Forecast by Type, 2021 to 2036
- Table 21: South Asia and Pacific Market Value (USD Billion) Forecast by Application, 2021 to 2036
- Table 22: Middle East and Africa Market Value (USD Billion) Forecast by Country, 2021 to 2036
- Table 23: Middle East and Africa Market Value (USD Billion) Forecast by Type, 2021 to 2036
- Table 24: Middle East and Africa Market Value (USD Billion) Forecast by Application, 2021 to 2036
List of Figures
- Figure 1: Global Market Pricing Analysis
- Figure 2: Global Market Value (USD Billion) Forecast 2021-2036
- Figure 3: Global Market Value Share and BPS Analysis by Type, 2026 and 2036
- Figure 4: Global Market Y-o-Y Growth Comparison by Type, 2026-2036
- Figure 5: Global Market Attractiveness Analysis by Type
- Figure 6: Global Market Value Share and BPS Analysis by Application, 2026 and 2036
- Figure 7: Global Market Y-o-Y Growth Comparison by Application, 2026-2036
- Figure 8: Global Market Attractiveness Analysis by Application
- Figure 9: Global Market Value (USD Billion) Share and BPS Analysis by Region, 2026 and 2036
- Figure 10: Global Market Y-o-Y Growth Comparison by Region, 2026-2036
- Figure 11: Global Market Attractiveness Analysis by Region
- Figure 12: North America Market Incremental Dollar Opportunity, 2026-2036
- Figure 13: Latin America Market Incremental Dollar Opportunity, 2026-2036
- Figure 14: Western Europe Market Incremental Dollar Opportunity, 2026-2036
- Figure 15: Eastern Europe Market Incremental Dollar Opportunity, 2026-2036
- Figure 16: East Asia Market Incremental Dollar Opportunity, 2026-2036
- Figure 17: South Asia and Pacific Market Incremental Dollar Opportunity, 2026-2036
- Figure 18: Middle East and Africa Market Incremental Dollar Opportunity, 2026-2036
- Figure 19: North America Market Value Share and BPS Analysis by Country, 2026 and 2036
- Figure 20: North America Market Value Share and BPS Analysis by Type, 2026 and 2036
- Figure 21: North America Market Y-o-Y Growth Comparison by Type, 2026-2036
- Figure 22: North America Market Attractiveness Analysis by Type
- Figure 23: North America Market Value Share and BPS Analysis by Application, 2026 and 2036
- Figure 24: North America Market Y-o-Y Growth Comparison by Application, 2026-2036
- Figure 25: North America Market Attractiveness Analysis by Application
- Figure 26: Latin America Market Value Share and BPS Analysis by Country, 2026 and 2036
- Figure 27: Latin America Market Value Share and BPS Analysis by Type, 2026 and 2036
- Figure 28: Latin America Market Y-o-Y Growth Comparison by Type, 2026-2036
- Figure 29: Latin America Market Attractiveness Analysis by Type
- Figure 30: Latin America Market Value Share and BPS Analysis by Application, 2026 and 2036
- Figure 31: Latin America Market Y-o-Y Growth Comparison by Application, 2026-2036
- Figure 32: Latin America Market Attractiveness Analysis by Application
- Figure 33: Western Europe Market Value Share and BPS Analysis by Country, 2026 and 2036
- Figure 34: Western Europe Market Value Share and BPS Analysis by Type, 2026 and 2036
- Figure 35: Western Europe Market Y-o-Y Growth Comparison by Type, 2026-2036
- Figure 36: Western Europe Market Attractiveness Analysis by Type
- Figure 37: Western Europe Market Value Share and BPS Analysis by Application, 2026 and 2036
- Figure 38: Western Europe Market Y-o-Y Growth Comparison by Application, 2026-2036
- Figure 39: Western Europe Market Attractiveness Analysis by Application
- Figure 40: Eastern Europe Market Value Share and BPS Analysis by Country, 2026 and 2036
- Figure 41: Eastern Europe Market Value Share and BPS Analysis by Type, 2026 and 2036
- Figure 42: Eastern Europe Market Y-o-Y Growth Comparison by Type, 2026-2036
- Figure 43: Eastern Europe Market Attractiveness Analysis by Type
- Figure 44: Eastern Europe Market Value Share and BPS Analysis by Application, 2026 and 2036
- Figure 45: Eastern Europe Market Y-o-Y Growth Comparison by Application, 2026-2036
- Figure 46: Eastern Europe Market Attractiveness Analysis by Application
- Figure 47: East Asia Market Value Share and BPS Analysis by Country, 2026 and 2036
- Figure 48: East Asia Market Value Share and BPS Analysis by Type, 2026 and 2036
- Figure 49: East Asia Market Y-o-Y Growth Comparison by Type, 2026-2036
- Figure 50: East Asia Market Attractiveness Analysis by Type
- Figure 51: East Asia Market Value Share and BPS Analysis by Application, 2026 and 2036
- Figure 52: East Asia Market Y-o-Y Growth Comparison by Application, 2026-2036
- Figure 53: East Asia Market Attractiveness Analysis by Application
- Figure 54: South Asia and Pacific Market Value Share and BPS Analysis by Country, 2026 and 2036
- Figure 55: South Asia and Pacific Market Value Share and BPS Analysis by Type, 2026 and 2036
- Figure 56: South Asia and Pacific Market Y-o-Y Growth Comparison by Type, 2026-2036
- Figure 57: South Asia and Pacific Market Attractiveness Analysis by Type
- Figure 58: South Asia and Pacific Market Value Share and BPS Analysis by Application, 2026 and 2036
- Figure 59: South Asia and Pacific Market Y-o-Y Growth Comparison by Application, 2026-2036
- Figure 60: South Asia and Pacific Market Attractiveness Analysis by Application
- Figure 61: Middle East and Africa Market Value Share and BPS Analysis by Country, 2026 and 2036
- Figure 62: Middle East and Africa Market Value Share and BPS Analysis by Type, 2026 and 2036
- Figure 63: Middle East and Africa Market Y-o-Y Growth Comparison by Type, 2026-2036
- Figure 64: Middle East and Africa Market Attractiveness Analysis by Type
- Figure 65: Middle East and Africa Market Value Share and BPS Analysis by Application, 2026 and 2036
- Figure 66: Middle East and Africa Market Y-o-Y Growth Comparison by Application, 2026-2036
- Figure 67: Middle East and Africa Market Attractiveness Analysis by Application
- Figure 68: Global Market - Tier Structure Analysis
- Figure 69: Global Market - Company Share Analysis
Frequently Asked Questions
How large is the help desk software market expected in 2026?
As service teams automate routine requests, FMI expects the help desk software market to reach USD 15.6 billion in 2026, from USD 14.3 billion in 2025.
What CAGR is projected for the help desk software market through 2036?
Agent shortages keep pushing work onto software, so a 9.4% CAGR is projected from 2026 to 2036, reaching USD 38.3 billion.
Which type holds a notable market share in 2026?
Cloud-based software is expected to hold 61.3% of type sales in 2026, as hosted tools deliver AI features without server upkeep.
Which application holds a notable market share in 2026?
Large enterprises are likely to account for 58.7% of application sales in 2026, given that multi-team desks need routing and analytics at scale.
Which country has a notable expansion outlook through 2036?
India leads the FMI country outlook at a 12.6% CAGR, as outsourced support centres and digital firms add service teams.
Who are the key companies in the help desk software market?
Zendesk, Salesforce, Freshworks, Zoho Corporation and Intercom lead customer service platforms, and BMC Software and Jira Service Desk lead IT service management, since each owns a large installed base.
Preview the report firsthand - request a free sample
Get SampleGet the brochure for pricing and purchase details.
Get PDF
