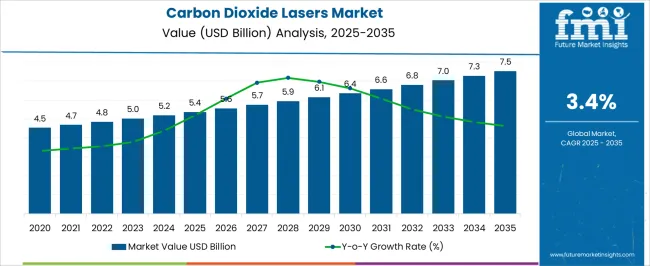
As of 2023, the global carbon dioxide lasers market has successfully attained a significant valuation of USD 5.0 billion, reflecting its robust growth trajectory.
Projections suggest that the market is poised to maintain a steady pace of expansion, with an estimated CAGR of 3.6% from 2023 to 2033. Such consistent growth is expected to propel the market to remarkable heights, culminating in an impressive value of USD 7.1 billion by the end of 2033.
The carbon dioxide lasers market is experiencing a notable upswing, fueled primarily by the expanding laser surgery industry.
As advancements in medical technology continue to evolve, CO2 lasers have become a preferred choice for surgical procedures, contributing to the market's remarkable growth. Moreover, the versatility of CO2 lasers has opened up new opportunities for market expansion in various manufacturing industries.
These lasers find extensive application in manufacturing processes, offering precision cutting and engraving capabilities, thereby driving their adoption across different sectors.
Attributes | Details |
---|---|
Carbon Dioxide Lasers Market Size Value in 2023 | USD 5.0 billion |
Carbon Dioxide Lasers Market Forecast Value in 2033 | USD 7.1 billion |
Carbon Dioxide Lasers Market Growth Rate (2023 to 2033) | 3.6% |
Demand for carbon dioxide lasers grew at 4.7% CAGR between 2018 and 2022, according to Future Market Insights (FMI).
The period from 2018 to 2022 witnessed steady growth in the carbon dioxide lasers industry, driven by increasing applications in diverse industries such as medicine, manufacturing, and cosmetics. However, the forecast for 2023 to 2033 indicates a significant surge in market demand, surpassing the earlier outlook.
This upswing can be attributed to further advancements in laser technology, the continuous expansion of the laser surgery industry, and a rising trend of integrating CO2 lasers into various cutting-edge manufacturing processes.
The market is expected to benefit from the growing demand for cosmetic surgeries and the widespread adoption of CO2 lasers in addressing skincare concerns.
Overall, the future looks highly promising for the market, at a growth rate of 3.6% from 2023 to 2033, reaching USD 7.1 billion by 2033.
As per the FMI analysis, the market for carbon dioxide lasers in China is likely to be at the forefront of the global market at 3.5% CAGR from 2023 to 2033, reaching USD 1.5 billion by the end of the forecast period.
The industrial laser systems market in China is thriving primarily due to the concentration of numerous industrial manufacturing plants in the region.
These plants are affiliated with various industries, including aerospace, defense, automotive, consumer electronics, and medical devices, contributing significantly to the market's growth.
It is projected to experience the most promising market growth in the upcoming years, driven by the increasing number of automotive and consumer electronic device manufacturers expanding their operations and manufacturing facilities across different parts of the country.
The government's focus on research and development initiatives in the robotics industry is playing a pivotal role in propelling the growth of the carbon dioxide lasers industry in China.
The United States leads in technological advancements and serves as a prominent manufacturer and consumer of CO2 lasers.
The country’s market is projected to experience a significant growth rate of 3.5% during the forecast period, primarily driven by the extensive utilization of CO2 laser cutting in the healthcare and aerospace industries.
With approximately 17.5 million surgical and minimally invasive procedures performed in 2017, a 2% increase from the previous year, the demand for hygienic, precise, and residue-free tools in plastic surgery has led to the adoption of CO2 laser cutting in their manufacturing.
The resurgence of coronary heart disease has led to rising demand for various medical stents, including bioresorbable stents, bare-metal stents, and drug-eluting stents.
To meet the high precision and quality requirements, lasers are widely used in stent manufacturing due to their enhanced accuracy, superior workflow, and ability to cut complex shapes. Key players in the country involved in stent manufacturing include Abbott Laboratories, Medtronic PLC, and Boston Scientific Corporation, among others.
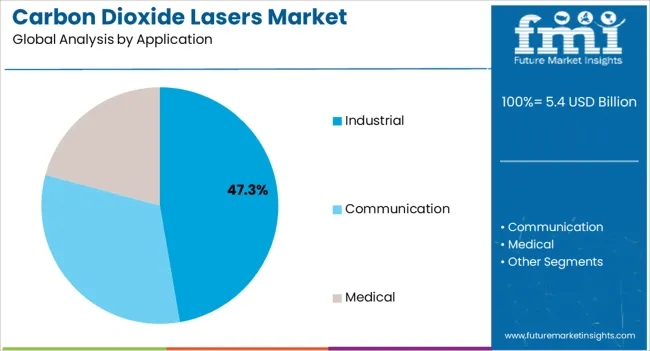
During the forecast period, the industrial segment is expected to witness significant market share growth, emerging as the major application segment globally with an anticipated CAGR f 3.4%.
This prominence can be attributed to the diverse capabilities of CO2 lasers, encompassing heat treatment, cutting, drilling, welding, and kiss-cutting across a wide range of materials.
To cater to industrial needs, CO2 lasers are designed with varying power levels and configurations. Low-power CO2 lasers (1kW) facilitate a simple melt-mode fusion process, while high-powered lasers are adept at executing high-speed keyhole welds.
Besides metal cutting, welding applications are anticipated to hold the greatest growth potential in this segment. The increasing demand for CO2 lasers for welding purposes has been a major driver of the global market's expansion.
Notably, high-power beam sources, cost-efficient have been incorporated into CO2 lasers to further enhance their performance in industrial applications.
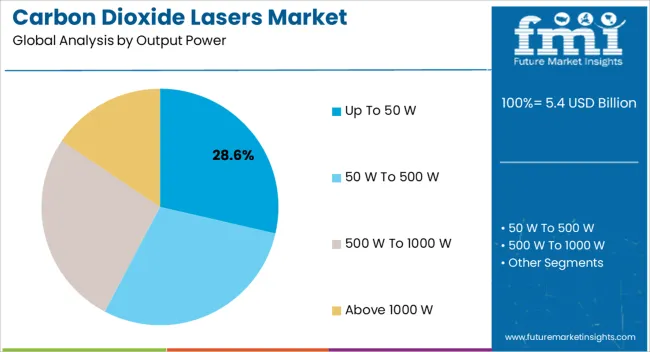
The Up to 50W segment is expected to lead the market by power output due to its versatile applications and increasing demand across various industries, in turn, fostering the sub-segment’s projected CAGR of 3.5% from 2023 to 2033.
CO2 lasers with power outputs up to 50W strike a balance between affordability and performance, making them a popular choice for a wide range of cutting, engraving, marking, and drilling tasks.
These lasers find extensive use in industries such as electronics, packaging, automotive, and medical devices, where precision and cost-effectiveness are crucial.
The advancements in laser technology have improved the efficiency and reliability of these lower-power CO2 lasers, further fueling their adoption and propelling the Up-to-50W segment to a leading position in the market.
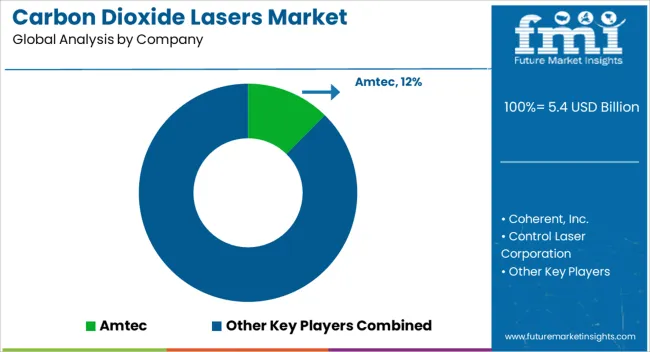
The competition in the industry is structured around key players vying for market share, innovation, and technological advancements.
Established laser manufacturers, as well as specialized companies focusing on laser systems, compete to cater to various industries' demands, including medical, manufacturing, and research.
The competition is driven by factors such as laser performance, precision, reliability, and pricing. As the market evolves, companies seek to differentiate themselves by offering customized solutions and expanding their product portfolios to meet the diverse application needs of customers.
The industry's competitive landscape is influenced by ongoing research and development efforts to enhance CO2 laser capabilities, drive efficiency, and explore novel applications, further intensifying the race for market dominance.
Key Players:
One of the Recent Developments in the Market:
Table 1: Global Market Value (US$ Million) Forecast by Region, 2018 to 2033
Table 2: Global Market Volume (Units) Forecast by Region, 2018 to 2033
Table 3: Global Market Value (US$ Million) Forecast by Output Power, 2018 to 2033
Table 4: Global Market Volume (Units) Forecast by Output Power, 2018 to 2033
Table 5: Global Market Value (US$ Million) Forecast by Application, 2018 to 2033
Table 6: Global Market Volume (Units) Forecast by Application, 2018 to 2033
Table 7: North America Market Value (US$ Million) Forecast by Country, 2018 to 2033
Table 8: North America Market Volume (Units) Forecast by Country, 2018 to 2033
Table 9: North America Market Value (US$ Million) Forecast by Output Power, 2018 to 2033
Table 10: North America Market Volume (Units) Forecast by Output Power, 2018 to 2033
Table 11: North America Market Value (US$ Million) Forecast by Application, 2018 to 2033
Table 12: North America Market Volume (Units) Forecast by Application, 2018 to 2033
Table 13: Latin America Market Value (US$ Million) Forecast by Country, 2018 to 2033
Table 14: Latin America Market Volume (Units) Forecast by Country, 2018 to 2033
Table 15: Latin America Market Value (US$ Million) Forecast by Output Power, 2018 to 2033
Table 16: Latin America Market Volume (Units) Forecast by Output Power, 2018 to 2033
Table 17: Latin America Market Value (US$ Million) Forecast by Application, 2018 to 2033
Table 18: Latin America Market Volume (Units) Forecast by Application, 2018 to 2033
Table 19: Western Europe Market Value (US$ Million) Forecast by Country, 2018 to 2033
Table 20: Western Europe Market Volume (Units) Forecast by Country, 2018 to 2033
Table 21: Western Europe Market Value (US$ Million) Forecast by Output Power, 2018 to 2033
Table 22: Western Europe Market Volume (Units) Forecast by Output Power, 2018 to 2033
Table 23: Western Europe Market Value (US$ Million) Forecast by Application, 2018 to 2033
Table 24: Western Europe Market Volume (Units) Forecast by Application, 2018 to 2033
Table 25: Eastern Europe Market Value (US$ Million) Forecast by Country, 2018 to 2033
Table 26: Eastern Europe Market Volume (Units) Forecast by Country, 2018 to 2033
Table 27: Eastern Europe Market Value (US$ Million) Forecast by Output Power, 2018 to 2033
Table 28: Eastern Europe Market Volume (Units) Forecast by Output Power, 2018 to 2033
Table 29: Eastern Europe Market Value (US$ Million) Forecast by Application, 2018 to 2033
Table 30: Eastern Europe Market Volume (Units) Forecast by Application, 2018 to 2033
Table 31: South Asia and Pacific Market Value (US$ Million) Forecast by Country, 2018 to 2033
Table 32: South Asia and Pacific Market Volume (Units) Forecast by Country, 2018 to 2033
Table 33: South Asia and Pacific Market Value (US$ Million) Forecast by Output Power, 2018 to 2033
Table 34: South Asia and Pacific Market Volume (Units) Forecast by Output Power, 2018 to 2033
Table 35: South Asia and Pacific Market Value (US$ Million) Forecast by Application, 2018 to 2033
Table 36: South Asia and Pacific Market Volume (Units) Forecast by Application, 2018 to 2033
Table 37: East Asia Market Value (US$ Million) Forecast by Country, 2018 to 2033
Table 38: East Asia Market Volume (Units) Forecast by Country, 2018 to 2033
Table 39: East Asia Market Value (US$ Million) Forecast by Output Power, 2018 to 2033
Table 40: East Asia Market Volume (Units) Forecast by Output Power, 2018 to 2033
Table 41: East Asia Market Value (US$ Million) Forecast by Application, 2018 to 2033
Table 42: East Asia Market Volume (Units) Forecast by Application, 2018 to 2033
Table 43: Middle East and Africa Market Value (US$ Million) Forecast by Country, 2018 to 2033
Table 44: Middle East and Africa Market Volume (Units) Forecast by Country, 2018 to 2033
Table 45: Middle East and Africa Market Value (US$ Million) Forecast by Output Power, 2018 to 2033
Table 46: Middle East and Africa Market Volume (Units) Forecast by Output Power, 2018 to 2033
Table 47: Middle East and Africa Market Value (US$ Million) Forecast by Application, 2018 to 2033
Table 48: Middle East and Africa Market Volume (Units) Forecast by Application, 2018 to 2033
Figure 1: Global Market Value (US$ Million) by Output Power, 2023 to 2033
Figure 2: Global Market Value (US$ Million) by Application, 2023 to 2033
Figure 3: Global Market Value (US$ Million) by Region, 2023 to 2033
Figure 4: Global Market Value (US$ Million) Analysis by Region, 2018 to 2033
Figure 5: Global Market Volume (Units) Analysis by Region, 2018 to 2033
Figure 6: Global Market Value Share (%) and BPS Analysis by Region, 2023 to 2033
Figure 7: Global Market Y-o-Y Growth (%) Projections by Region, 2023 to 2033
Figure 8: Global Market Value (US$ Million) Analysis by Output Power, 2018 to 2033
Figure 9: Global Market Volume (Units) Analysis by Output Power, 2018 to 2033
Figure 10: Global Market Value Share (%) and BPS Analysis by Output Power, 2023 to 2033
Figure 11: Global Market Y-o-Y Growth (%) Projections by Output Power, 2023 to 2033
Figure 12: Global Market Value (US$ Million) Analysis by Application, 2018 to 2033
Figure 13: Global Market Volume (Units) Analysis by Application, 2018 to 2033
Figure 14: Global Market Value Share (%) and BPS Analysis by Application, 2023 to 2033
Figure 15: Global Market Y-o-Y Growth (%) Projections by Application, 2023 to 2033
Figure 16: Global Market Attractiveness by Output Power, 2023 to 2033
Figure 17: Global Market Attractiveness by Application, 2023 to 2033
Figure 18: Global Market Attractiveness by Region, 2023 to 2033
Figure 19: North America Market Value (US$ Million) by Output Power, 2023 to 2033
Figure 20: North America Market Value (US$ Million) by Application, 2023 to 2033
Figure 21: North America Market Value (US$ Million) by Country, 2023 to 2033
Figure 22: North America Market Value (US$ Million) Analysis by Country, 2018 to 2033
Figure 23: North America Market Volume (Units) Analysis by Country, 2018 to 2033
Figure 24: North America Market Value Share (%) and BPS Analysis by Country, 2023 to 2033
Figure 25: North America Market Y-o-Y Growth (%) Projections by Country, 2023 to 2033
Figure 26: North America Market Value (US$ Million) Analysis by Output Power, 2018 to 2033
Figure 27: North America Market Volume (Units) Analysis by Output Power, 2018 to 2033
Figure 28: North America Market Value Share (%) and BPS Analysis by Output Power, 2023 to 2033
Figure 29: North America Market Y-o-Y Growth (%) Projections by Output Power, 2023 to 2033
Figure 30: North America Market Value (US$ Million) Analysis by Application, 2018 to 2033
Figure 31: North America Market Volume (Units) Analysis by Application, 2018 to 2033
Figure 32: North America Market Value Share (%) and BPS Analysis by Application, 2023 to 2033
Figure 33: North America Market Y-o-Y Growth (%) Projections by Application, 2023 to 2033
Figure 34: North America Market Attractiveness by Output Power, 2023 to 2033
Figure 35: North America Market Attractiveness by Application, 2023 to 2033
Figure 36: North America Market Attractiveness by Country, 2023 to 2033
Figure 37: Latin America Market Value (US$ Million) by Output Power, 2023 to 2033
Figure 38: Latin America Market Value (US$ Million) by Application, 2023 to 2033
Figure 39: Latin America Market Value (US$ Million) by Country, 2023 to 2033
Figure 40: Latin America Market Value (US$ Million) Analysis by Country, 2018 to 2033
Figure 41: Latin America Market Volume (Units) Analysis by Country, 2018 to 2033
Figure 42: Latin America Market Value Share (%) and BPS Analysis by Country, 2023 to 2033
Figure 43: Latin America Market Y-o-Y Growth (%) Projections by Country, 2023 to 2033
Figure 44: Latin America Market Value (US$ Million) Analysis by Output Power, 2018 to 2033
Figure 45: Latin America Market Volume (Units) Analysis by Output Power, 2018 to 2033
Figure 46: Latin America Market Value Share (%) and BPS Analysis by Output Power, 2023 to 2033
Figure 47: Latin America Market Y-o-Y Growth (%) Projections by Output Power, 2023 to 2033
Figure 48: Latin America Market Value (US$ Million) Analysis by Application, 2018 to 2033
Figure 49: Latin America Market Volume (Units) Analysis by Application, 2018 to 2033
Figure 50: Latin America Market Value Share (%) and BPS Analysis by Application, 2023 to 2033
Figure 51: Latin America Market Y-o-Y Growth (%) Projections by Application, 2023 to 2033
Figure 52: Latin America Market Attractiveness by Output Power, 2023 to 2033
Figure 53: Latin America Market Attractiveness by Application, 2023 to 2033
Figure 54: Latin America Market Attractiveness by Country, 2023 to 2033
Figure 55: Western Europe Market Value (US$ Million) by Output Power, 2023 to 2033
Figure 56: Western Europe Market Value (US$ Million) by Application, 2023 to 2033
Figure 57: Western Europe Market Value (US$ Million) by Country, 2023 to 2033
Figure 58: Western Europe Market Value (US$ Million) Analysis by Country, 2018 to 2033
Figure 59: Western Europe Market Volume (Units) Analysis by Country, 2018 to 2033
Figure 60: Western Europe Market Value Share (%) and BPS Analysis by Country, 2023 to 2033
Figure 61: Western Europe Market Y-o-Y Growth (%) Projections by Country, 2023 to 2033
Figure 62: Western Europe Market Value (US$ Million) Analysis by Output Power, 2018 to 2033
Figure 63: Western Europe Market Volume (Units) Analysis by Output Power, 2018 to 2033
Figure 64: Western Europe Market Value Share (%) and BPS Analysis by Output Power, 2023 to 2033
Figure 65: Western Europe Market Y-o-Y Growth (%) Projections by Output Power, 2023 to 2033
Figure 66: Western Europe Market Value (US$ Million) Analysis by Application, 2018 to 2033
Figure 67: Western Europe Market Volume (Units) Analysis by Application, 2018 to 2033
Figure 68: Western Europe Market Value Share (%) and BPS Analysis by Application, 2023 to 2033
Figure 69: Western Europe Market Y-o-Y Growth (%) Projections by Application, 2023 to 2033
Figure 70: Western Europe Market Attractiveness by Output Power, 2023 to 2033
Figure 71: Western Europe Market Attractiveness by Application, 2023 to 2033
Figure 72: Western Europe Market Attractiveness by Country, 2023 to 2033
Figure 73: Eastern Europe Market Value (US$ Million) by Output Power, 2023 to 2033
Figure 74: Eastern Europe Market Value (US$ Million) by Application, 2023 to 2033
Figure 75: Eastern Europe Market Value (US$ Million) by Country, 2023 to 2033
Figure 76: Eastern Europe Market Value (US$ Million) Analysis by Country, 2018 to 2033
Figure 77: Eastern Europe Market Volume (Units) Analysis by Country, 2018 to 2033
Figure 78: Eastern Europe Market Value Share (%) and BPS Analysis by Country, 2023 to 2033
Figure 79: Eastern Europe Market Y-o-Y Growth (%) Projections by Country, 2023 to 2033
Figure 80: Eastern Europe Market Value (US$ Million) Analysis by Output Power, 2018 to 2033
Figure 81: Eastern Europe Market Volume (Units) Analysis by Output Power, 2018 to 2033
Figure 82: Eastern Europe Market Value Share (%) and BPS Analysis by Output Power, 2023 to 2033
Figure 83: Eastern Europe Market Y-o-Y Growth (%) Projections by Output Power, 2023 to 2033
Figure 84: Eastern Europe Market Value (US$ Million) Analysis by Application, 2018 to 2033
Figure 85: Eastern Europe Market Volume (Units) Analysis by Application, 2018 to 2033
Figure 86: Eastern Europe Market Value Share (%) and BPS Analysis by Application, 2023 to 2033
Figure 87: Eastern Europe Market Y-o-Y Growth (%) Projections by Application, 2023 to 2033
Figure 88: Eastern Europe Market Attractiveness by Output Power, 2023 to 2033
Figure 89: Eastern Europe Market Attractiveness by Application, 2023 to 2033
Figure 90: Eastern Europe Market Attractiveness by Country, 2023 to 2033
Figure 91: South Asia and Pacific Market Value (US$ Million) by Output Power, 2023 to 2033
Figure 92: South Asia and Pacific Market Value (US$ Million) by Application, 2023 to 2033
Figure 93: South Asia and Pacific Market Value (US$ Million) by Country, 2023 to 2033
Figure 94: South Asia and Pacific Market Value (US$ Million) Analysis by Country, 2018 to 2033
Figure 95: South Asia and Pacific Market Volume (Units) Analysis by Country, 2018 to 2033
Figure 96: South Asia and Pacific Market Value Share (%) and BPS Analysis by Country, 2023 to 2033
Figure 97: South Asia and Pacific Market Y-o-Y Growth (%) Projections by Country, 2023 to 2033
Figure 98: South Asia and Pacific Market Value (US$ Million) Analysis by Output Power, 2018 to 2033
Figure 99: South Asia and Pacific Market Volume (Units) Analysis by Output Power, 2018 to 2033
Figure 100: South Asia and Pacific Market Value Share (%) and BPS Analysis by Output Power, 2023 to 2033
Figure 101: South Asia and Pacific Market Y-o-Y Growth (%) Projections by Output Power, 2023 to 2033
Figure 102: South Asia and Pacific Market Value (US$ Million) Analysis by Application, 2018 to 2033
Figure 103: South Asia and Pacific Market Volume (Units) Analysis by Application, 2018 to 2033
Figure 104: South Asia and Pacific Market Value Share (%) and BPS Analysis by Application, 2023 to 2033
Figure 105: South Asia and Pacific Market Y-o-Y Growth (%) Projections by Application, 2023 to 2033
Figure 106: South Asia and Pacific Market Attractiveness by Output Power, 2023 to 2033
Figure 107: South Asia and Pacific Market Attractiveness by Application, 2023 to 2033
Figure 108: South Asia and Pacific Market Attractiveness by Country, 2023 to 2033
Figure 109: East Asia Market Value (US$ Million) by Output Power, 2023 to 2033
Figure 110: East Asia Market Value (US$ Million) by Application, 2023 to 2033
Figure 111: East Asia Market Value (US$ Million) by Country, 2023 to 2033
Figure 112: East Asia Market Value (US$ Million) Analysis by Country, 2018 to 2033
Figure 113: East Asia Market Volume (Units) Analysis by Country, 2018 to 2033
Figure 114: East Asia Market Value Share (%) and BPS Analysis by Country, 2023 to 2033
Figure 115: East Asia Market Y-o-Y Growth (%) Projections by Country, 2023 to 2033
Figure 116: East Asia Market Value (US$ Million) Analysis by Output Power, 2018 to 2033
Figure 117: East Asia Market Volume (Units) Analysis by Output Power, 2018 to 2033
Figure 118: East Asia Market Value Share (%) and BPS Analysis by Output Power, 2023 to 2033
Figure 119: East Asia Market Y-o-Y Growth (%) Projections by Output Power, 2023 to 2033
Figure 120: East Asia Market Value (US$ Million) Analysis by Application, 2018 to 2033
Figure 121: East Asia Market Volume (Units) Analysis by Application, 2018 to 2033
Figure 122: East Asia Market Value Share (%) and BPS Analysis by Application, 2023 to 2033
Figure 123: East Asia Market Y-o-Y Growth (%) Projections by Application, 2023 to 2033
Figure 124: East Asia Market Attractiveness by Output Power, 2023 to 2033
Figure 125: East Asia Market Attractiveness by Application, 2023 to 2033
Figure 126: East Asia Market Attractiveness by Country, 2023 to 2033
Figure 127: Middle East and Africa Market Value (US$ Million) by Output Power, 2023 to 2033
Figure 128: Middle East and Africa Market Value (US$ Million) by Application, 2023 to 2033
Figure 129: Middle East and Africa Market Value (US$ Million) by Country, 2023 to 2033
Figure 130: Middle East and Africa Market Value (US$ Million) Analysis by Country, 2018 to 2033
Figure 131: Middle East and Africa Market Volume (Units) Analysis by Country, 2018 to 2033
Figure 132: Middle East and Africa Market Value Share (%) and BPS Analysis by Country, 2023 to 2033
Figure 133: Middle East and Africa Market Y-o-Y Growth (%) Projections by Country, 2023 to 2033
Figure 134: Middle East and Africa Market Value (US$ Million) Analysis by Output Power, 2018 to 2033
Figure 135: Middle East and Africa Market Volume (Units) Analysis by Output Power, 2018 to 2033
Figure 136: Middle East and Africa Market Value Share (%) and BPS Analysis by Output Power, 2023 to 2033
Figure 137: Middle East and Africa Market Y-o-Y Growth (%) Projections by Output Power, 2023 to 2033
Figure 138: Middle East and Africa Market Value (US$ Million) Analysis by Application, 2018 to 2033
Figure 139: Middle East and Africa Market Volume (Units) Analysis by Application, 2018 to 2033
Figure 140: Middle East and Africa Market Value Share (%) and BPS Analysis by Application, 2023 to 2033
Figure 141: Middle East and Africa Market Y-o-Y Growth (%) Projections by Application, 2023 to 2033
Figure 142: Middle East and Africa Market Attractiveness by Output Power, 2023 to 2033
Figure 143: Middle East and Africa Market Attractiveness by Application, 2023 to 2033
Figure 144: Middle East and Africa Market Attractiveness by Country, 2023 to 2033
The market is valued at USD 5.0 billion in 2023.
Amtec, Coherent, Inc., and Control Laser Corporation are the key market players.
The market is forecast to register a CAGR of 3.6% through 2033.
The market is estimated to reach USD 7.1 billion by 2033.
Increasing demand from the cosmetic industry is encouraging carbon dioxide laser adoption.
Explore Similar Insights
Thank you!
You will receive an email from our Business Development Manager. Please be sure to check your SPAM/JUNK folder too.