The carbon capture and sequestration (CCS) market is expanding steadily, driven by global decarbonization initiatives, stricter emission regulations, and corporate commitments toward achieving net-zero targets. Industrial sectors such as power generation, cement, and chemicals are adopting CCS technologies to mitigate greenhouse gas emissions while maintaining operational continuity.
The market is also benefiting from increasing government incentives and funding for large-scale carbon capture infrastructure. Technological advancements in absorption materials, compression systems, and underground storage monitoring have improved cost efficiency and safety, encouraging wider deployment.
Furthermore, growing interest in carbon utilization—particularly in enhanced oil recovery and synthetic fuel production—is expanding revenue potential. With both developed and emerging economies investing in CCS projects to meet climate goals, the market is projected to experience sustained long-term growth supported by policy alignment and industrial innovation..
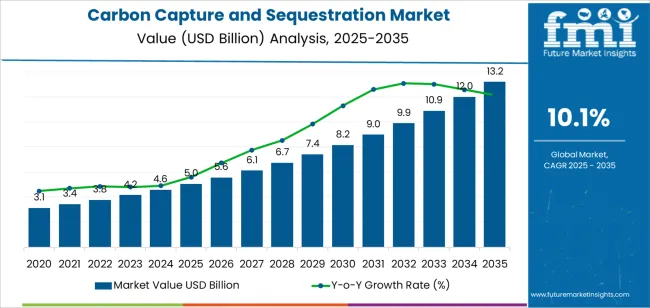
| Metric | Value |
|---|---|
| Carbon Capture and Sequestration Market Estimated Value in (2025 E) | USD 5.0 billion |
| Carbon Capture and Sequestration Market Forecast Value in (2035 F) | USD 13.2 billion |
| Forecast CAGR (2025 to 2035) | 10.1% |
The market is segmented by Capture Source and End-Use and region. By Capture Source, the market is divided into Chemicals, Natural Gas Processing, Power Generation, Fertilizers Production, and Others. In terms of End-Use, the market is classified into Enhanced Oil Recovery (EOR) and Dedicated Storage & Treatment. Regionally, the market is classified into North America, Latin America, Western Europe, Eastern Europe, Balkan & Baltic Countries, Russia & Belarus, Central Asia, East Asia, South Asia & Pacific, and the Middle East & Africa.
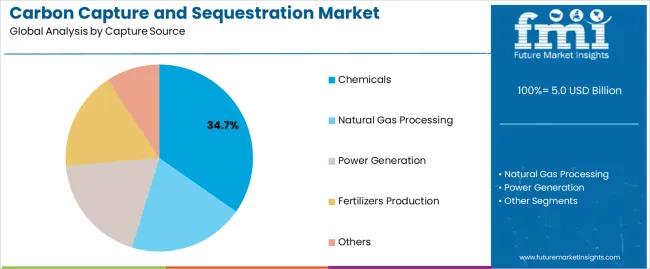
The chemicals segment dominates the capture source category, accounting for approximately 34.7% share of the carbon capture and sequestration market. This segment’s leadership is attributed to the high concentration of carbon dioxide emissions from chemical manufacturing processes, making capture operations more efficient and cost-effective. Chemical facilities produce CO₂ as a by-product of ammonia, hydrogen, and ethylene oxide production, which can be easily captured using post-combustion or industrial gas separation technologies.
The sector’s extensive infrastructure and integration potential with existing purification systems further enhance feasibility. Additionally, chemical producers are under significant pressure to decarbonize supply chains, leading to accelerated CCS adoption.
Continuous technological refinement and the presence of large-scale pilot projects have solidified the segment’s dominance. With ongoing investments in low-carbon chemical manufacturing and carbon recycling initiatives, the chemicals segment is expected to maintain its leading position throughout the forecast period..
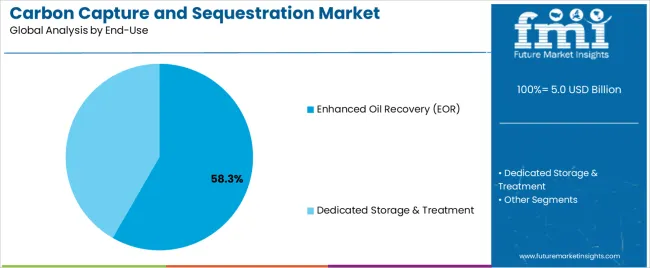
The enhanced oil recovery (EOR) segment holds approximately 58.3% share in the end-use category of the CCS market. This segment’s growth is driven by its dual advantage of facilitating carbon storage while boosting oil extraction efficiency from mature reservoirs. Captured CO₂ is injected into depleted wells to enhance pressure, enabling the extraction of additional hydrocarbons.
The economic benefits derived from incremental oil recovery make EOR one of the most commercially viable applications of CCS technology. Established pipeline infrastructure in oil-producing regions has further supported cost-effective CO₂ transport and utilization.
The segment also aligns with sustainability mandates as it provides a transitional pathway for the oil and gas industry to reduce emissions while maintaining output. With increasing collaboration between energy producers and technology developers, the EOR segment is projected to sustain its leading role in the global CCS market..
From 2020 to 2025, the carbon capture and sequestration (CSS) market experienced a remarkable CAGR of 24.2%. This substantial growth can be attributed to several factors, including increasing awareness of climate change, stringent environmental regulations, and growing investments in low-carbon technologies.
Governments and industries worldwide have been increasingly focused on reducing greenhouse gas emissions, driving the adoption of CCS solutions as a key mitigation strategy. Advancements in CCS technologies, supportive government policies, and financial incentives have further propelled market growth during this period.
Looking ahead to the forecasted period of 2025 to 2035, the CCS market is anticipated to grow at a robust CAGR of 20.1%. Despite the slightly moderated growth rate compared to the historical period, this forecasted growth indicates sustained momentum in adopting CCS technologies.
Factors such as continued regulatory support, advancements in capture and storage technologies, and increasing investments in carbon mitigation efforts are expected to drive market expansion during the forecast period. Furthermore, as the global focus on combating climate change intensifies, the demand for CCS solutions is likely to remain strong, positioning the market for continued growth in the coming years.
| Historical CAGR from 2020 to 2025 | 24.2% |
|---|---|
| Forecast CAGR from 2025 to 2035 | 20.1% |
The provided table highlights the top five countries in terms of revenue, with South Korea leading the list.
South Korea has invested substantially in developing advanced CCS technologies, driven by its commitment to combating climate change and reducing greenhouse gas emissions.
The robust technological capabilities, government support, and collaboration with leading industry players have enabled South Korea to develop cutting-edge CCS solutions and establish itself as a global leader in carbon capture initiatives.
| Countries | Forecast CAGRs from 2025 to 2035 |
|---|---|
| The United States | 20.4% |
| China | 21% |
| Japan | 21.4% |
| South Korea | 22.6% |
| The United Kingdom | 21.8% |
The carbon capture and sequestration (CCS) market growth in the United States is primarily utilized across various sectors, including power generation, oil and gas, and industrial manufacturing. CCS technologies are deployed in coal-fired power plants and natural gas facilities to capture carbon dioxide emissions, reducing their environmental impact.
CCS is used in industrial processes such as cement production and steel manufacturing to mitigate greenhouse gas emissions. The United States also invests in CCS projects for enhanced oil recovery (EOR) and carbon utilization initiatives, contributing to the growth of the market.
The CCS market in China is predominantly utilized in the power generation and industrial sectors, where coal-fired power plants and heavy industries account for significant carbon emissions. CCS technologies are deployed to capture CO2 emissions from coal-fired power plants and industrial facilities, helping China reduce its carbon footprint and meet emission reduction targets.
China invests in CCS projects for carbon utilization applications such as enhanced oil recovery (EOR) and chemical manufacturing, contributing to the expansion of the CCS market.
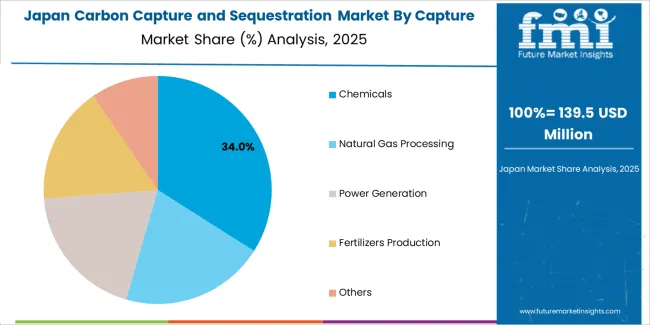
In Japan, the CCS market is primarily used in the power generation and industrial sectors. CCS technologies are deployed to capture CO2 emissions from coal-fired power plants, natural gas facilities, and industrial processes.
Committing to reducing greenhouse gas emissions and transitioning to a low-carbon economy drives investment in CCS projects and research initiatives. Japan explores CCS applications for carbon utilization, including EOR and chemical synthesis, further enhancing the utilization of CCS technologies in the country.
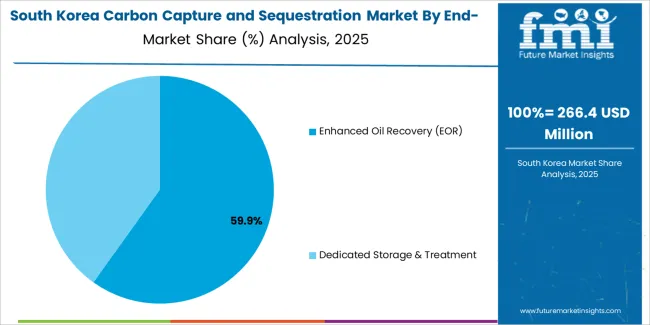
The CCS market is majorly utilized in the power generation, industrial, and transportation sectors. CCS technologies are deployed in coal-fired power plants, steel manufacturing facilities, and petrochemical industries to capture CO2 emissions and reduce environmental impact.
The strong focus on technological innovation and sustainability drives investment in CCS projects and research initiatives. South Korea explores CCS applications for carbon utilization in EOR and chemical synthesis, contributing to the growth of the CCS market in the country.
In the United Kingdom, the CCS market is predominantly utilized in the power generation and industrial sectors. CCS technologies are deployed to capture CO2 emissions from coal-fired power plants, natural gas facilities, and industrial processes.
Committing to decarbonization and achieving net-zero emissions targets drives investment in CCS projects and research initiatives. The United Kingdom explores CCS applications for carbon utilization in EOR, hydrogen production, and chemical synthesis, further enhancing the utilization of CCS technologies in the country.
The below section shows the leading segment. On the basis of end-use, enhanced oil recovery is anticipated to expand at 19.8% CAGR by 2035. Based on the capture source, the chemicals segment is projected to expand at 19.5% CAGR by 2035.
With conventional oil reserves depleting and global energy demand rising, there is a growing emphasis on maximizing the recovery of remaining oil reserves. Chemical manufacturing processes are significant sources of CO2 emissions, making the industry a prime target for CCS implementation.
| Category | CAGR from 2025 to 2035 |
|---|---|
| Enhanced Oil Recovery | 19.8% |
| Chemicals | 19.5% |
Enhanced oil recovery (EOR) is a leading carbon capture and sequestration (CCS) market segment. EOR involves injecting the carbon dioxide captured into oil reservoirs to increase oil production and extend the life of mature oil fields.
The anticipated expansion at a CAGR of 19.8% by 2035 reflects the growing adoption of CCS technologies for EOR applications globally. The growth in this segment is driven by factors such as the increasing demand for oil, the need for cost-effective production methods, and government incentives supporting CCS-EOR projects.
Within the capture source segment of the CCS market, the chemicals industry emerges as a leading segment. Chemical plants and refineries are significant sources of CO2 emissions, making them prime candidates for CCS implementation.
The projected expansion at a CAGR of 19.5% by 2035 underscores the growing demand for CCS solutions in the chemicals sector to reduce carbon emissions and comply with regulatory requirements.
The growth is fueled by stringent environmental regulations, corporate sustainability initiatives, and technological advancements in carbon capture technologies tailored for chemical processes.
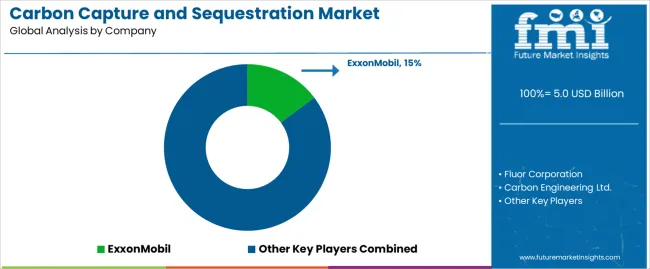
The competitive landscape of the carbon capture and sequestration (CCS) market dynamics is characterized by key players such as ExxonMobil, Shell, and Chevron, alongside emerging companies like Carbon Engineering and Climeworks.
The industry leaders leverage extensive Research and Development investments, strategic partnerships, and technological expertise to drive innovation and market expansion.
Regional players and startups contribute to market competitiveness, offering niche solutions and driving price competition. Collaboration between governments, industries, and research institutions further intensifies competition, fostering innovation and market growth.
Key Industry Developments
| Attributes | Details |
|---|---|
| Estimated Market Size in 2025 | USD 5.0 billion |
| Projected Market Valuation in 2035 | USD 13.2 billion |
| Value-based CAGR 2025 to 2035 | 10.1% |
| Forecast Period | 2025 to 2035 |
| Historical Data Available for | 2020 to 2025 |
| Market Analysis | Value in USD billion |
| Key Regions Covered | North America; Latin America; Western Europe; Eastern Europe; South Asia and Pacific; East Asia; Middle East and Africa |
| Key Market Segments Covered | Capture Source, End Use, Region |
| Key Countries Profiled | The United States, Canada, Brazil, Mexico, Germany, The United Kingdom, France, Spain, Italy, Russia, Poland, Czech Republic, Romania, India, Bangladesh, Australia, New Zealand, China, Japan, South Korea, GCC countries, South Africa, Israel |
| Key Companies Profiled | Fluor Corporation; ExxonMobil; Carbon Engineering Ltd.; ADNOC Group; Equinor; China National Petroleum Corporation; Dakota Gasification Company; Shell; BP; Chevron; Linde; Total; Aker Solutions; NRG Energy |
The global carbon capture and sequestration market is estimated to be valued at USD 5.0 billion in 2025.
The market size for the carbon capture and sequestration market is projected to reach USD 13.2 billion by 2035.
The carbon capture and sequestration market is expected to grow at a 10.1% CAGR between 2025 and 2035.
The key product types in carbon capture and sequestration market are chemicals, natural gas processing, power generation, fertilizers production and others.
In terms of end-use, enhanced oil recovery (eor) segment to command 58.3% share in the carbon capture and sequestration market in 2025.


Full Research Suite comprises of:
Market outlook & trends analysis
Interviews & case studies
Strategic recommendations
Vendor profiles & capabilities analysis
5-year forecasts
8 regions and 60+ country-level data splits
Market segment data splits
12 months of continuous data updates
DELIVERED AS:
PDF EXCEL ONLINE
Carbon Dioxide Incubators Market Size and Share Forecast Outlook 2025 to 2035
Carbon Enhanced Lead Acid Battery Market Size and Share Forecast Outlook 2025 to 2035
Carbon-negative Cement Market Size and Share Forecast Outlook 2025 to 2035
Carbon Tetrabromide Market Size and Share Forecast Outlook 2025 to 2035
Carbon Steel Market Size and Share Forecast Outlook 2025 to 2035
Carbon Brush Market Size and Share Forecast Outlook 2025 to 2035
Carbon Offset Platform Market Size and Share Forecast Outlook 2025 to 2035
Carbon Tapes Market Size and Share Forecast Outlook 2025 to 2035
Carbon-Free Waste Gas Abatement System Market Size and Share Forecast Outlook 2025 to 2035
Carbon Labeled Packaged Meal Market Analysis - Size and Share Forecast Outlook 2025 to 2035
Carbon Fiber Bike Wheelset Market Size and Share Forecast Outlook 2025 to 2035
Carbon Dioxide Lasers Market Size and Share Forecast Outlook 2025 to 2035
Carbon-negative Packaging Market Size and Share Forecast Outlook 2025 to 2035
Carbon Fiber Construction Repair Market Size and Share Forecast Outlook 2025 to 2035
Carbon Credit Market Size and Share Forecast Outlook 2025 to 2035
Carbon-Dioxide Synthesis Cosmetics Market Size and Share Forecast Outlook 2025 to 2035
Carbon-Neutral Skincare Ingredients Market Analysis - Size and Share Forecast Outlook 2025 to 2035
Carbonate Market Size and Share Forecast Outlook 2025 to 2035
Carbon Fiber Reinforced Plastic Market Size and Share Forecast Outlook 2025 to 2035
Carbon Fiber Wraps Market Size and Share Forecast Outlook 2025 to 2035

Thank you!
You will receive an email from our Business Development Manager. Please be sure to check your SPAM/JUNK folder too.
Chat With
MaRIA