Reports

- Global Locations -

Headquarters

Future Market Insights, Inc.

Christiana Corporate, 200
Continental Drive, Suite 401,
Newark, Delaware - 19713,
United States

T: +1-845-579-5705

Americas

Future Market Insights, Inc.

616 Corporate Way, Suite 2-9018,
Valley Cottage, NY 10989, United States

T: +1-347-918-3531

MEA

Future Market Insights

1602-6 Jumeirah Bay X2 Tower, Plot No: JLT-PH2-X2A,
Jumeirah Lakes Towers, Dubai,
United Arab Emirates

Europe

Future Market Insights

3rd Floor, 207 Regent Street,
W1B 3HH London
United Kingdom

T: + 44 (0) 20 8123 9659
D: +44 (0) 20 3287 4268

Asia Pacific

Future Market Insights

IndiaLand Global Tech Park, Unit UG-1, Behind Grand HighStreet, Phase 1, Hinjawadi, MH, Pune – 411057, India

Fine Chemicals Market Outlook (2023 to 2033)

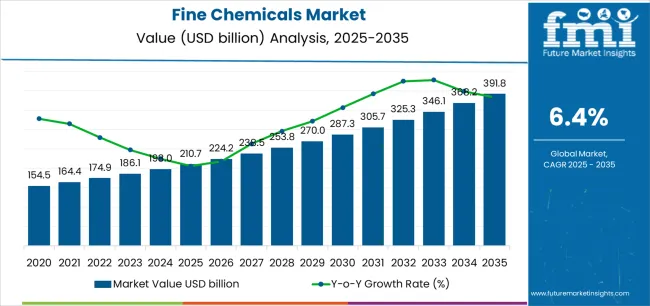
The global fine chemicals market size stood at US$ 144,469.5 million in 2018. The market observed a 6.6% year-on-year growth in 2022.

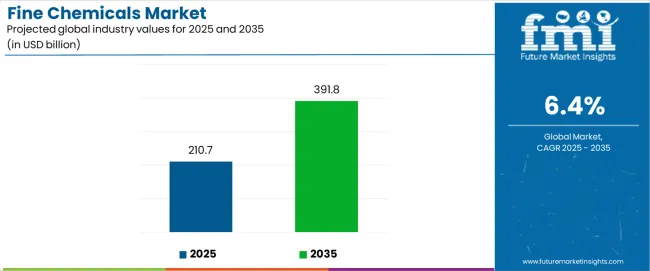
It is estimated to reach US$ 184,884.6 million in 2023. Over the assessment period from 2023 to 2033, the global market is projected to expand at a CAGR of 6.8%, culminating in a valuation of US$ 340,084.3 million by the end of 2033.

There is an increasing focus on quality and performance in various sectors such as pharmaceuticals, agriculture, and specialty chemicals. Fine chemicals are preferred for their high purity, precise composition, and specific functionalities.

They are hence considered to be crucial in the development of advanced products and processes. As the aforementioned sectors strive for innovation and improved efficiency, demand for fine chemicals to meet these requirements continues to expand.

The pharmaceutical sector is experiencing significant growth globally. With rising chronic diseases, increasing healthcare spending, and development of novel therapies, demand for fine chemicals used in drug manufacturing has surged.

Fine chemicals play a vital role in the synthesis of active pharmaceutical ingredients (APIs), which are the key components responsible for therapeutic effects of medications. As new drugs are being developed and existing ones are improved, demand for fine chemicals in the pharmaceutical sector remains robust.

There is a growing trend toward sustainable and environmentally friendly practices in various sectors. Fine chemicals are often used as catalysts, reagents, or intermediates in green chemistry processes.

Such processes aim to minimize waste, reduce energy consumption, and lower the use of hazardous substances. As companies strive to adopt sustainable manufacturing practices, demand for fine chemicals that enable greener processes continues to increase.

Attributes Key Insights
Fine Chemicals Market Value (2022A) US$ 174,163.2 million
Estimated Market Size (2023E) US$ 184,884.6 million
Projected Market Valuation (2033F) US$ 340,084.3 million
Value-based CAGR (2023 to 2033) 6.8%

Don't pay for what you don't need

Customize your report by selecting specific countries or regions and save 30%!

A few other factors pushing fine chemical sales in the market are

  • Rising demand for fine chemicals for the production of specialty polymers, coatings, and adhesives would spur sales.
  • Expansion of the agricultural sector and high need for fine chemicals in crop protection & fertilizers are set to drive demand.
  • Increasing investments in development of innovative materials such as nanomaterials and advanced composites would accelerate fine chemical demand.
  • Advancements in biotechnology and genetic engineering, requiring fine chemicals for gene synthesis and DNA sequencing would aid demand.
  • Expansion of the food & beverage sector is set to elevate the need for fine chemicals used as additives, flavorings, and preservatives.
  • Increasing regulations and standards related to product quality and safety would support demand for high-grade fine chemicals.

2018 to 2022 Fine Chemical Sales Outlook Compared to Demand Forecast from 2023 to 2033

From 2018 to 2022, the global fine chemicals market experienced steady growth at a CAGR of 6.6%. The market is driven by rising consumption of fine chemicals worldwide. Demand for fine chemicals has been increasing owing to growing need for specialty chemicals from the pharmaceutical and agrochemical sectors.

Based on Future Market Insights (FMI), the fine chemicals market is projected to experience a healthy 6.8% CAGR from 2023 to 2033. Demand for these chemicals is expected to continue to increase in the projected years.

It is set to be propelled by growing demand for APIs and unique medicines for preventing chronic diseases. High demand for specialty chemicals, increasing focus on sustainable chemicals, and growing demand for new chemicals in emerging markets are also expected to aid sales.

Nikhil Kaitwade
Nikhil Kaitwade

Principal Consultant

Talk to Analyst

Find your sweet spots for generating winning opportunities in this market.

What Are the Key Factors Driving Demand for Fine Chemicals in Global Market?

Growing aging population, coupled with rising health awareness among them is expected to drive demand over the forecast period. Increasing demand for fine chemicals in the pharmaceuticals sector to be used as pure substances is likely to boost sales.

Fine chemicals, which are characterized by their high cost and low production volume, are frequently employed in the production of medications for heart and blood vessel ailments. These chemicals are blended with basic compounds to create intricate chemical compounds that find diverse uses in the pharmaceutical and nutraceutical sectors.

In the field of medicine, fine chemicals play a crucial role in combating brain cancer, lung cancer, blood cancer, and liver cancer. Prominent companies have dedicated specialized divisions to the development of targeted drugs for specific diseases such as solid tumors and hematological oncology.

Fine chemicals manufacturing includes conversion of basic chemicals into complexes. It serves a wide range of applications across different sectors, which in turn, would augment fine chemical demand.

Rising number of construction and development projects is expected to drive demand for essential raw materials such as sealants, adhesives, and inhibitors. Consequently, this is projected to result in a substantial growth in the fine chemicals market. These raw materials are commonly produced using complex chemicals derived from fine chemical synthesis.

Unlike the continuous production of bulk chemicals, fine chemicals are produced in batches. Agrochemicals and active pharmaceutical ingredients are set to be the most common chemicals in fine chemicals space.

Growing awareness of the advantages of fine chemicals compared to commodity chemicals is also set to aid demand. Increasing spending by prominent companies on research & development capabilities and growing popularity due to environmental concerns are further expected to push demand.

How Can Fine Chemical Manufacturers Benefit from Opportunities in the Global Market?

Manufacturers, traders, and importers resonate with the increasing demand for fine chemicals and ensure regular supply to the global market. In order to maintain supply, manufacturers have increased their production capacity.

Increasing investment in research & development activities is a key factor pushing the global market for fine chemicals. Rising focus on the adoption of new manufacturing techniques to develop high-quality products is another vital factor that might create potential opportunities for key players.

Leading companies are nowadays offering a variety of services such as synthetic development. They are also focusing on establishing commercial production methods for small molecule manufacturing.

A few other players are set to cater to customers requiring limited quantities of small molecules. Such trends are projected to favor growth in the market during the forecast period. Emergence of contract and manufacturing organizations (CMOs) with integrated methods for producing small molecule intermediates would also help to push sales. Launch of advanced formulations and concepts for commercial manufacturing are augmenting growth.

Rising awareness of personal care and increased application of cleaning products are further supporting growth. Improved living standards and rising e-commerce activities would soon lead to an increasing demand for cosmetics and personal care items. It is likely to surge demand for fine chemicals in the next ten years.

Increasing demand for fine chemicals as a food preservative and flavoring agent is another vital factor driving the market. Rising awareness of packaged food and beverages is also expected to create new opportunities for fine chemical manufacturers.

Get the data you need at a Fraction of the cost

Personalize your report by choosing insights you need
and save 40%!

What Factors Might Contribute to Low Fine Chemical Sales in the Global Market?

One of the prominent challenges that the fine chemicals space faces is high costs associated with research and development capabilities. Fine chemicals are used in a wide range of sectors, including pharmaceuticals, food & beverage, cosmetics, and cleaning products, among others. Developing and manufacturing these chemicals requires significant investment in research, which can be difficult for companies to justify given the uncertain returns.

Another challenge that the fine chemicals market is currently facing is growing awareness of the potential negative effects of using certain chemicals. Skin allergies, for example, can be caused by the excessive use of specific fine chemicals. As a result, there is a growing demand for natural and organic alternatives to synthetic chemicals.

The market is correspondingly facing regulatory challenges. Governments around the world are imposing strict regulations on the use of fine chemicals, particularly in the pharmaceutical sector. These regulations can be costly and time-consuming for companies to comply with, which could limit their ability to invest in research & development and other growth initiatives.

Country-wise Insights

Why is Fine Chemical Demand Surging Exponentially in China?

Fine Chemical Suppliers in China to Focus on Research & Development Activities

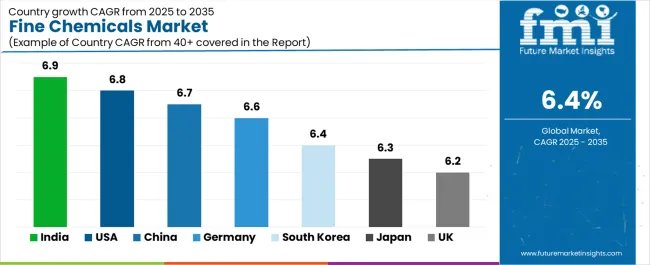
In 2022, East Asia accounted for 36.8% of the global fine chemicals market share. The region is set to remain at the forefront amid increasing demand for fine chemicals across China. China is set to expand at 7.0% CAGR from 2023 to 2033.

China has a well-established and sophisticated chemical sector with numerous established companies and a strong supply chain. This provides a good environment for the production and distribution of fine chemicals.

The country also has a large and growing demand for fine chemicals, driven by increasing demand for high-quality pharmaceuticals, agrochemicals, and other chemical products. This demand provides a favorable market for the manufacturing and sale of fine chemicals.

China has a favorable geographic location, with easy access to raw materials and markets. This is further making it simpler for companies to produce and distribute fine chemicals & meet the demands of customers worldwide.

It also has a strong research & development infrastructure, with multiple universities and research institutions focused on chemical and materials science. This has led to the development of advanced technologies and processes for the production of fine chemicals, which are now being adopted by companies in the country.

Category-wise Insights

Which is the Highly Preferred Type of Fine Chemical Worldwide?

Fine Chemical Manufacturing Companies to Experience High Demand from Pharmaceutical Firms

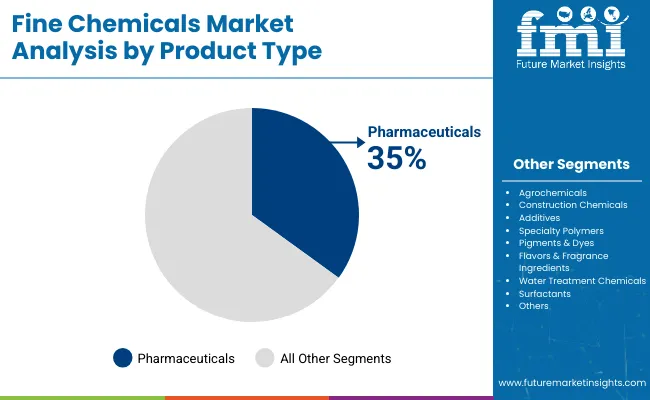
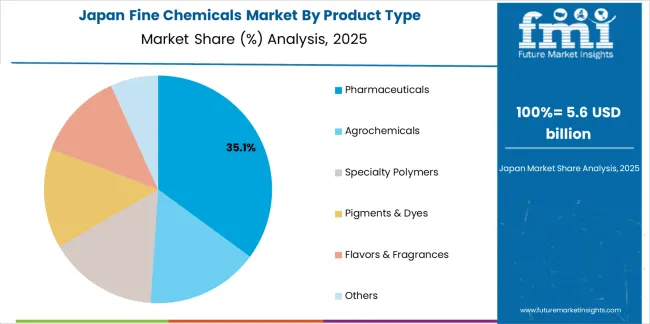
Based on product type, the pharmaceutical segment is expected to dominate the global fine chemicals market with a 64.2% share in 2022. Development of new drugs and treatments requires a significant amount of research & development.

It involves the synthesis of various fine chemicals. These chemicals are used to create APIs, which are the primary components of drugs.

APIs are dominant in the pharmaceutical sector owing to their specificity and application-based action. Price of APIs is relatively very high, as compared to other pharmaceutical-based products.

Manufacturing facilities of APIs are limited, as compared to other pharmaceutical-based products. The pharmaceutical sector is highly regulated, which requires companies to invest in the development and production of high-quality fine chemicals.

Compliance with regulatory requirements is crucial for ensuring the safety and efficacy of pharmaceutical products. It can only be achieved through the use of high-quality fine chemicals.

The aging population and increasing prevalence of chronic diseases are driving demand for new drugs & treatments. This trend is expected to continue in the next ten years, which will further increase fine chemical demand in the pharmaceutical sector.

Growing trends for personalized medicines and rapid development of biopharmaceuticals are further driving demand for fine chemicals in the pharmaceutical sector. Biopharmaceuticals require a wide range of fine chemicals for their production, including APIs, excipients, and intermediates.

Which Manufacturing Type Segment Would Generate the Maximum Revenue?

Captive Manufacturing to Find Extensive Use among Fine Chemical Products Manufacturers

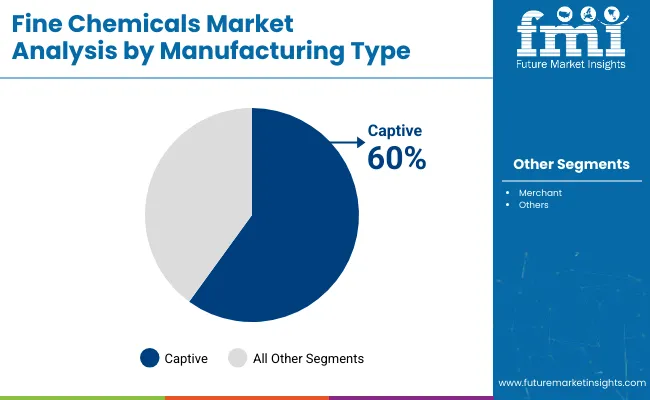
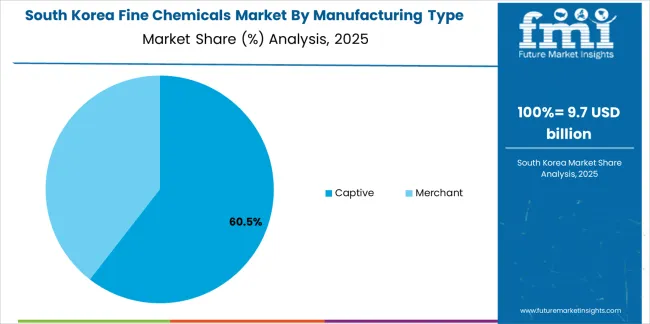
On the basis of manufacturing type, the captive segment is projected to lead the global market. It is set to account for a share of around 83% in 2033.

Fine chemicals often involve complex synthesis processes and proprietary formulations. By opting for captive manufacturing, companies can maintain control over their intellectual property and ensure that their innovative processes and formulations remain confidential.

Fine chemicals also require high levels of quality control to meet specific purity, composition, and performance standards. Captive manufacturing would allow companies to have direct oversight and control over the entire production process, ensuring consistent quality and adherence to strict specifications.

Fine chemicals are often produced in small quantities and have specialized sourcing requirements. By establishing captive manufacturing capabilities, companies can reduce their dependence on external suppliers. This can help them in mitigating the risks associated with supply chain disruptions such as availability, quality, or pricing issues.

Fine chemicals might also involve sensitive or potentially hazardous substances. Captive manufacturing allows companies to maintain strict control over handling, storage, and disposal practices. It can aid in ensuring compliance with regulatory requirements and minimizing the risk of intellectual property theft or unauthorized access to proprietary information.

Competitive Landscape

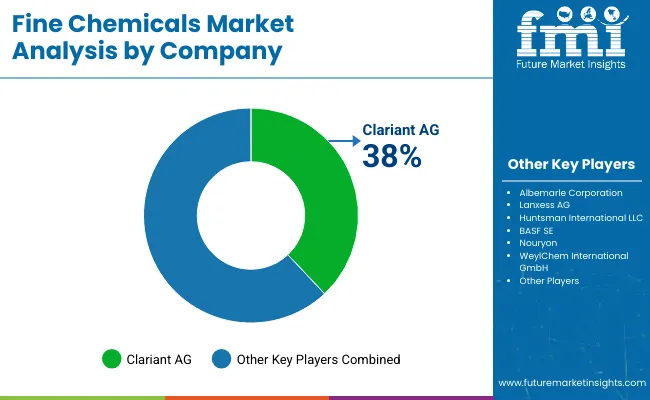
The fine chemicals market is a fairly consolidated industry with a certain number of players highly active across the globe. Key market participants account for about 40 to 45% of the global market share.

Prominent players in the global market are continuously engaging in boosting their production capacity and updating their product portfolios. Tier 1 companies hold dominant positions in the market due to their extensive global presence and wide-ranging product portfolios.

They also have robust research and development capabilities, as well as strong financial resources. In contrast, tier 2 companies specialize in niche markets or specific product segments.

They have been leveraging their regional focus, agility, and flexibility. Both tiers should prioritize key factors such as product quality, regulatory compliance, customer satisfaction, and sustainability practices to compete.

For instance:

  • In October 2022, Albemarle Corporation Company successfully acquired Guangxi Tianyuan New Energy Materials Co., Ltd. This is a significant milestone in its development. The acquisition was completed by purchasing all of Qinzhou's outstanding equity for a total cash amount of about US$ 200 million. Qinzhou is a company engaged in the production of lithium, a crucial material for the manufacturing of batteries.
  • In March 2022, Lonza announced that it has expanded API development and manufacturing laboratories in Nansha, China.
  • In November 2022, Lonza, an international manufacturing collaborator for the pharmaceutical, biotech, and nutrition sectors joined forces with AbTis. It is a Korea-based biotech firm focused on advancing antibody drug conjugates (ADCs). They aim to enhance the precision of bioconjugation approaches for innovative therapies based on bioconjugates.
  • In 2022, Pfizer announced that it would be investing US$ 100 million in a new fine chemicals facility in Ireland. The facility will produce active pharmaceutical ingredients (APIs) for Pfizer's global vaccine business. The new facility is expected to be operational by 2024 and will create up to 200 jobs.
  • In April 2021, Lonza announced its plans to build a new manufacturing facility dedicated to small molecules at its site in Visp. The new investment amounts to US$ 218.6 million.

Scope of the Report

Attribute Details
Estimated Market Size (2023) US$ 184,884.6 million
Projected Market Valuation (2033) US$ 340,084.3 million
Value-based CAGR (2023 to 2033) 6.8%
Forecast Period 2023 to 2033
Historical Data Available for 2018 to 2022
Market Analysis Value (US$ million) and Volume (tons)
Key Regions Covered North America, Latin America, Western Europe, Eastern Europe, Central Asia, Russia & Belarus, Balkan & Baltics, East Asia, South Asia Pacific, and Middle East Africa
Key Market Segments Covered By Product Type, By Manufacturing Type, By Application, and By Region
Key Companies Profiled
  • Albemarle Corporation
  • Lanxess AG
  • Huntsman International LLC
  • BASF SE
  • Nouryon
  • WeylChem International GmbH
  • CHEMADA Industries Ltd
  • Syntor Fine Chemicals Ltd
  • Boehringer Ingelheim International GmbH
  • Lonza Group Ltd
  • Evonik Industries AG
  • Clariant AG
  • Bayer AG
  • Merck & Co, Inc.
  • Sumitomo Chemicals
  • GlaxoSmithKline plc
  • Pfizer Inc.
  • Johnson Matthey
  • Novartis International AG
  • Toray Fine Chemicals Co, Ltd
Report Coverage Market Forecast, Company Share Analysis, Competition Intelligence, Market Dynamics and Challenges, and Strategic Growth Initiatives

Fine Chemicals Market Outlook by Category

By Product Type:

  • Pharmaceuticals
    • Active Pharmaceutical Ingredients
    • Excipient
    • Peptides & Proteins
    • Steroids
    • Alkaloids
    • Others
  • Agrochemicals
    • Pesticides
    • Insecticides
    • Herbicides
    • Biocides
  • Construction Chemicals
    • Adhesives & Sealants
    • Admixtures
    • Coating Ingredient
    • Superplasticizer
    • Others
  • Additives
    • Food & Feed Additive
    • Drug Additive
    • Polymer Additives
    • Others
  • Specialty Polymers
  • Pigments & Dyes
  • Flavors & Fragrance Ingredients
  • Water Treatment Chemicals
  • Surfactants
  • Others

By Manufacturing Type:

  • Captive
  • Merchant

By Application:

  • Pharmaceuticals & Nutraceuticals
  • Agriculture Industry
  • Cosmetics & Personal Care
  • Petrochemicals & Plastic Industry
  • Food & Beverages
  • Electronics
  • Paints & Coatings
  • Building & Construction
  • Lubricants & Oil
  • Textiles
  • Others

By Region:

  • North America
  • Latin America
  • Western Europe
  • Eastern Europe
  • Central Asia
  • Russia & Belarus
  • Balkan & Baltics
  • East Asia
  • South Asia Pacific
  • Middle East Africa

Frequently Asked Questions

Which Factors are Driving the Fine Chemicals Market Expansion?

Increasing pharmaceutical demand and specialty applications are the primary drivers of fine chemicals market expansion.

What is the Projected Future Outlook for the Fine Chemicals Market?

The fine chemicals market size is projected to reach a valuation of US$ 340,084.3 million by 2033, up from US$ 184,884.6 million in 2023.

How is the Growth Rate of the Fine Chemicals Market Expected to Evolve?

The fine chemicals market is anticipated to upsurge at a CAGR of 6.8% through 2033.

Which Country Holds a Leading Position in the Fine Chemicals Market?

Given its advanced manufacturing and robust industry presence, the United States commands a prominent position in the fine chemicals market.

What Challenges are Hindering the Growth of the Fine Chemicals Market?

Stringent regulations, raw material availability, and complex supply chains pose growth challenges for the fine chemicals market.

Table of Content

1. Executive Summary

    1.1. Global Market Outlook

    1.2. Demand Side Trends

    1.3. Supply Side Trends

    1.4. Technology Roadmap

    1.5. Analysis and Recommendations

2. Market Overview

    2.1. Market Coverage / Taxonomy

    2.2. Market Definition / Scope / Limitations

3. Key Market Trends

    3.1. Key Trends Impacting the Market

    3.2. Material Innovation / Development Trends

4. Key Success Factors

    4.1. Material Adoption / Usage Analysis

    4.2. Material USPs / Features

    4.3. Strategic Promotional Strategies

5. Global Market Demand Analysis 2018 to 2022 and Forecast, 2023 to 2033

    5.1. Historical Market Volume (tons) Analysis, 2018 to 2022

    5.2. Current and Future Market Volume (tons) Projections, 2023 to 2033

    5.3. Y-o-Y Growth Trend Analysis

6. Global Market - Pricing Analysis

    6.1. Regional Pricing Analysis

    6.2. Global Average Pricing Analysis Benchmark

7. Global Market Demand (in Value or Size in US$ million) Analysis 2018 to 2022 and Forecast, 2023 to 2033

    7.1. Historical Market Value (US$ million) Analysis, 2018 to 2022

    7.2. Current and Future Market Value (US$ million) Projections, 2023 to 2033

        7.2.1. Y-o-Y Growth Trend Analysis

        7.2.2. Absolute $ Opportunity Analysis

8. Market Background

    8.1. Macro-Economic Factors

    8.2. Forecast Factors - Relevance & Impact

    8.3. Value Chain

        8.3.1. Raw Material Suppliers

        8.3.2. Material Manufacturers

        8.3.3. Distributors

        8.3.4. Probable End-Users

        8.3.5. Average Profitability Margin

    8.4. COVID-19 Crisis – Impact Assessment

        8.4.1. Current Statistics

        8.4.2. Short-Mid-Long Term Outlook

        8.4.3. Likely Rebound

    8.5. Market Dynamics

        8.5.1. Drivers

        8.5.2. Restraints

        8.5.3. Opportunity Analysis

    8.6. Global Supply Demand Analysis

    8.7. Porter Five Force Analysis

    8.8. Patent Analysis

    8.9. Key Regulations

9. Global Market Analysis 2018 to 2022 and Forecast 2023 to 2033, by Product Type

    9.1. Introduction / Key Findings

    9.2. Historical Market Size (US$ million) and Volume (tons) Analysis By Product Type, 2018 to 2022

    9.3. Current and Future Market Size (US$ million) and Volume Analysis and Forecast By Product Type, 2023 to 2033

        9.3.1. Pharmaceuticals

            9.3.1.1. Active Pharmaceutical Ingredients

            9.3.1.2. Excipient

            9.3.1.3. Peptides & Proteins

            9.3.1.4. Steroids

            9.3.1.5. Alkaloids

            9.3.1.6. Others

        9.3.2. Agrochemicals

            9.3.2.1. Pesticides

            9.3.2.2. Insecticides

            9.3.2.3. Herbicides

            9.3.2.4. Biocides

        9.3.3. Construction Chemicals

            9.3.3.1. Adhesives & Sealants

            9.3.3.2. Admixtures

            9.3.3.3. Coating Ingredient

            9.3.3.4. Superplasticizer

            9.3.3.5. Others

        9.3.4. Additives

            9.3.4.1. Food & Feed Additive

            9.3.4.2. Drug Additive

            9.3.4.3. Polymer Additives

            9.3.4.4. Others

        9.3.5. Specialty Polymers

        9.3.6. Pigments & Dyes

        9.3.7. Flavors & Fragrance Ingredients

        9.3.8. Water Treatment Chemicals

        9.3.9. Surfactants

        9.3.10. Others

    9.4. Market Attractiveness Analysis By Product Type

10. Global Market Analysis 2018 to 2022 and Forecast 2023 to 2033, by Manufacturing Type

    10.1. Introduction / Key Findings

    10.2. Historical Market Size (US$ million) and Volume (tons) Analysis By Manufacturing Type, 2018 to 2022

    10.3. Current and Future Market Size (US$ million) and Volume Analysis and Forecast By Manufacturing Type, 2023 to 2033

        10.3.1. Captive

        10.3.2. Merchant

    10.4. Market Attractiveness Analysis By Manufacturing Type

11. Global Market Analysis 2018 to 2022 and Forecast 2023 to 2033, by Application

    11.1. Introduction / Key Findings

    11.2. Historical Market Size (US$ million) and Volume (tons) Analysis by Application, 2018 to 2022

    11.3. Current and Future Market Size (US$ million) and Volume Analysis and Forecast by Application, 2023 to 2033

        11.3.1. Pharmaceuticals & Nutraceuticals

        11.3.2. Agriculture Industry

        11.3.3. Cosmetics & Personal Care

        11.3.4. Petrochemicals & Plastic Industry

        11.3.5. Food & Beverages

        11.3.6. Electronics

        11.3.7. Paints & Coatings

        11.3.8. Building & Construction

        11.3.9. Lubricants & Oil

        11.3.10. Textiles

        11.3.11. Others

    11.4. Market Attractiveness Analysis by Application

12. Global Market Analysis 2018 to 2022 and Forecast 2023 to 2033, by Region

    12.1. Introduction

    12.2. Historical Market Size (US$ million) and Volume (tons) Analysis By Region, 2018 to 2022

    12.3. Current Market Size (US$ million) and Volume (tons) Analysis and Forecast By Region, 2023 to 2033

        12.3.1. North America

        12.3.2. Latin America

        12.3.3. Western Europe

        12.3.4. Eastern Europe

        12.3.5. Central Asia

        12.3.6. Russia & Belarus

        12.3.7. Balkan & Baltic Countries

        12.3.8. East Asia

        12.3.9. South Asia & Pacific

        12.3.10. Middle East & Africa

    12.4. Market Attractiveness Analysis By Region

13. North America Market Analysis 2018 to 2022 and Forecast 2023 to 2033

    13.1. Introduction

    13.2. Pricing Analysis

    13.3. Historical Market Size (US$ million) and Volume Trend Analysis By Market Taxonomy, 2018 to 2022

    13.4. Market Size (US$ million) and Volume Forecast By Market Taxonomy, 2023 to 2033

        13.4.1. By Country

            13.4.1.1. United States

            13.4.1.2. Canada

        13.4.2. By Product Type

        13.4.3. By Manufacturing Type

        13.4.4. By Application

    13.5. Market Attractiveness Analysis

        13.5.1. By Country

        13.5.2. By Product Type

        13.5.3. By Manufacturing Type

        13.5.4. By Application

    13.6. Key Market Participants - Intensity Mapping

14. Latin America Market Analysis 2018 to 2022 and Forecast 2023 to 2033

    14.1. Introduction

    14.2. Pricing Analysis

    14.3. Historical Market Size (US$ million) and Volume Trend Analysis By Market Taxonomy, 2018 to 2022

    14.4. Market Size (US$ million) and Volume Forecast By Market Taxonomy, 2023 to 2033

        14.4.1. By Country

            14.4.1.1. Brazil

            14.4.1.2. Mexico

            14.4.1.3. Argentina

        14.4.2. By Product Type

        14.4.3. By Manufacturing Type

        14.4.4. By Application

    14.5. Market Attractiveness Analysis

        14.5.1. By Country

        14.5.2. By Product Type

        14.5.3. By Manufacturing Type

        14.5.4. By Application

    14.6. Key Market Participants - Intensity Mapping

15. Western Europe Market Analysis 2018 to 2022 and Forecast 2023 to 2033

    15.1. Introduction

    15.2. Pricing Analysis

    15.3. Historical Market Size (US$ million) and Volume Trend Analysis By Market Taxonomy, 2018 to 2022

    15.4. Market Size (US$ million) and Volume Forecast By Market Taxonomy, 2023 to 2033

        15.4.1. By Country

            15.4.1.1. Germany

            15.4.1.2. Italy

            15.4.1.3. France

            15.4.1.4. United Kingdom

            15.4.1.5. Spain

            15.4.1.6. BENELUX

            15.4.1.7. NORDICS

        15.4.2. By Product Type

        15.4.3. By Manufacturing Type

        15.4.4. By Application

    15.5. Market Attractiveness Analysis

        15.5.1. By Country

        15.5.2. By Product Type

        15.5.3. By Manufacturing Type

        15.5.4. By Application

    15.6. Key Market Participants - Intensity Mapping

16. Eastern Europe Market Analysis 2018 to 2022 and Forecast 2023 to 2033

    16.1. Introduction

    16.2. Pricing Analysis

    16.3. Historical Market Size (US$ million) and Volume Trend Analysis By Market Taxonomy, 2018 to 2022

    16.4. Market Size (US$ million) and Volume Forecast By Market Taxonomy, 2023 to 2033

        16.4.1. By Country

            16.4.1.1. Poland

            16.4.1.2. Hungary

            16.4.1.3. Romania

            16.4.1.4. Czech Republic

            16.4.1.5. Others

        16.4.2. By Product Type

        16.4.3. By Manufacturing Type

        16.4.4. By Application

    16.5. Market Attractiveness Analysis

        16.5.1. By Country

        16.5.2. By Product Type

        16.5.3. By Manufacturing Type

        16.5.4. By Application

    16.6. Key Market Participants - Intensity Mapping

17. Central Asia Market Analysis 2018 to 2022 and Forecast 2023 to 2033

    17.1. Introduction

    17.2. Pricing Analysis

    17.3. Historical Market Size (US$ million) and Volume Trend Analysis By Market Taxonomy, 2018 to 2022

    17.4. Market Size (US$ million) and Volume Forecast By Market Taxonomy, 2023 to 2033

        17.4.1. By Country

        17.4.2. By Product Type

        17.4.3. By Manufacturing Type

        17.4.4. By Application

    17.5. Market Attractiveness Analysis

        17.5.1. By Country

        17.5.2. By Product Type

        17.5.3. By Manufacturing Type

        17.5.4. By Application

    17.6. Key Market Participants - Intensity Mapping

18. Russia and Belarus Market Analysis 2018 to 2022 and Forecast 2023 to 2033

    18.1. Introduction

    18.2. Pricing Analysis

    18.3. Historical Market Size (US$ million) and Volume Trend Analysis By Market Taxonomy, 2018 to 2022

    18.4. Market Size (US$ million) and Volume Forecast By Market Taxonomy, 2023 to 2033

        18.4.1. By Country

        18.4.2. By Product Type

        18.4.3. By Manufacturing Type

        18.4.4. By Application

    18.5. Market Attractiveness Analysis

        18.5.1. By Country

        18.5.2. By Product Type

        18.5.3. By Manufacturing Type

        18.5.4. By Application

    18.6. Key Market Participants - Intensity Mapping

19. Balkan & Baltic Countries Market Analysis 2018 to 2022 and Forecast 2023 to 2033

    19.1. Introduction

    19.2. Pricing Analysis

    19.3. Historical Market Size (US$ million) and Volume Trend Analysis By Market Taxonomy, 2018 to 2022

    19.4. Market Size (US$ million) and Volume Forecast By Market Taxonomy, 2023 to 2033

        19.4.1. By Country

        19.4.2. By Product Type

        19.4.3. By Manufacturing Type

        19.4.4. By Application

    19.5. Market Attractiveness Analysis

        19.5.1. By Country

        19.5.2. By Product Type

        19.5.3. By Manufacturing Type

        19.5.4. By Application

20. East Asia Market Analysis 2018 to 2022 and Forecast 2023 to 2033

    20.1. Introduction

    20.2. Pricing Analysis

    20.3. Historical Market Size (US$ million) and Volume Trend Analysis By Market Taxonomy, 2018 to 2022

    20.4. Market Size (US$ million) and Volume Forecast By Market Taxonomy, 2023 to 2033

        20.4.1. By Country

            20.4.1.1. China

            20.4.1.2. Japan

            20.4.1.3. South Korea

        20.4.2. By Product Type

        20.4.3. By Manufacturing Type

        20.4.4. By Application

    20.5. Market Attractiveness Analysis

        20.5.1. By Country

        20.5.2. By Product Type

        20.5.3. By Manufacturing Type

        20.5.4. By Application

    20.6. Key Market Participants - Intensity Mapping

21. South Asia and Pacific Market Analysis 2018 to 2022 and Forecast 2023 to 2033

    21.1. Introduction

    21.2. Pricing Analysis

    21.3. Historical Market Size (US$ million) and Volume Trend Analysis By Market Taxonomy, 2018 to 2022

    21.4. Market Size (US$ million) and Volume Forecast By Market Taxonomy, 2023 to 2033

        21.4.1. By Country

            21.4.1.1. India

            21.4.1.2. Association of Southeast Asian Nations

            21.4.1.3. Australia and New Zealand

        21.4.2. By Product Type

        21.4.3. By Manufacturing Type

        21.4.4. By Application

    21.5. Market Attractiveness Analysis

        21.5.1. By Country

        21.5.2. By Product Type

        21.5.3. By Manufacturing Type

        21.5.4. By Application

    21.6. Key Market Participants - Intensity Mapping

22. Middle East and Africa Market Analysis 2018 to 2022 and Forecast 2023 to 2033

    22.1. Introduction

    22.2. Pricing Analysis

    22.3. Historical Market Size (US$ million) and Volume Trend Analysis By Market Taxonomy, 2018 to 2022

    22.4. Market Size (US$ million) and Volume Forecast By Market Taxonomy, 2023 to 2033

        22.4.1. By Country

            22.4.1.1. Kingdom of Saudi Arabia

            22.4.1.2. United Arab Emirates

            22.4.1.3. Türkiye

            22.4.1.4. Northern Africa

            22.4.1.5. South Africa

            22.4.1.6. Israel

        22.4.2. By Product Type

        22.4.3. By Manufacturing Type

        22.4.4. By Application

    22.5. Market Attractiveness Analysis

        22.5.1. By Country

        22.5.2. By Product Type

        22.5.3. By Manufacturing Type

        22.5.4. By Application

    22.6. Key Market Participants - Intensity Mapping

23. Country Wise Market Analysis

    23.1. United States Market Analysis

        23.1.1. By Product Type

        23.1.2. By Manufacturing Type

        23.1.3. By Application

    23.2. Canada Market Analysis

        23.2.1. By Product Type

        23.2.2. By Manufacturing Type

        23.2.3. By Application

    23.3. Mexico Market Analysis

        23.3.1. By Product Type

        23.3.2. By Manufacturing Type

        23.3.3. By Application

    23.4. Brazil Market Analysis

        23.4.1. By Product Type

        23.4.2. By Manufacturing Type

        23.4.3. By Application

    23.5. Argentina Market Analysis

        23.5.1. By Product Type

        23.5.2. By Manufacturing Type

        23.5.3. By Application

    23.6. China Market Analysis

        23.6.1. By Product Type

        23.6.2. By Manufacturing Type

        23.6.3. By Application

    23.7. Japan Market Analysis

        23.7.1. By Product Type

        23.7.2. By Manufacturing Type

        23.7.3. By Application

    23.8. South Korea Market Analysis

        23.8.1. By Product Type

        23.8.2. By Manufacturing Type

        23.8.3. By Application

    23.9. India Market Analysis

        23.9.1. By Product Type

        23.9.2. By Manufacturing Type

        23.9.3. By Application

    23.10. Association of Southeast Asian Nations Market Analysis

        23.10.1. By Product Type

        23.10.2. By Manufacturing Type

        23.10.3. By Application

    23.11. Australia and New Zealand Market Analysis

        23.11.1. By Product Type

        23.11.2. By Manufacturing Type

        23.11.3. By Application

    23.12. Germany Market Analysis

        23.12.1. By Product Type

        23.12.2. By Manufacturing Type

        23.12.3. By Application

    23.13. Italy Market Analysis

        23.13.1. By Product Type

        23.13.2. By Manufacturing Type

        23.13.3. By Application

    23.14. France Market Analysis

        23.14.1. By Product Type

        23.14.2. By Manufacturing Type

        23.14.3. By Application

    23.15. United Kingdom Market Analysis

        23.15.1. By Product Type

        23.15.2. By Manufacturing Type

        23.15.3. By Application

    23.16. Spain Market Analysis

        23.16.1. By Product Type

        23.16.2. By Manufacturing Type

        23.16.3. By Application

    23.17. BENELUX Market Analysis

        23.17.1. By Product Type

        23.17.2. By Manufacturing Type

        23.17.3. By Application

    23.18. NORDICS Market Analysis

        23.18.1. By Product Type

        23.18.2. By Manufacturing Type

        23.18.3. By Application

    23.19. Poland Market Analysis

        23.19.1. By Product Type

        23.19.2. By Manufacturing Type

        23.19.3. By Application

    23.20. Hungary Market Analysis

        23.20.1. By Product Type

        23.20.2. By Manufacturing Type

        23.20.3. By Application

    23.21. Romania Market Analysis

        23.21.1. By Product Type

        23.21.2. By Manufacturing Type

        23.21.3. By Application

    23.22. Czech Republic Market Analysis

        23.22.1. By Product Type

        23.22.2. By Manufacturing Type

        23.22.3. By Application

    23.23. Kingdom of Saudi Arabia Market Analysis

        23.23.1. By Product Type

        23.23.2. By Manufacturing Type

        23.23.3. By Application

    23.24. United Arab Emirates Market Analysis

        23.24.1. By Product Type

        23.24.2. By Manufacturing Type

        23.24.3. By Application

    23.25. Türkiye Market Analysis

        23.25.1. By Product Type

        23.25.2. By Manufacturing Type

        23.25.3. By Application

    23.26. Northern Africa Market Analysis

        23.26.1. By Product Type

        23.26.2. By Manufacturing Type

        23.26.3. By Application

    23.27. South Africa Market Analysis

        23.27.1. By Product Type

        23.27.2. By Manufacturing Type

        23.27.3. By Application

    23.28. Israel Market Analysis

        23.28.1. By Product Type

        23.28.2. By Manufacturing Type

        23.28.3. By Application

24. Market Structure Analysis

    24.1. Market Analysis by Tier of Companies

    24.2. Market Share Analysis of Top Players

    24.3. Market Presence Analysis

25. Competition Analysis

    25.1. Competition Dashboard

    25.2. Competition Benchmarking

    25.3. Competition Deep Dive

        25.3.1. Albemarle Corporation

            25.3.1.1. Overview

            25.3.1.2. Material Portfolio

            25.3.1.3. Profitability by Market Segments (Material/Channel/Region)

            25.3.1.4. Sales Footprint

            25.3.1.5. Strategy Overview

        25.3.2. Lanxess AG

            25.3.2.1. Overview

            25.3.2.2. Material Portfolio

            25.3.2.3. Profitability by Market Segments (Material/Channel/Region)

            25.3.2.4. Sales Footprint

            25.3.2.5. Strategy Overview

        25.3.3. Huntsman International LLC

            25.3.3.1. Overview

            25.3.3.2. Material Portfolio

            25.3.3.3. Profitability by Market Segments (Material/Channel/Region)

            25.3.3.4. Sales Footprint

            25.3.3.5. Strategy Overview

        25.3.4. BASF SE

            25.3.4.1. Overview

            25.3.4.2. Material Portfolio

            25.3.4.3. Profitability by Market Segments (Material/Channel/Region)

            25.3.4.4. Sales Footprint

            25.3.4.5. Strategy Overview

        25.3.5. Nouryon

            25.3.5.1. Overview

            25.3.5.2. Material Portfolio

            25.3.5.3. Profitability by Market Segments (Material/Channel/Region)

            25.3.5.4. Sales Footprint

            25.3.5.5. Strategy Overview

        25.3.6. WeylChem International GmbH

            25.3.6.1. Overview

            25.3.6.2. Material Portfolio

            25.3.6.3. Profitability by Market Segments (Material/Channel/Region)

            25.3.6.4. Sales Footprint

            25.3.6.5. Strategy Overview

        25.3.7. CHEMADA Industries Ltd

            25.3.7.1. Overview

            25.3.7.2. Material Portfolio

            25.3.7.3. Profitability by Market Segments (Material/Channel/Region)

            25.3.7.4. Sales Footprint

            25.3.7.5. Strategy Overview

        25.3.8. Syntor Ltd

            25.3.8.1. Overview

            25.3.8.2. Material Portfolio

            25.3.8.3. Profitability by Market Segments (Material/Channel/Region)

            25.3.8.4. Sales Footprint

            25.3.8.5. Strategy Overview

        25.3.9. Boehringer Ingelheim International GmbH

            25.3.9.1. Overview

            25.3.9.2. Material Portfolio

            25.3.9.3. Profitability by Market Segments (Material/Channel/Region)

            25.3.9.4. Sales Footprint

            25.3.9.5. Strategy Overview

        25.3.10. Lonza Group Ltd

            25.3.10.1. Overview

            25.3.10.2. Material Portfolio

            25.3.10.3. Profitability by Market Segments (Material/Channel/Region)

            25.3.10.4. Sales Footprint

            25.3.10.5. Strategy Overview

        25.3.11. Evonik Industries AG

            25.3.11.1. Overview

            25.3.11.2. Material Portfolio

            25.3.11.3. Profitability by Market Segments (Material/Channel/Region)

            25.3.11.4. Sales Footprint

            25.3.11.5. Strategy Overview

        25.3.12. Clariant AG

            25.3.12.1. Overview

            25.3.12.2. Material Portfolio

            25.3.12.3. Profitability by Market Segments (Material/Channel/Region)

            25.3.12.4. Sales Footprint

            25.3.12.5. Strategy Overview

        25.3.13. Bayer AG

            25.3.13.1. Overview

            25.3.13.2. Material Portfolio

            25.3.13.3. Profitability by Market Segments (Material/Channel/Region)

            25.3.13.4. Sales Footprint

            25.3.13.5. Strategy Overview

        25.3.14. Merck & Co, Inc

            25.3.14.1. Overview

            25.3.14.2. Material Portfolio

            25.3.14.3. Profitability by Market Segments (Material/Channel/Region)

            25.3.14.4. Sales Footprint

            25.3.14.5. Strategy Overview

        25.3.15. Sumitomo Chemicals

            25.3.15.1. Overview

            25.3.15.2. Material Portfolio

            25.3.15.3. Profitability by Market Segments (Material/Channel/Region)

            25.3.15.4. Sales Footprint

            25.3.15.5. Strategy Overview

        25.3.16. GlaxoSmithKline plc

            25.3.16.1. Overview

            25.3.16.2. Material Portfolio

            25.3.16.3. Profitability by Market Segments (Material/Channel/Region)

            25.3.16.4. Sales Footprint

            25.3.16.5. Strategy Overview

        25.3.17. Pfizer Inc

            25.3.17.1. Overview

            25.3.17.2. Material Portfolio

            25.3.17.3. Profitability by Market Segments (Material/Channel/Region)

            25.3.17.4. Sales Footprint

            25.3.17.5. Strategy Overview

        25.3.18. Johnson Matthey

            25.3.18.1. Overview

            25.3.18.2. Material Portfolio

            25.3.18.3. Profitability by Market Segments (Material/Channel/Region)

            25.3.18.4. Sales Footprint

            25.3.18.5. Strategy Overview

        25.3.19. Novartis International AG

            25.3.19.1. Overview

            25.3.19.2. Material Portfolio

            25.3.19.3. Profitability by Market Segments (Material/Channel/Region)

            25.3.19.4. Sales Footprint

            25.3.19.5. Strategy Overview

        25.3.20. Toray Co, Ltd.

            25.3.20.1. Overview

            25.3.20.2. Material Portfolio

            25.3.20.3. Profitability by Market Segments (Material/Channel/Region)

            25.3.20.4. Sales Footprint

            25.3.20.5. Strategy Overview

26. Assumptions and Acronyms Used

27. Research Methodology

Don't pay for what you don't need

Customize your report by selecting specific countries or regions and save 30%!

List of Tables

Table 01: Global Market Size (US$ million) Analysis and Forecast By Product Type, 2023 to 2033

Table 02: Global Market Size (US$ million) Analysis and Forecast By Product Type, 2023 to 2033

Table 03: Global Market Size (US$ million) Analysis By Product Type, 2018 to 2033

Table 04: Global Market Size (US$ million) Analysis and Forecast By Product Type, 2023 to 2033

Table 05: Global Market Size Volume (tons) Analysis By Product Type, 2018 to 2022

Table 06: Global Market Volume (tons) Analysis and Forecast By Product Type, 2023 to 2033

Table 07: Global Market Volume (tons) Analysis By Product Type, 2018 to 2022

Table 08: Global Market Volume (tons) Analysis and Forecast By Product Type, 2023 to 2033

Table 09: Global Market Size (US$ million) and Volume (tons) Analysis By Manufacturing Type, 2018 to 2022

Table 10: Global Market Size (US$ million) and Volume (tons) Analysis and Forecast By Manufacturing Type, 2023 to 2033

Table 11: Global Market Size (US$ million) Analysis By Application, 2018 to 2022

Table 12: Global Market Size (US$ million) Analysis and Forecast By Application, 2023 to 2033

Table 13: Global Market Volume (tons) Analysis and Forecast By Application, 2018 to 2022

Table 14: Global Market Volume (tons) Analysis and Forecast By Application, 2023 to 2033

Table 15: Global Market Size Volume (tons) Analysis and Forecast By Region, 2018-2033

Table 16: Global Market Size Volume (tons) Analysis and Forecast By Region, 2018-2033

Table 17: Global Market Size(US$ million) Analysis and Forecast By Region, 2018-2033

Table 18: Global Market Size(US$ million) Analysis and Forecast By Region, 2018-2033

Table 19: North America Market Size (US$ million) and Volume (tons) Analysis and Forecast By Country, 2018-2033

Table 20: North America Market Size (US$ million) and Volume (tons) Analysis and Forecast By Country, 2018-2033

Table 21: North America Market Size (US$ million) Analysis By Product Type, 2018 to 2022

Table 22: North America Market Volume (tons) Analysis and Forecast By Product Type, 2023 to 2033

Table 23: North America Market Volume (tons) Analysis By Product Type, 2018 to 2033

Table 24: North America Market Volume (tons) Analysis and Forecast By Product Type, 2023 to 2033

Table 25: North America Market Size (US$ million) Analysis By Product Type, 2018 to 2022

Table 26: North America Market Size (US$ million) Analysis and Forecast By Product Type, 2023 to 2033

Table 27: North America Market Size (US$ million) Analysis By Product Type, 2018 to 2022

Table 28: North America Market Size (US$ million) Analysis and Forecast By Product Type, 2023 to 2033

Table 29: North America Market Size (US$ million) and Volume (tons) Analysis By Manufacturing Type, 2018 to 2022

Table 30: North America Market Size (US$ million) and Volume (tons) Analysis and Forecast By Manufacturing Type, 2023 to 2033

Table 31: North America Market Size (US$ million) Analysis By Application, 2018 to 2022

Table 32: North America Market Size (US$ million) Analysis and Forecast By Application, 2023 to 2033

Table 33: North America Market Volume (tons) Analysis and Forecast By Application, 2018 to 2022

Table 34: North America Market Volume (tons) Analysis and Forecast By Application, 2023 to 2033

Table 35: Latin America Market Size (US$ million) and Volume (tons) Analysis and Forecast By Country, 2018-2033

Table 36: Latin America Market Size (US$ million) and Volume (tons) Analysis and Forecast By Country, 2018-2033

Table 37: Latin America Market Size (US$ million) Analysis By Product Type, 2018 to 2022

Table 38: Latin America Market Size (US$ million) Analysis and Forecast By Product Type, 2023 to 2033

Table 39: Latin America Market Size (US$ million) Analysis By Product Type, 2018 to 2033

Table 40: Latin America Market Size (US$ million) Analysis and Forecast By Product Type, 2023 to 2033

Table 41: Latin America Market Size Volume (tons) Analysis By Product Type, 2018 to 2022

Table 42: Latin America Market Volume (tons) Analysis and Forecast By Product Type, 2023 to 2033

Table 43: Latin America Market Volume (tons) Analysis By Product Type, 2018 to 2022

Table 44: Latin America Market Volume (tons) Analysis and Forecast By Product Type, 2023 to 2033

Table 45: Latin America Market Size (US$ million) and Volume (tons) Analysis By Manufacturing Type, 2018 to 2022

Table 46: Latin America Market Size (US$ million) and Volume (tons) Analysis and Forecast By Manufacturing Type, 2023 to 2033

Table 47: Latin America Market Size (US$ million) Analysis By Application, 2018 to 2022

Table 48: Latin America Market Size (US$ million) Analysis and Forecast By Application, 2023 to 2033

Table 49: Latin America Market Volume (tons) Analysis and Forecast By Application, 2018 to 2022

Table 50: Latin America Market Volume (tons) Analysis and Forecast By Application, 2023 to 2033

Table 51: Western Europe Market Size Volume (tons) Analysis By Country, 2018 to 2022

Table 52: Western Europe Market Size Volume (tons) Analysis and Forecast By Country, 2023 to 2033

Table 53: Western Europe Market Size (US$ million) Analysis and Forecast By Country, 2018 to 2022

Table 54: Western Europe Market Size (US$ million) Analysis and Forecast By Country, 2018-2033

Table 55: Western Europe Market Size (US$ million) Analysis By Product Type, 2018 to 2022

Table 56: Western Europe Market Size (US$ million) Analysis and Forecast By Product Type, 2023 to 2033

Table 57: Western Europe Market Size (US$ million) Analysis By Product Type, 2018 to 2033

Table 58: Western Europe Market Size (US$ million) Analysis and Forecast By Product Type, 2023 to 2033

Table 59: Western Europe Market Size Volume (tons) Analysis By Product Type, 2018 to 2022

Table 60: Western Europe Market Volume (tons) Analysis and Forecast By Product Type, 2023 to 2033

Table 61: Western Europe Market Volume (tons) Analysis By Product Type, 2018 to 2022

Table 62: Western Europe Market Volume (tons) Analysis and Forecast By Product Type, 2023 to 2033

Table 63: Western Europe Market Size (US$ million) and Volume (tons) Analysis By Manufacturing Type, 2018 to 2022

Table 64: Western Europe Market Size (US$ million) and Volume (tons) Analysis and Forecast By Manufacturing Type, 2023 to 2033

Table 65: Western Europe Market Size (US$ million) Analysis By Application, 2018 to 2022

Table 66: Western Europe Market Size (US$ million) Analysis and Forecast By Application, 2023 to 2033

Table 67: Western Europe Market Volume (tons) Analysis and Forecast By Application, 2018 to 2022

Table 68: Western Europe Market Volume (tons) Analysis and Forecast By Application, 2023 to 2033

Table 69: Eastern Europe Market Volume (tons) and Value (US$ million) Historical Data 2018 to 2022 By Country

Table 70: Eastern Europe Market Volume (tons) and Value (US$ million) Forecast 2023 to 2033 By Country

Table 71: Eastern Europe Market Size (US$ million) Analysis By Product Type, 2018 to 2022

Table 72: Eastern Europe Market Size (US$ million) Analysis and Forecast By Product Type, 2023 to 2033

Table 73: Eastern Europe Market Size (US$ million) Analysis By Product Type, 2018 to 2033

Table 74: Eastern Europe Market Size (US$ million) Analysis and Forecast By Product Type, 2023 to 2033

Table 75: Eastern Europe Market Size Volume (tons) Analysis By Product Type, 2018 to 2022

Table 76:Eastern Europe Market Volume (tons) Analysis and Forecast By Product Type, 2023 to 2033

Table 77: Eastern Europe Market Volume (tons) Analysis By Product Type, 2018 to 2022

Table 78: Eastern Europe Market Volume (tons) Analysis and Forecast By Product Type, 2023 to 2033

Table 79: Eastern Europe Market Size (US$ million) and Volume (tons) Analysis By Manufacturing Type, 2018 to 2022

Table 80: Eastern Europe Market Size (US$ million) and Volume (tons) Analysis and Forecast By Manufacturing Type, 2023 to 2033

Table 81: Eastern Europe Market Size (US$ million) Analysis By Application, 2018 to 2022

Table 82: Eastern Europe Market Size (US$ million) Analysis and Forecast By Application, 2023 to 2033

Table 83: Eastern Europe Market Volume (tons) Analysis and Forecast By Application, 2018 to 2022

Table 84: Eastern Europe Market Volume (tons) Analysis and Forecast By Application, 2023 to 2033

Table 85: Central Asia Market Size (US$ million) Analysis By Product Type, 2018 to 2022

Table 86: Central Asia Market Size (US$ million) Analysis and Forecast By Product Type, 2023 to 2033

Table 87: Central Asia Market Size (US$ million) Analysis By Product Type, 2018 to 2033

Table 88: Central Asia Market Size (US$ million) Analysis and Forecast By Product Type, 2023 to 2033

Table 89: Central Asia Market Size Volume (tons) Analysis By Product Type, 2018 to 2022

Table 90: Central Asia Market Volume (tons) Analysis and Forecast By Product Type, 2023 to 2033

Table 91: Central Asia Market Volume (tons) Analysis By Product Type, 2018 to 2022

Table 92: Central Asia Market Volume (tons) Analysis and Forecast By Product Type, 2023 to 2033

Table 93: Central Asia Market Size (US$ million) and Volume (tons) Analysis By Manufacturing Type, 2018 to 2022

Table 94: Central Asia Market Size (US$ million) and Volume (tons) Analysis and Forecast By Manufacturing Type, 2023 to 2033

Table 95: Central Asia Market Size (US$ million) Analysis By Application, 2018 to 2022

Table 96: Central Asia Market Size (US$ million) Analysis and Forecast By Application, 2023 to 2033

Table 97: Central Asia Market Volume (tons) Analysis and Forecast By Application, 2018 to 2022

Table 98: Central Asia Market Volume (tons) Analysis and Forecast By Application, 2023 to 2033

Table 99: Russia & Belarus Market Size (US$ million) Analysis By Product Type, 2018 to 2022

Table 100: Russia & Belarus Market Size (US$ million) Analysis and Forecast By Product Type, 2023 to 2033

Table 101: Russia & Belarus Market Size (US$ million) Analysis By Product Type, 2018 to 2033

Table 102: Russia & Belarus Market Size (US$ million) Analysis and Forecast By Product Type, 2023 to 2033

Table 103: Russia & Belarus Market Size Volume (tons) Analysis By Product Type, 2018 to 2022

Table 104: Russia & Belarus Market Volume (tons) Analysis and Forecast By Product Type, 2023 to 2033

Table 105: Russia & Belarus Market Volume (tons) Analysis By Product Type, 2018 to 2022

Table 106: Russia & Belarus Market Volume (tons) Analysis and Forecast By Product Type, 2023 to 2033

Table 107: Russia & Belarus Market Size (US$ million) and Volume (tons) Analysis By Manufacturing Type, 2018 to 2022

Table 108: Russia & Belarus Market Size (US$ million) and Volume (tons) Analysis and Forecast By Manufacturing Type, 2023 to 2033

Table 109: Russia & Belarus Market Size (US$ million) Analysis By Application, 2018 to 2022

Table 110: Russia & Belarus Market Size (US$ million) Analysis and Forecast By Application, 2023 to 2033

Table 111: Russia & Belarus Market Volume (tons) Analysis and Forecast By Application, 2018 to 2022

Table 112: Russia & Belarus Market Volume (tons) Analysis and Forecast By Application, 2023 to 2033

Table 113: Balkan & Baltic Countries Chemicals Market Size (US$ million) Analysis By Product Type, 2018 to 2022

Table 114: Balkan & Baltic Countries Chemicals Market Size (US$ million) Analysis and Forecast By Product Type, 2023 to 2033

Table 115: Balkan & Baltic Countries Chemicals Market Size (US$ million) Analysis By Product Type, 2018 to 2033

Table 116: Balkan & Baltic Countries Chemicals Market Size (US$ million) Analysis and Forecast By Product Type, 2023 to 2033

Table 117: Balkan & Baltic Countries Chemicals Market Size Volume (tons) Analysis By Product Type, 2018 to 2022

Table 118: Balkan & Baltic Countries Chemicals Market Volume (tons) Analysis and Forecast By Product Type, 2023 to 2033

Table 119: Balkan & Baltic Countries Chemicals Market Volume (tons) Analysis By Product Type, 2018 to 2022

Table 120: Balkan & Baltic Countries Chemicals Market Volume (tons) Analysis and Forecast By Product Type, 2023 to 2033

Table 121: Balkan & Baltic Countries Chemicals Market Size (US$ million) and Volume (tons) Analysis By Manufacturing Type, 2018 to 2022

Table 122: Balkan & Baltic Countries Chemicals Market Size (US$ million) and Volume (tons) Analysis and Forecast By Manufacturing Type, 2023 to 2033

Table 123: Balkan & Baltic Countries Chemicals Market Size (US$ million) Analysis By Application, 2018 to 2022

Table 124: Balkan & Baltic Countries Chemicals Market Size (US$ million) Analysis and Forecast By Application, 2023 to 2033

Table 125: Balkan & Baltic Countries Chemicals Market Volume (tons) Analysis and Forecast By Application, 2018 to 2022

Table 126: Balkan & Baltic Countries Chemicals Market Volume (tons) Analysis and Forecast By Application, 2023 to 2033

Table 127: East Asia Market Size (US$ million) and Volume (tons) Analysis By Country, 2018 to 2022

Table 128: East Asia Market Size (US$ million) and Volume (tons) Analysis and Forecast By Country, 2023 to 2033

Table 129: East Asia Market Size (US$ million) Analysis By Product Type, 2018 to 2022

Table 130: East Asia Market Size (US$ million) Analysis and Forecast By Product Type, 2023 to 2033

Table 131: East Asia Market Size (US$ million) Analysis By Product Type, 2018 to 2033

Table 132: East Asia Market Size (US$ million) Analysis and Forecast By Product Type, 2023 to 2033

Table 133: East Asia Market Size Volume (tons) Analysis By Product Type, 2018 to 2022

Table 134: East Asia Market Volume (tons) Analysis and Forecast By Product Type, 2023 to 2033

Table 135: East Asia Market Volume (tons) Analysis By Product Type, 2018 to 2022

Table 136: East Asia Market Volume (tons) Analysis and Forecast By Product Type, 2023 to 2033

Table 137: East Asia Market Size (US$ million) and Volume (tons) Analysis By Manufacturing Type, 2018 to 2022

Table 138: East Asia Market Size (US$ million) and Volume (tons) Analysis and Forecast By Manufacturing Type, 2023 to 2033

Table 139: East Asia Market Size (US$ million) Analysis By Application, 2018 to 2022

Table 140: East Asia Market Size (US$ million) Analysis and Forecast By Application, 2023 to 2033

Table 141: East Asia Market Volume (tons) Analysis and Forecast By Application, 2018 to 2022

Table 142: East Asia Market Volume (tons) Analysis and Forecast By Application, 2023 to 2033

Table 143: South Asia and Pacific Market Size (US$ million) and Volume (tons) Historical By Country, 2018-2033

Table 144: South Asia and Pacific Market Size (US$ million) and Volume (tons) Analysis and Forecast By Country, 2023 to 2033

Table 145: South Asia and Pacific Market Size (US$ million) Analysis By Product Type, 2018 to 2022

Table 146: South Asia and Pacific Market Size (US$ million) Analysis and Forecast By Product Type, 2023 to 2033

Table 147: South Asia and Pacific Market Size (US$ million) Analysis By Product Type, 2018 to 2033

Table 148: South Asia and Pacific Market Size (US$ million) Analysis and Forecast By Product Type, 2023 to 2033

Table 149: South Asia and Pacific Market Size Volume (tons) Analysis By Product Type, 2018 to 2022

Table 150: South Asia and Pacific Market Volume (tons) Analysis and Forecast By Product Type, 2023 to 2033

Table 151: South Asia and Pacific Market Volume (tons) Analysis By Product Type, 2018 to 2022

Table 152: South Asia and Pacific Market Volume (tons) Analysis and Forecast By Product Type, 2023 to 2033

Table 153: South Asia and Pacific Market Size (US$ million) and Volume (tons) Analysis By Manufacturing Type, 2018 to 2022

Table 154: South Asia and Pacific Market Size (US$ million) and Volume (tons) Analysis and Forecast By Manufacturing Type, 2023 to 2033

Table 155: South Asia and Pacific Market Size (US$ million) Analysis By Application, 2018 to 2022

Table 156: South Asia and Pacific Market Size (US$ million) Analysis and Forecast By Application, 2023 to 2033

Table 157: South Asia and Pacific Market Volume (tons) Analysis and Forecast By Application, 2018 to 2022

Table 158: South Asia and Pacific Market Volume (tons) Analysis and Forecast By Application, 2023 to 2033

Table 159: Middle East and Africa Market Size (US$ million) and Volume (tons) Historical Analysis By Country, 2018 to 2022

Table 160: Middle East and Africa Market Size (US$ million) and Volume (tons) Analysis and Forecast By Country, 2023 to 2033

Table 161: Middle East and Africa Market Size (US$ million) Analysis By Product Type, 2018 to 2022

Table 162: Middle East and Africa Market Size (US$ million) Analysis and Forecast By Product Type, 2023 to 2033

Table 163: Middle East and Africa Market Size (US$ million) Analysis By Product Type, 2018 to 2033

Table 164: Middle East and Africa Market Size (US$ million) Analysis and Forecast By Product Type, 2023 to 2033

Table 165: Middle East and Africa Market Size Volume (tons) Analysis By Product Type, 2018 to 2022

Table 166: Middle East and Africa Market Volume (tons) Analysis and Forecast By Product Type, 2023 to 2033

Table 167: Middle East and Africa Market Volume (tons) Analysis By Product Type, 2018 to 2022

Table 168: Middle East and Africa Market Volume (tons) Analysis and Forecast By Product Type, 2023 to 2033

Table 169: Middle East and Africa Market Size (US$ million) and Volume (tons) Analysis By Manufacturing Type, 2018 to 2022

Table 170: Middle East and Africa Market Size (US$ million) and Volume (tons) Analysis and Forecast By Manufacturing Type, 2023 to 2033

Table 171: Middle East and Africa Market Size (US$ million) Analysis By Application, 2018 to 2022

Table 172: Middle East and Africa Market Size (US$ million) Analysis and Forecast By Application, 2023 to 2033

Table 173: Middle East and Africa Market Volume (tons) Analysis and Forecast By Application, 2018 to 2022

Table 174: Middle East and Africa Market Volume (tons) Analysis and Forecast By Application, 2023 to 2033
Nikhil Kaitwade
Nikhil Kaitwade

Principal Consultant

Talk to Analyst

Find your sweet spots for generating winning opportunities in this market.

List of Charts

Figure 01: Global Market Historical Volume (tons), 2018 to 2022

Figure 02: Global Market Current and Forecast Volume (tons), 2023 to 2033

Figure 03: Global Market Historical Value (US$ million), 2018 to 2022

Figure 04: Global Market Current and Forecast Value (US$ million), 2023 to 2033

Figure 05: Global Market Incremental $ Opportunity (US$ million), 2023 to 2033

Figure 06: Global Market Share and BPS Analysis By Product Type, 2023 & 2033

Figure 07: Global Market Y-o-Y Growth Projections By Product Type, 2023 to 2033

Figure 08: Global Market Attractiveness Analysis By Product Type, 2023 to 2033

Figure 09: Global Market Absolute $ Opportunity by Pharmaceuticals Segment, 2018 to 2033

Figure 10: Global Market Absolute $ Opportunity by Agrochemicals Segment, 2018 to 2033

Figure 11: Global Market Absolute $ Opportunity by Construction Chemicals Segment, 2018 to 2033

Figure 12: Global Market Absolute $ Opportunity by Additives Segment, 2018 to 2033

Figure 13: Global Market Absolute $ Opportunity by Specialty Polymers Segment, 2018 to 2033

Figure 14: Global Market Absolute $ Opportunity by Pigments & Dyes Segment, 2018 to 2033

Figure 15: Global Market Absolute $ Opportunity by Flavors & Fragrance Ingredients Segment, 2018 to 2033

Figure 16: Global Market Absolute $ Opportunity by Water Treatment Chemicals Segment, 2018 to 2033

Figure 17: Global Market Absolute $ Opportunity by Surfactants Segment, 2018 to 2033

Figure 18: Global Market Absolute $ Opportunity by Others Segment, 2018 to 2033

Figure 19: Global Market Share and BPS Analysis By Manufacturing Type, 2023 & 2033

Figure 20: Global Market Y-o-Y Growth Projections By Manufacturing Type, 2023 to 2033

Figure 21: Global Market Attractiveness Analysis By Manufacturing Type, 2023 to 2033

Figure 22: Global Market Absolute $ Opportunity by Captive Segment, 2018 to 2033

Figure 23: Global Market Absolute $ Opportunity by Merchant Segment, 2018 to 2033

Figure 24: Global Market Share and BPS Analysis By Application, 2023 & 2033

Figure 25: Global Market Y-o-Y Growth Projections By Application, 2023 to 2033

Figure 26: Global Market Attractiveness Analysis By Application, 2023 to 2033

Figure 27: Global Market Absolute $ Opportunity by Pharmaceuticals & Nutraceuticals Segment, 2018 to 2033

Figure 28: Global Market Absolute $ Opportunity by Agriculture Industry Segment, 2018 to 2033

Figure 29: Global Market Absolute $ Opportunity by Cosmetics & Personal Care Segment, 2018 to 2033

Figure 30: Global Market Absolute $ Opportunity by Petrochemicals & Plastic Industry Segment, 2018 to 2033

Figure 31: Global Market Absolute $ Opportunity by Food & Beverages Segment, 2018 to 2033

Figure 32: Global Market Absolute $ Opportunity by Electronics Segment, 2018 to 2033

Figure 33: Global Market Absolute $ Opportunity by Paints & Coatings Segment, 2018 to 2033

Figure 34: Global Market Absolute $ Opportunity by Building & Construction Segment, 2018 to 2033

Figure 35: Global Market Absolute $ Opportunity by Lubricants & Oil Segment, 2018 to 2033

Figure 36: Global Market Absolute $ Opportunity by Textiles Segment, 2018 to 2033

Figure 37: Global Market Absolute $ Opportunity by Others Segment, 2018 to 2033

Figure 38: Global Market Share and BPS Analysis By Region, 2023 & 2033

Figure 39: Global Market Y-o-Y Growth Projections By Region, 2023 to 2033

Figure 40: Global Market Attractiveness Analysis By Region, 2023 to 2033

Figure 41: Global Market Absolute $ Opportunity by North America Segment, 2018 to 2033

Figure 42: Global Market Absolute $ Opportunity by Latin America Segment, 2018 to 2033

Figure 43: Global Market Absolute $ Opportunity by Cosmetics & Western Europe Segment, 2018 to 2033

Figure 44: Global Market Absolute $ Opportunity by Eastern Europe Segment, 2018 to 2033

Figure 45: Global Market Absolute $ Opportunity by Central Asia Segment, 2018 to 2033

Figure 46: Global Market Absolute $ Opportunity by Russia & Belarus Segment, 2018 to 2033

Figure 47: Global Market Absolute $ Opportunity by Balkan & Baltics Segment, 2018 to 2033

Figure 48: Global Market Absolute $ Opportunity by East Asia Segment, 2018 to 2033

Figure 49: Global Market Absolute $ Opportunity by South Asia Pacific Segment, 2018 to 2033

Figure 50: Global Market Absolute $ Opportunity by Middle East Africa Segment, 2018 to 2033

Figure 51: North America Market Share and BPS Analysis By Country, 2023 & 2033

Figure 52: North America Market Y-o-Y Growth Projections By Country, 2023 to 2033

Figure 53: North America Market Attractiveness Analysis By Country, 2023 to 2033

Figure 54: North America Market Share and BPS Analysis By Product Type, 2023 & 2033

Figure 55: North America Market Y-o-Y Growth Projections By Product Type, 2023 to 2033

Figure 56: North America Market Attractiveness Analysis By Product Type, 2023 to 2033

Figure 57: North America Market Share and BPS Analysis By Manufacturing Type, 2023 & 2033

Figure 58: North America Market Y-o-Y Growth Projections By Manufacturing Type, 2023 to 2033

Figure 59: North America Market Attractiveness Analysis By Manufacturing Type, 2023 to 2033

Figure 60: North America Market Share and BPS Analysis By Application, 2023 & 2033

Figure 61: North America Market Y-o-Y Growth Projections By Application, 2023 to 2033

Figure 62: North America Market Attractiveness Analysis By Application, 2023 to 2033

Figure 63: Latin America Market Share and BPS Analysis By Country, 2023 & 2033

Figure 64: Latin America Market Y-o-Y Growth Projections By Country, 2023 to 2033

Figure 65: Latin America Market Attractiveness Analysis By Country, 2023 to 2033

Figure 66: Latin America Market Share and BPS Analysis By Product Type, 2023 & 2033

Figure 67: Latin America Market Y-o-Y Growth Projections By Product Type, 2023 to 2033

Figure 68: Latin America Market Attractiveness Analysis By Product Type, 2023 to 2033

Figure 69: Latin America Market Share and BPS Analysis By Manufacturing Type, 2023 & 2033

Figure 70: Latin America Market Y-o-Y Growth Projections By Manufacturing Type, 2023 to 2033

Figure 71: Latin America Market Attractiveness Analysis By Manufacturing Type, 2023 to 2033

Figure 72: Latin America Market Share and BPS Analysis By Application, 2023 & 2033

Figure 73: Latin America Market Y-o-Y Growth Projections By Application, 2023 to 2033

Figure 74: Latin America Market Attractiveness Analysis By Application, 2023 to 2033

Figure 75: Western Europe Market Share and BPS Analysis By Country, 2023 & 2033

Figure 76: Western Europe Market Y-o-Y Growth Projections By Country, 2023 to 2033

Figure 77: Western Europe Market Attractiveness Analysis By Country, 2023 to 2033

Figure 78: Western Europe Market Share and BPS Analysis By Product Type, 2023 & 2033

Figure 79: Western Europe Market Y-o-Y Growth Projections By Product Type, 2023 to 2033

Figure 80: Western Europe Market Attractiveness Analysis By Product Type, 2023 to 2033

Figure 81: Western Europe Market Share and BPS Analysis By Manufacturing Type, 2023 & 2033

Figure 81: Eastern Europe Market Share and BPS Analysis By Application, 2023 & 2033

Figure 82: Western Europe Market Y-o-Y Growth Projections By Manufacturing Type, 2023 to 2033

Figure 83: Western Europe Market Attractiveness Analysis By Manufacturing Type, 2023 to 2033

Figure 84: Western Europe Market Share and BPS Analysis By Application, 2023 & 2033

Figure 85: Western Europe Market Y-o-Y Growth Projections By Application, 2023 to 2033

Figure 86: Western Europe Market Attractiveness Analysis By Application, 2023 to 2033

Figure 87: Eastern Europe Market Share and BPS Analysis By Country, 2023 & 2033

Figure 88: Eastern Europe Market Y-o-Y Growth Projections By Country, 2023 to 2033

Figure 89: Eastern Europe Market Attractiveness Analysis By Country, 2023 to 2033

Figure 90: Eastern Europe Market Share and BPS Analysis By Product Type, 2023 & 2033

Figure 91: Eastern Europe Market Y-o-Y Growth Projections By Product Type, 2023 to 2033

Figure 92: Eastern Europe Market Attractiveness Analysis By Product Type, 2023 to 2033

Figure 93: Eastern Europe Market Share and BPS Analysis By Manufacturing Type, 2023 & 2033

Figure 94: Eastern Europe Market Y-o-Y Growth Projections By Manufacturing Type, 2023 to 2033

Figure 95: Eastern Europe Market Attractiveness Analysis By Manufacturing Type, 2023 to 2033

Figure 97: Eastern Europe Market Y-o-Y Growth Projections By Application, 2023 to 2033

Figure 98: Eastern Europe Market Attractiveness Analysis By Application, 2023 to 2033

Figure 99: Central Asia Market Share and BPS Analysis By Product Type, 2023 & 2033

Figure 100: Central Asia Market Y-o-Y Growth Projections By Product Type, 2023 to 2033

Figure 101: Central Asia Market Attractiveness Analysis By Product Type, 2023 to 2033

Figure 102: Central Asia Market Share and BPS Analysis By Manufacturing Type, 2023 & 2033

Figure 103: Central Asia Market Y-o-Y Growth Projections By Manufacturing Type, 2023 to 2033

Figure 104: Central Asia Market Attractiveness Analysis By Manufacturing Type, 2023 to 2033

Figure 105: Central Asia Market Share and BPS Analysis By Application, 2023 & 2033

Figure 106: Central Asia Market Y-o-Y Growth Projections By Application, 2023 to 2033

Figure 107: Central Asia Market Attractiveness Analysis By Application, 2023 to 2033

Figure 108: Russia & Belarus Market Share and BPS Analysis By Product Type, 2023 & 2033

Figure 109: Russia & Belarus Market Y-o-Y Growth Projections By Product Type, 2023 to 2033

Figure 110: Russia & Belarus Market Attractiveness Analysis By Product Type, 2023 to 2033

Figure 111: Russia & Belarus Market Share and BPS Analysis By Manufacturing Type, 2023 & 2033

Figure 112: Russia & Belarus Market Y-o-Y Growth Projections By Manufacturing Type, 2023 to 2033

Figure 113: Russia & Belarus Market Attractiveness Analysis By Manufacturing Type, 2023 to 2033

Figure 114: Russia & Belarus Market Share and BPS Analysis By Application, 2023 & 2033

Figure 115: Russia & Belarus Market Y-o-Y Growth Projections By Application, 2023 to 2033

Figure 116: Russia & Belarus Market Attractiveness Analysis By Application, 2023 to 2033

Figure 117: Balkan & Baltic Countries Chemicals Market Share and BPS Analysis By Product Type, 2023 & 2033

Figure 118: Balkan & Baltic Countries Chemicals Market Y-o-Y Growth Projections By Product Type, 2023 to 2033

Figure 119: Balkan & Baltic Countries Chemicals Market Attractiveness Analysis By Product Type, 2023 to 2033

Figure 120: Balkan & Baltic Countries Chemicals Market Share and BPS Analysis By Manufacturing Type, 2023 & 2033

Figure 121: Balkan & Baltic Countries Chemicals Market Y-o-Y Growth Projections By Manufacturing Type, 2023 to 2033

Figure 122: Balkan & Baltic Countries Chemicals Market Attractiveness Analysis By Manufacturing Type, 2023 to 2033

Figure 123: Balkan & Baltic Countries Chemicals Market Share and BPS Analysis By Application, 2023 & 2033

Figure 124: Balkan & Baltic Countries Chemicals Market Y-o-Y Growth Projections By Application, 2023 to 2033

Figure 125: Balkan & Baltic Countries Chemicals Market Attractiveness Analysis By Application, 2023 to 2033

Figure 126: East Asia Market Share and BPS Analysis By Country, 2023 & 2033

Figure 127: East Asia Market Y-o-Y Growth Projections By Country, 2023 to 2033

Figure 128: East Asia Market Attractiveness Analysis By Country, 2023 to 2033

Figure 129: East Asia Market Share and BPS Analysis By Product Type, 2023 & 2033

Figure 130: East Asia Market Y-o-Y Growth Projections By Product Type, 2023 to 2033

Figure 131: East Asia Market Attractiveness Analysis By Product Type, 2023 to 2033

Figure 132: East Asia Market Share and BPS Analysis By Manufacturing Type, 2023 & 2033

Figure 133: East Asia Market Y-o-Y Growth Projections By Manufacturing Type, 2023 to 2033

Figure 134: East Asia Market Attractiveness Analysis By Manufacturing Type, 2023 to 2033

Figure 135: East Asia Market Share and BPS Analysis By Application, 2023 & 2033

Figure 136: East Asia Market Y-o-Y Growth Projections By Application, 2023 to 2033

Figure 137: East Asia Market Attractiveness Analysis By Application, 2023 to 2033

Figure 138: South Asia Pacific Market Share and BPS Analysis By Country, 2023 & 2033

Figure 139: South Asia Pacific Market Y-o-Y Growth Projections By Country, 2023 to 2033

Figure 140: South Asia Pacific Market Attractiveness Analysis By Country, 2023 to 2033

Figure 141: South Asia and Pacific Market Share and BPS Analysis By Product Type, 2023 & 2033

Figure 142: South Asia and Pacific Market Y-o-Y Growth Projections By Product Type, 2023 to 2033

Figure 143: South Asia and Pacific Market Attractiveness Analysis By Product Type, 2023 to 2033

Figure 144: South Asia and Pacific Market Share and BPS Analysis By Manufacturing Type, 2023 & 2033

Figure 145: South Asia and Pacific Market Y-o-Y Growth Projections By Manufacturing Type, 2023 to 2033

Figure 146: South Asia and Pacific Market Attractiveness Analysis By Manufacturing Type, 2023 to 2033

Figure 147: South Asia and Pacific Market Share and BPS Analysis By Application, 2023 & 2033

Figure 148: South Asia and Pacific Market Y-o-Y Growth Projections By Application, 2023 to 2033

Figure 149: South Asia and Pacific Market Attractiveness Analysis By Application, 2023 to 2033

Figure 150: Middle East and Africa Market Share and BPS Analysis By Country, 2023 & 2033

Figure 151: Middle East and Africa Market Y-o-Y Growth Projections By Country, 2023 to 2033

Figure 152: Middle East and Africa Market Attractiveness Analysis By Country, 2023 to 2033

Figure 153: Middle East and Africa Market Share and BPS Analysis By Product Type, 2023 & 2033

Figure 154: Middle East and Africa Market Y-o-Y Growth Projections By Product Type, 2023 to 2033

Figure 155: Middle East and Africa Market Attractiveness Analysis By Product Type, 2023 to 2033

Figure 156: Middle East and Africa Chemicals Market Share and BPS Analysis By Manufacturing Type, 2023 & 2033

Figure 157: Middle East and Africa Market Y-o-Y Growth Projections By Manufacturing Type, 2023 to 2033

Figure 158: Middle East and Africa Market Attractiveness Analysis By Manufacturing Type, 2023 to 2033

Figure 159: Middle East and Africa Market Share and BPS Analysis By Application, 2023 & 2033

Figure 160: Middle East and Africa Market Y-o-Y Growth Projections By Application, 2023 to 2033

Figure 161: Middle East and Africa Market Attractiveness Analysis By Application, 2023 to 2033

Recommendations

Chemicals & Materials

Construction Chemical Market

Published : April 2024

Chemicals & Materials

Refinery Process Chemical Market

Published : February 2024

Chemicals & Materials

Chemical Testing Services Market

Published : August 2023

Chemicals & Materials

Europe Fine Chemical Market

Published : January 2023

Explore Chemicals & Materials Insights

View Reports