Reports

- Global Locations -

Headquarters

Future Market Insights, Inc.

Christiana Corporate, 200
Continental Drive, Suite 401,
Newark, Delaware - 19713,
United States

T: +1-845-579-5705

Americas

Future Market Insights, Inc.

616 Corporate Way, Suite 2-9018,
Valley Cottage, NY 10989, United States

T: +1-347-918-3531

MEA

Future Market Insights

1602-6 Jumeirah Bay X2 Tower, Plot No: JLT-PH2-X2A,
Jumeirah Lakes Towers, Dubai,
United Arab Emirates

Europe

Future Market Insights

3rd Floor, 207 Regent Street,
W1B 3HH London
United Kingdom

T: + 44 (0) 20 8123 9659
D: +44 (0) 20 3287 4268

Asia Pacific

Future Market Insights

IndiaLand Global Tech Park, Unit UG-1, Behind Grand HighStreet, Phase 1, Hinjawadi, MH, Pune – 411057, India

A2 Ice Cream Market Outlook from 2024 to 2034

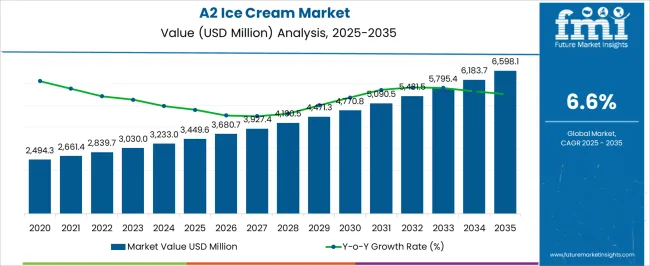
The global A2 ice cream market is estimated to reach a valuation of US$ 180.0 million in 2024. The market is expected to surge at a CAGR of 7.2%, reaching US$ 360.0 million by 2034.

The global A2 ice cream market is a part of the global ice cream market that focuses on products made from A2 milk. A2 milk contains A2 beta-casein protein, opposite to the A1 beta-casein protein found in conventional milk. These characteristics of A2 milk are gaining attention due to its potential digestive and health benefits.

A2 ice cream is commonly marketed as a more nutritious and easier-to-digest substitute for conventional ice cream manufactured from A1 milk. Marketing for consumers who are conscious of their digestive health centers on the supposed health benefits of A2 milk.

A2 ice cream is positioned as a premium or specialty product in the ice cream market. It frequently markets to health-conscious consumers willing to spend more on items that can improve their health.

Attributes Key Insights
Estimated Global A2 Ice Cream Market Size (2024E) US$ 180.0 million
Projected A2 Ice Cream Market Value (2034F) US$ 360.0 million
Value-based CAGR (2024 to 2034) 7.2%

Don't pay for what you don't need

Customize your report by selecting specific countries or regions and save 30%!

2019 to 2023 Global A2 Ice Cream Market Sales Outlook Vs. 2024 to 2034

The A2 ice cream market is projected to reach US$ 180.0 million in 2024 and US$ 360.0 million by 2034. Growing consumer interest in healthy and more easily digestible options, along with the growing availability and variety of A2 ice cream products, is fueling the market’s expansion.

The global A2 ice cream market has experienced steady growth from 2019 to 2023, reflecting that A2 ice cream manufacturers have been able to attract a wide range of consumers. Consumers who are health-conscious, lactose-intolerant, and those seeking indulgent frozen dessert options prefer A2 ice cream over the traditional ones.

In recent years, there has been a global movement toward eating healthy foods and raising awareness of food sensitivities. A2 milk and, by extension, A2 ice cream have been promoted as alternatives that are set to be easier for people to digest if they have trouble with A1 milk.

As the value of gut health becomes more widely recognized, goods such as A2 ice cream and milk are promoted as being kinder to the digestive tract. This is in line with the growing interest in gut wellness and health.

Food producers are always trying to come up with new ways to innovate and set themselves apart from the competition. A2 ice cream is a new product on the ice cream market because of its distinctive milk composition.

A2 Ice Cream Market Trends

  • Increasing focus on health and wellness leads to the development of low-calorie A2 ice cream options.
  • Growing interest in A2 ice cream with added functional benefits, such as probiotics or vitamins.
  • Expansion of sophisticated flavor profiles, flavor mix, and mash-ups in A2 ice cream products.
  • Customization and personalization of A2 ice cream treats to meet consumer preferences.
  • Changing consumer preferences and increasing affluence are anticipated to gain traction.
  • Rising consumer awareness of the nutritional content and benefits of A2 ice cream products.
  • Ongoing flavor development and innovation in A2 ice cream, focusing on plant-based options and indulgent flavors.
Nandini Roy Choudhury

Principal Consultant

Talk to Analyst

Find your sweet spots for generating winning opportunities in this market.

Restraining Factors in the A2 Ice Cream Market

  • Lack of knowledge is set to impede market expansion since uninformed consumers are unlikely to actively seek out A2 ice cream.
  • A2 ice creams are expensive compared to the traditional ones, which is anticipated to discourage consumers on a tight budget from consuming them.
  • It is difficult to keep an even and dependable supply of A2 milk for making ice cream, particularly if the dairy supply chain experiences problems. This makes it difficult for producers to keep up with the rising demand and keep their products available.

Comparative View of Adjacent A2 Ice Cream Markets

The peer or tangential markets in the food and beverages division will likely impact the A2 ice cream market. These include other types of markets, such as the A2 infant formula and A2 milk industries.

Demand for A2 ice cream is projected to expand at a 7.2% CAGR during the forecast period. There has been an increasing demand for artisanal and premium ice cream products. The use of high-quality ingredients and distinctive flavors is becoming popular because of this trend.

On the contrary, the A2 infant formula industry is poised to thrive at a higher CAGR of 18.0% through 2034. In the A2 infant formula market, ongoing research & development activities are concentrated on refining formulas, boosting nutritional content, and launching novel products that cater to changing parent preferences.

The A2 milk industry is projected to expand at a CAGR of 9.5% from 2024 to 2034. Trends in the A2 milk market are expected to be influenced by the high demand for food items produced sustainably and ethically. Leading players are prioritizing ecologically friendly procedures, moral animal care, and sustainable farming methods.

A2 Ice Cream Market:

Attributes A2 Ice Cream Market
CAGR (2024 to 2034) 7.2%
Growth Factor Direct-to-consumer sales and e-commerce platforms are becoming significant for the food & beverage industry. In order to provide convenience and customized purchasing experiences, A2 ice cream producers are looking at new direct-to-consumer marketing strategies.
Key Trends Customers are becoming more aware of how their dietary decisions affect the environment. Brands started to obtain a competitive advantage by emphasizing eco-friendly and sustainable practices in their packaging and production methods.

A2 Infant Formula Market:

Attributes A2 Infant Formula Market
CAGR (2024 to 2034) 18.0%
Growth Factor Companies in the A2 infant formula market fund awareness programs to educate parents about the advantages of A2 milk, including potential digestive benefits.
Key Trends Offering their babies foods that are easily absorbed and nutritious is something that parents are concerned about. When looking for a product that meets certain nutritional demands, A2 infant formula is promoted as a possible substitute.

A2 Milk Market:

Attributes A2 Milk Market
CAGR (2024 to 2034) 9.5%
Growth Factor Companies in the A2 milk market have spent money on marketing and instructional initiatives to increase public knowledge of the distinctions between A1 and A2 milk. One important factor has been consumer awareness of the possible advantages of A2 milk for digestive health.
Key Trends In order to adapt to changing consumer demands, the A2 milk industry is always researching and developing new A2 dairy products as well as improving production methods and product quality.

Get the data you need at a Fraction of the cost

Personalize your report by choosing insights you need
and save 40%!

Country-wise Insights

The table below shows the estimated growth rates of the top four countries. Germany, the United States, and Australia are set to record higher CAGRs of 8.2%, 7.8%, and 7.5%, respectively, through 2034.

Countries CAGR
United States 7.8%
Japan 7.0%
Australia 7.5%
Germany 8.2%

Escalating Demand for A2 Healthy Dairy Products Driving the United States

The United States A2 ice cream market is expected to surge at a CAGR of 7.8% by 2034. A2 ice cream is in high demand due to consumers' growing emphasis on health & wellbeing and the supposed health advantages of A2 milk.

The increased lactose-intolerant population has contributed to this trend by encouraging consumers to look for alternative dairy products like A2 ice cream and milk. Developed retail infrastructure, including supermarkets, convenience stores, and specialty food retailers, provides extensive distribution channels for A2 ice cream products and fuels the market.

Growing Consumer Focus on Health and Wellness to Uplift Germany

Germany is projected to rise at a CAGR of 8.2% by 2034. Increasing consumer focus on health and growing awareness of the potential health benefits of consuming dairy products free from A1 protein is gaining traction in Germany. Germany’s market is known for its high-quality and innovative food products, which has created a favorable environment for introducing and succeeding ice cream made with A2 milk.

Rising Demand for A2 Dairy Products Escalating Sales in China

High-end, superior food items are becoming popular among consumers in China. Positioned as a specialty and premium product, A2 ice cream is drawing customers who are prepared to pay more for its alleged health benefits and distinctive features.

A2 ice cream companies are reaching a larger audience because of the growing popularity of e-commerce in China. Customers can now more readily access specialty and niche products through online platforms.

Increasing Concerns about Sustainability in Japan to Propel Sales by 2034

Consumer desires for natural and healthier goods have led to trends in the dairy market in Japan. Due to its possible digestive advantages, A2 milk is becoming increasingly popular, and this interest is set to extend to A2 ice cream.

Positioned as a potentially less allergic and easier-to-digest option, A2 ice cream is appealing to health-conscious consumers in Japan. The market is observing a shift toward upscale due to the growing demand for handcrafted A2 ice creams with distinctive tastes.

Consumers in Japan are becoming increasingly concerned about sustainability. A2 ice cream manufacturers are placing a strong emphasis on environmentally friendly and sustainable methods for procuring materials and packaging to create a customer base.

Presence of Foreign and Local Firms in Australia to Spur Market Growth

Non-dairy substitutes are gaining momentum among health-conscious consumers in Australia. Due to the natural and non-dairy qualities of A2 milk used in the making of A2 ice cream, consumers in Australia are directed toward A2 ice cream over traditional ice creams.

Effective marketing tactics emphasizing the special characteristics of A2 milk, like easy digestion, are set to be very important. Companies that highlight the provenance of A2 milk and its advantages are winning over customers' trust.

The sourcing of ingredients and sustainability practices are topics that consumers are becoming interested in. Environmentally concerned consumers are drawn to brands that emphasize sustainable production practices or locally sourced A2 milk.

Category-wise Insights

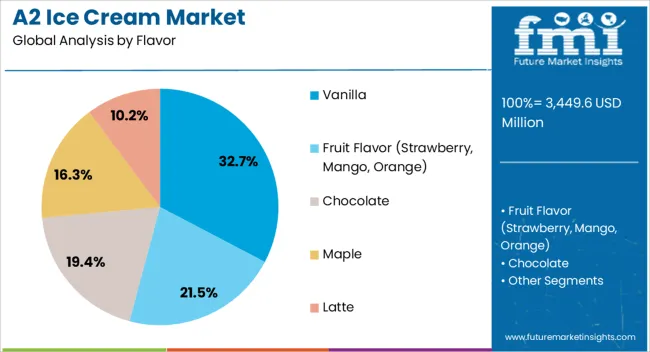
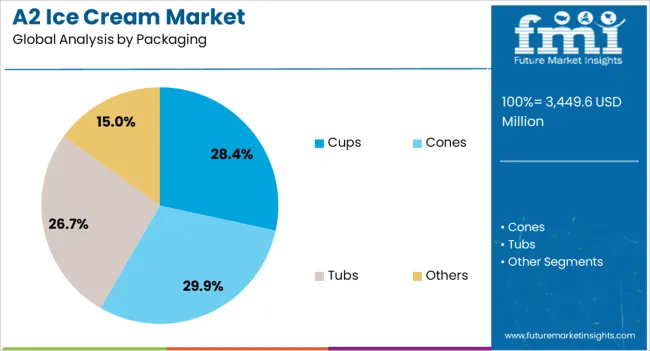
The below section shows the chocolate segment dominated by flavor. It is predicted to hold a market share of 38.0% in 2024. Based on packaging, the cup segment is anticipated to generate a moderate share through 2024. It is set to hold a share of 25.6% in 2024.

Segment Market Share (2024)
Chocolate (Flavor) 38.0%
Cups (Packaging) 25.6%
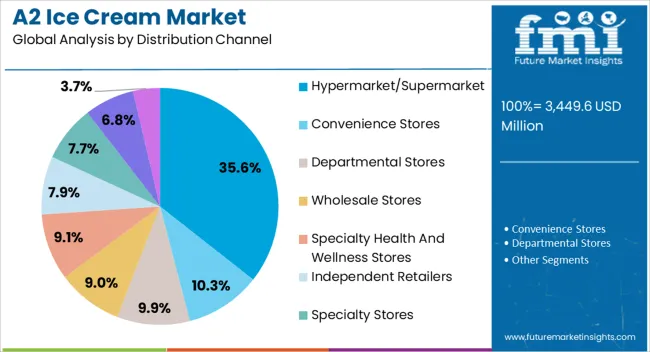
Hypermarket/Supermarket (Distribution Channel) 28.5%

Chocolate Segment to Lead by Flavor in the Market Through 2034

Based on flavor, chocolate is estimated to dominate the global market by holding a share of 38.0% in 2024. Chocolate flavor is popular as it is generally connected to comfort and indulgence, and consumers are drawn to rich ice cream flavors. Consumers are increasingly seeking delightful taste experiences and products that align with their health-conscious choices, making chocolate A2 ice cream an appealing option.

Demand for Cup Packaging Remain High Due to its Convenience and Ease of Use

Based on packaging, cups are expected to hold a market share of 25.6% in 2024. The cup packaging is a popular option for ice cream packaging as it is convenient, easy to use, and provides a single-serve option for consumers.

Cup packaging is suitable for both on-the-go and at-home consumption, making it a versatile option for manufacturers. Cups also provide airtight packaging that helps to maintain the freshness and quality of the ice cream, which makes it a more popular packaging option.

Competitive Landscape

The competitive environment in the A2 ice cream market is diversified and active. Leading firms specialized are focused on research & development, sustainable sourcing, and novel formulations.

Key manufactures place a premium on environmentally friendly operations, product certifications, and meeting the growing demand for natural & sustainable products. Leading companies are also striving to maintain their market position and capitalize on rising demand by emphasizing quality, innovation, and matching client preferences.

Product Launches and Key Developments

  • In 2023, Alec's Ice Cream extended its distribution reach to more retailers, including Sprouts Farmers Markets and Natural Grocers, giving the company a place in the freezer aisle at more than 1,000 retailers.
  • In 2020, Re: THINK Ice Cream launched lactose-free ice cream with A2 dairy and collagen, catering to consumers who are averse to dairy but still want the traditional dairy ice cream experience.

Scope of the Report

Attribute Details
Estimated Value (2024) US$ 180.0 million
Projected Value (2034) US$ 360.0 million
Anticipated Growth Rate (2024 to 2034) 7.2%
Forecast Period 2024 to 2034
Historical Data Available for 2019 to 2023
Market Analysis US$ million for Value, MT for Volume
Key Regions Covered North America, Latin America, Europe, East Asia, South Asia, and the Middle East and Africa
Key Countries Covered United States, Canada, Brazil, Mexico, Germany, United Kingdom, France, Italy, Spain, Nordic, Russia, Poland, China, India, Thailand, Indonesia, Australia and New Zealand, Japan, GCC countries, North Africa, South Africa, and others.
Key Segments Covered Flavor, Packaging, Distribution Channel, and Region
Key Companies Profiled
  • The a2 Milk Company
  • Braum's Inc.
  • Alec's Ice Cream
  • GoDesi Milk
  • Re:THINK
  • Miller's Bio Farm
  • UNITED FARMERS CREAMERY
  • APPLEBY FARMS ICE CREAM
  • MOO-ville Creamery
  • THAYUMANAVAR A2 DAIRY FARMS PVT LTD
  • Amos Miller Organic Farm
  • Highland Farms
  • PEI ORGANIC FOODS LLP
Report Coverage Market Forecast, Company Share Analysis, Competition Intelligence, Drivers Restraints Opportunity Trends Analysis, Market Dynamics and Challenges, and Strategic Growth Initiatives

A2 Ice Cream Market Segmentation by Category

By Flavor:

  • Vanilla
  • Fruit Flavor (Strawberry, Mango, Orange)
  • Chocolate
  • Maple
  • Latte

By Packaging:

  • Cups
  • Cones
  • Tubs
  • Others

By Distribution Channel:

  • Hypermarket/Supermarket
  • Convenience Stores
  • Departmental Stores
  • Wholesale Stores
  • Specialty Health and Wellness stores
  • Independent Retailers
  • Specialty Stores
  • Pharmacies and Drugstores
  • Online Retailers

By Region:

  • North America
  • Latin America
  • Europe
  • East Asia
  • South Asia
  • Middle East and Africa

Frequently Asked Questions

How big is the A2 ice cream maker market?

The market is projected to reach US$ 180.0 million in 2024.

What will be the global A2 ice cream market's growth rate by 2034?

The market is expected to rise at a CAGR of 7.2% by 2034.

What is the expected value of the A2 ice cream market by 2034?

By 2034, the market is projected to reach a valuation of US$ 360.0 million.

Which region adds to the leading A2 ice cream market valuation?

North America is expected to lead the A2 ice cream market.

Who are the key players in the A2 ice cream market?

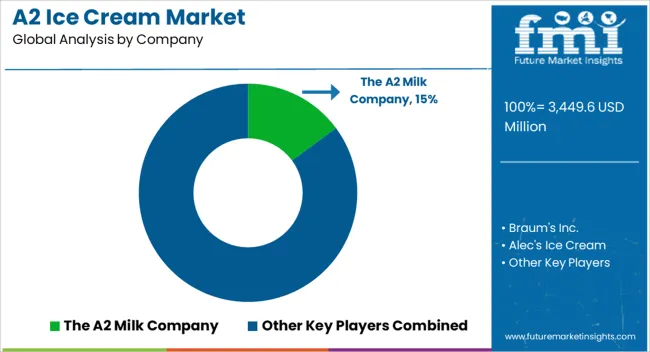
The a2 Milk Company, Braum's Inc., and Alec's Ice Cream are the key players.

Table of Content

1. Executive Summary

    1.1. Global Market Outlook

    1.2. Demand Side Trends

    1.3. Supply Side Trends

    1.4. Technology Roadmap

    1.5. Analysis and Recommendations

2. Market Overview

    2.1. Market Coverage / Taxonomy

    2.2. Market Definition / Scope / Limitations

3. Market Dynamics

    3.1. Drivers

        3.1.1. Supply Side Drivers

        3.1.2. Demand Side Drivers

        3.1.3. Economic Side Drivers

    3.2. Restraints

    3.3. Opportunity

    3.4. Market Trends

    3.5. Macro-Economic Factors

    3.6. Forecast Factors - Relevance and Impact

    3.7. Certifying Agencies

    3.8. Consumer Survey

4. Value Chain Analysis and Operating Margins

    4.1. Supply chain analysis (Operating Margin Analysis)

    4.2. List of Key market participants

        4.2.1. Key Manufacturers List

        4.2.2. Key End-user List

    4.3. Notes on Value Added at Each Node in the Value Chain

5. Global Market - Pricing Analysis

    5.1. Price Point Assessment By Flavor

    5.2. Price Point Assessment by Region

        5.2.1. Manufacturer Level Pricing

        5.2.2. Distributor Level Pricing

        5.2.3. Retail Level Pricing

    5.3. Price Forecast till 2034

6. Global Market Demand in Value (US$ million) and Volume (MT) Analysis 2019 to 2023 and Forecast, 2024 to 2034

    6.1. Historical Market Value (US$ million) and Volume (MT) Analysis, 2019 to 2023

    6.2. Current and Future Market Value (US$ million) and Volume (MT) Projections, 2024 to 2034

        6.2.1. Y-o-Y Growth Trend Analysis

        6.2.2. Absolute $ Opportunity Analysis

7. Global Market Analysis 2019 to 2023 and Forecast 2024 to 2034, by Flavor

    7.1. Introduction / Key Findings

    7.2. Historical Market Size (US$ million) and Volume (MT) Analysis By Flavor, 2019 to 2023

    7.3. Current and Future Market Size (US$ million) and Volume (MT) Analysis and Forecast By Flavor, 2024 to 2034

        7.3.1. Vanilla

        7.3.2. Fruit Flavor (Strawberry, Mango, Orange)

        7.3.3. Chocolate

        7.3.4. Maple

        7.3.5. Latte

    7.4. Market Attractiveness Analysis By Flavor

8. Global Market Analysis 2019 to 2023 and Forecast 2024 to 2034, By Packaging

    8.1. Introduction / Key Findings

    8.2. Historical Market Size (US$ million) and Volume (MT) Analysis By Packaging, 2019 to 2023

    8.3. Current and Future Market Size (US$ million) and Volume (MT) Analysis and Forecast By Packaging, 2024 to 2034

        8.3.1. Cups

        8.3.2. Cones

        8.3.3. Tubs

        8.3.4. Others

    8.4. Market Attractiveness Analysis By Packaging

9. Global Market Analysis 2019 to 2023 and Forecast 2024 to 2034, By Distribution Channel

    9.1. Introduction / Key Findings

    9.2. Historical Market Size (US$ million) and Volume (MT) Analysis By Distribution Channel, 2019 to 2023

    9.3. Current and Future Market Size (US$ million) and Volume (MT) Analysis and Forecast By Distribution Channel, 2024 to 2034

        9.3.1. Hypermarket/Supermarket

        9.3.2. Convenience Stores

        9.3.3. Departmental Stores

        9.3.4. Wholesale Stores

        9.3.5. Specialty Health and Wellness stores

        9.3.6. Independent Retailers

        9.3.7. Specialty Stores

        9.3.8. Pharmacies and Drugstores

        9.3.9. Online Retailers

    9.4. Market Attractiveness Analysis By Distribution Channel

10. Global Market Analysis 2019 to 2023 and Forecast 2024 to 2034, by Region

    10.1. Introduction

    10.2. Historical Market Size (US$ million) and Volume (MT) Analysis By Region, 2019 to 2023

    10.3. Current Market Size (US$ million) and Volume (MT) Analysis and Forecast By Region, 2024 to 2034

        10.3.1. North America

        10.3.2. Latin America

        10.3.3. Europe

        10.3.4. East Asia

        10.3.5. South Asia

        10.3.6. Oceania

        10.3.7. Middle East and Africa

    10.4. Market Attractiveness Analysis By Region

11. North America Market Analysis 2019 to 2023 and Forecast 2024 to 2034

    11.1. Introduction

    11.2. Historical Market Size (US$ million) and Volume Trend Analysis By Market Taxonomy, 2019 to 2023

    11.3. Market Size (US$ million) and Volume Forecast By Market Taxonomy, 2024 to 2034

        11.3.1. By Country

            11.3.1.1. United States

            11.3.1.2. Canada

        11.3.2. By Flavor

        11.3.3. By Packaging

        11.3.4. By Distribution Channel

    11.4. Market Attractiveness Analysis

        11.4.1. By Country

        11.4.2. By Flavor

        11.4.3. By Packaging

        11.4.4. By Distribution Channel

    11.5. Key Takeaways

12. Latin America Market Analysis 2019 to 2023 and Forecast 2024 to 2034

    12.1. Introduction

    12.2. Historical Market Size (US$ million) and Volume Trend Analysis By Market Taxonomy, 2019 to 2023

    12.3. Market Size (US$ million) and Volume Forecast By Market Taxonomy, 2024 to 2034

        12.3.1. By Country

            12.3.1.1. Brazil

            12.3.1.2. Mexico

            12.3.1.3. Colombia

            12.3.1.4. Rest of Latin America

        12.3.2. By Flavor

        12.3.3. By Packaging

        12.3.4. By Distribution Channel

    12.4. Market Attractiveness Analysis

        12.4.1. By Country

        12.4.2. By Flavor

        12.4.3. By Packaging

        12.4.4. By Distribution Channel

    12.5. Key Takeaways

13. Europe Market Analysis 2019 to 2023 and Forecast 2024 to 2034

    13.1. Introduction

    13.2. Historical Market Size (US$ million) and Volume Trend Analysis By Market Taxonomy, 2019 to 2023

    13.3. Market Size (US$ million) and Volume Forecast By Market Taxonomy, 2024 to 2034

        13.3.1. By Country

            13.3.1.1. Germany

            13.3.1.2. France

            13.3.1.3. United Kingdom

            13.3.1.4. Spain

            13.3.1.5. Netherlands

            13.3.1.6. Belgium

            13.3.1.7. Poland

            13.3.1.8. Italy

            13.3.1.9. Russia

            13.3.1.10. Rest of Europe

        13.3.2. By Flavor

        13.3.3. By Packaging

        13.3.4. By Distribution Channel

    13.4. Market Attractiveness Analysis

        13.4.1. By Country

        13.4.2. By Flavor

        13.4.3. By Packaging

        13.4.4. By Distribution Channel

    13.5. Key Takeaways

14. East Asia Market Analysis 2019 to 2023 and Forecast 2024 to 2034

    14.1. Introduction

    14.2. Historical Market Size (US$ million) and Volume Trend Analysis By Market Taxonomy, 2019 to 2023

    14.3. Market Size (US$ million) and Volume Forecast By Market Taxonomy, 2024 to 2034

        14.3.1. By Country

            14.3.1.1. China

            14.3.1.2. Japan

            14.3.1.3. South Korea

        14.3.2. By Flavor

        14.3.3. By Packaging

        14.3.4. By Distribution Channel

    14.4. Market Attractiveness Analysis

        14.4.1. By Country

        14.4.2. By Flavor

        14.4.3. By Packaging

        14.4.4. By Distribution Channel

    14.5. Key Takeaways

15. South Asia Market Analysis 2019 to 2023 and Forecast 2024 to 2034

    15.1. Introduction

    15.2. Historical Market Size (US$ million) and Volume Trend Analysis By Market Taxonomy, 2019 to 2023

    15.3. Market Size (US$ million) and Volume Forecast By Market Taxonomy, 2024 to 2034

        15.3.1. By Country

            15.3.1.1. India

            15.3.1.2. Malaysia

            15.3.1.3. Indonesia

            15.3.1.4. Singapore

            15.3.1.5. Vietnam

            15.3.1.6. Philippines

            15.3.1.7. Thailand

            15.3.1.8. Rest of South Asia

            15.3.1.9. By Flavor

        15.3.2. By Packaging

        15.3.3. By Distribution Channel

    15.4. Market Attractiveness Analysis

        15.4.1. By Country

        15.4.2. By Flavor

        15.4.3. By Packaging

        15.4.4. By Distribution Channel

    15.5. Key Takeaways

16. Oceania Market Analysis 2019 to 2023 and Forecast 2024 to 2034

    16.1. Introduction

    16.2. Historical Market Size (US$ million) and Volume Trend Analysis By Market Taxonomy, 2019 to 2023

    16.3. Market Size (US$ million) and Volume Forecast By Market Taxonomy, 2024 to 2034

        16.3.1. By Country

            16.3.1.1. Australia

            16.3.1.2. New Zealand

        16.3.2. By Flavor

        16.3.3. By Packaging

        16.3.4. By Distribution Channel

    16.4. Market Attractiveness Analysis

        16.4.1. By Country

        16.4.2. By Flavor

        16.4.3. By Packaging

        16.4.4. By Distribution Channel

    16.5. Key Takeaways

17. Middle East and Africa Market Analysis 2019 to 2023 and Forecast 2024 to 2034

    17.1. Introduction

    17.2. Historical Market Size (US$ million) and Volume Trend Analysis By Market Taxonomy, 2019 to 2023

    17.3. Market Size (US$ million) and Volume Forecast By Market Taxonomy, 2024 to 2034

        17.3.1. By Country

            17.3.1.1. GCC Countries

            17.3.1.2. North Africa

            17.3.1.3. South Africa

            17.3.1.4. Rest of Middle East and Africa

            17.3.1.5. By Flavor

        17.3.2. By Packaging

        17.3.3. By Distribution Channel

    17.4. Market Attractiveness Analysis

        17.4.1. By Country

        17.4.2. By Flavor

        17.4.3. By Packaging

        17.4.4. By Distribution Channel

    17.5. Key Takeaways

18. Country-level Market Analysis

    18.1. United States Market Analysis

        18.1.1. By Flavor

        18.1.2. By Packaging

        18.1.3. By Distribution Channel

    18.2. Canada Market Analysis

        18.2.1. By Flavor

        18.2.2. By Packaging

        18.2.3. By Distribution Channel

    18.3. Brazil Market Analysis

        18.3.1. By Flavor

        18.3.2. By Packaging

        18.3.3. By Distribution Channel

    18.4. Mexico Market Analysis

        18.4.1. By Flavor

        18.4.2. By Packaging

        18.4.3. By Distribution Channel

    18.5. Colombia Market Analysis

        18.5.1. By Flavor

        18.5.2. By Packaging

        18.5.3. By Distribution Channel

    18.6. Germany Market Analysis

        18.6.1. By Flavor

        18.6.2. By Packaging

        18.6.3. By Distribution Channel

    18.7. United Kingdom Market Analysis

        18.7.1. By Flavor

        18.7.2. By Packaging

        18.7.3. By Distribution Channel

    18.8. France Market Analysis

        18.8.1. By Flavor

        18.8.2. By Packaging

        18.8.3. By Distribution Channel

    18.9. Italy Market Analysis

        18.9.1. By Flavor

        18.9.2. By Packaging

        18.9.3. By Distribution Channel

        18.9.4. By Price Range

    18.10. Spain Market Analysis

        18.10.1. By Flavor

        18.10.2. By Packaging

        18.10.3. By Distribution Channel

    18.11. Netherlands Europe Market Analysis

        18.11.1. By Flavor

        18.11.2. By Packaging

        18.11.3. By Distribution Channel

    18.12. Belgium Market Analysis

        18.12.1. By Flavor

        18.12.2. By Packaging

        18.12.3. By Distribution Channel

    18.13. Russia Region Market Analysis

        18.13.1. By Flavor

        18.13.2. By Packaging

        18.13.3. By Distribution Channel

    18.14. Poland Market Analysis

        18.14.1. By Flavor

        18.14.2. By Packaging

        18.14.3. By Distribution Channel

    18.15. China Market Analysis

        18.15.1. By Flavor

        18.15.2. By Packaging

        18.15.3. By Distribution Channel

    18.16. Japan Market Analysis

        18.16.1. By Flavor

        18.16.2. By Packaging

        18.16.3. By Distribution Channel

    18.17. India Market Analysis

        18.17.1. By Flavor

        18.17.2. By Packaging

        18.17.3. By Distribution Channel

    18.18. Thailand Market Analysis

        18.18.1. By Flavor

        18.18.2. By Packaging

        18.18.3. By Distribution Channel

    18.19. Malaysia Market Analysis

        18.19.1. By Flavor

        18.19.2. By Packaging

        18.19.3. By Distribution Channel

    18.20. Indonesia Market Analysis

        18.20.1. By Flavor

        18.20.2. By Packaging

        18.20.3. By Distribution Channel

    18.21. Vietnam Market Analysis

        18.21.1. By Flavor

        18.21.2. By Packaging

        18.21.3. By Distribution Channel

    18.22. Philippines Market Analysis

        18.22.1. By Flavor

        18.22.2. By Packaging

        18.22.3. By Distribution Channel

    18.23. Singapore Market Analysis

        18.23.1. By Flavor

        18.23.2. By Packaging

        18.23.3. By Distribution Channel

    18.24. Australia Market Analysis

        18.24.1. By Flavor

        18.24.2. By Packaging

        18.24.3. By Distribution Channel

    18.25. New Zealand Market Analysis

        18.25.1. By Flavor

        18.25.2. By Packaging

        18.25.3. By Distribution Channel

    18.26. GCC Countries Market Analysis

        18.26.1. By Flavor

        18.26.2. By Packaging

        18.26.3. By Distribution Channel

    18.27. North Africa Market Analysis

        18.27.1. By Flavor

        18.27.2. By Packaging

        18.27.3. By Distribution Channel

    18.28. South Africa Market Analysis

        18.28.1. By Flavor

        18.28.2. By Packaging

        18.28.3. By Distribution Channel

19. Market Structure Analysis

    19.1. Global Market Competition - a Dashboard View

    19.2. Global Market Structure Analysis

    19.3. Global Market Company Share Analysis

        19.3.1. For Tier 1 Market Players, 2023

        19.3.2. Company Market Share Analysis of Top 5 Players, By Region

    19.4. Key Participants Market Presence (Intensity Mapping) by Region

20. Competition Analysis

    20.1. Competition Dashboard

    20.2. Competition Benchmarking

    20.3. Competition Deep Dive

        20.3.1. The Milk Company

            20.3.1.1. Product Portfolio

            20.3.1.2. Revenue by Market Segments (Product/Channel/Region)

            20.3.1.3. Sales Footprint

            20.3.1.4. Strategy Overview

                20.3.1.4.1. Marketing Strategy

                20.3.1.4.2. Product Strategy

                20.3.1.4.3. Channel Strategy

        20.3.2. Braum's Inc.

        20.3.3. Alec's Ice Cream

        20.3.4. GoDesi Milk

        20.3.5. Re:THINK

        20.3.6. Miller's Bio Farm

        20.3.7. UNITED FARMERS CREAMERY

        20.3.8. APPLEBY FARMS ICE CREAM

        20.3.9. MOO-ville Creamery

        20.3.10. THAYUMANAVAR DAIRY FARMS PVT LTD

        20.3.11. Amos Miller Organic Farm

        20.3.12. Highland Farms

        20.3.13. PEI ORGANIC FOODS LLP

        20.3.14. Other Players (On Additional Requests)

21. Assumptions and Acronyms Used

22. Research Methodology

List of Tables

Table 1: Global Market Value (US$ million) Forecast by Region, 2019 to 2034

Table 2: Global Market Volume (MT) Forecast by Region, 2019 to 2034

Table 3: Global Market Value (US$ million) Forecast by Flavor, 2019 to 2034

Table 4: Global Market Volume (MT) Forecast by Flavor, 2019 to 2034

Table 5: Global Market Value (US$ million) Forecast by Packaging, 2019 to 2034

Table 6: Global Market Volume (MT) Forecast by Packaging, 2019 to 2034

Table 7: Global Market Value (US$ million) Forecast by Distribution Channel, 2019 to 2034

Table 8: Global Market Volume (MT) Forecast by Distribution Channel, 2019 to 2034

Table 9: North America Market Value (US$ million) Forecast by Country, 2019 to 2034

Table 10: North America Market Volume (MT) Forecast by Country, 2019 to 2034

Table 11: North America Market Value (US$ million) Forecast by Flavor, 2019 to 2034

Table 12: North America Market Volume (MT) Forecast by Flavor, 2019 to 2034

Table 13: North America Market Value (US$ million) Forecast by Packaging, 2019 to 2034

Table 14: North America Market Volume (MT) Forecast by Packaging, 2019 to 2034

Table 15: North America Market Value (US$ million) Forecast by Distribution Channel, 2019 to 2034

Table 16: North America Market Volume (MT) Forecast by Distribution Channel, 2019 to 2034

Table 17: Latin America Market Value (US$ million) Forecast by Country, 2019 to 2034

Table 18: Latin America Market Volume (MT) Forecast by Country, 2019 to 2034

Table 19: Latin America Market Value (US$ million) Forecast by Flavor, 2019 to 2034

Table 20: Latin America Market Volume (MT) Forecast by Flavor, 2019 to 2034

Table 21: Latin America Market Value (US$ million) Forecast by Packaging, 2019 to 2034

Table 22: Latin America Market Volume (MT) Forecast by Packaging, 2019 to 2034

Table 23: Latin America Market Value (US$ million) Forecast by Distribution Channel, 2019 to 2034

Table 24: Latin America Market Volume (MT) Forecast by Distribution Channel, 2019 to 2034

Table 25: Europe Market Value (US$ million) Forecast by Country, 2019 to 2034

Table 26: Europe Market Volume (MT) Forecast by Country, 2019 to 2034

Table 27: Europe Market Value (US$ million) Forecast by Flavor, 2019 to 2034

Table 28: Europe Market Volume (MT) Forecast by Flavor, 2019 to 2034

Table 29: Europe Market Value (US$ million) Forecast by Packaging, 2019 to 2034

Table 30: Europe Market Volume (MT) Forecast by Packaging, 2019 to 2034

Table 31: Europe Market Value (US$ million) Forecast by Distribution Channel, 2019 to 2034

Table 32: Europe Market Volume (MT) Forecast by Distribution Channel, 2019 to 2034

Table 33: East Asia Market Value (US$ million) Forecast by Country, 2019 to 2034

Table 34: East Asia Market Volume (MT) Forecast by Country, 2019 to 2034

Table 35: East Asia Market Value (US$ million) Forecast by Flavor, 2019 to 2034

Table 36: East Asia Market Volume (MT) Forecast by Flavor, 2019 to 2034

Table 37: East Asia Market Value (US$ million) Forecast by Packaging, 2019 to 2034

Table 38: East Asia Market Volume (MT) Forecast by Packaging, 2019 to 2034

Table 39: East Asia Market Value (US$ million) Forecast by Distribution Channel, 2019 to 2034

Table 40: East Asia Market Volume (MT) Forecast by Distribution Channel, 2019 to 2034

Table 41: South Asia Market Value (US$ million) Forecast by Country, 2019 to 2034

Table 42: South Asia Market Volume (MT) Forecast by Country, 2019 to 2034

Table 43: South Asia Market Value (US$ million) Forecast by Flavor, 2019 to 2034

Table 44: South Asia Market Volume (MT) Forecast by Flavor, 2019 to 2034

Table 45: South Asia Market Value (US$ million) Forecast by Packaging, 2019 to 2034

Table 46: South Asia Market Volume (MT) Forecast by Packaging, 2019 to 2034

Table 47: South Asia Market Value (US$ million) Forecast by Distribution Channel, 2019 to 2034

Table 48: South Asia Market Volume (MT) Forecast by Distribution Channel, 2019 to 2034

Table 49: Oceania Market Value (US$ million) Forecast by Country, 2019 to 2034

Table 50: Oceania Market Volume (MT) Forecast by Country, 2019 to 2034

Table 51: Oceania Market Value (US$ million) Forecast by Flavor, 2019 to 2034

Table 52: Oceania Market Volume (MT) Forecast by Flavor, 2019 to 2034

Table 53: Oceania Market Value (US$ million) Forecast by Packaging, 2019 to 2034

Table 54: Oceania Market Volume (MT) Forecast by Packaging, 2019 to 2034

Table 55: Oceania Market Value (US$ million) Forecast by Distribution Channel, 2019 to 2034

Table 56: Oceania Market Volume (MT) Forecast by Distribution Channel, 2019 to 2034

Table 57: Middle East and Africa Market Value (US$ million) Forecast by Country, 2019 to 2034

Table 58: Middle East and Africa Market Volume (MT) Forecast by Country, 2019 to 2034

Table 59: Middle East and Africa Market Value (US$ million) Forecast by Flavor, 2019 to 2034

Table 60: Middle East and Africa Market Volume (MT) Forecast by Flavor, 2019 to 2034

Table 61: Middle East and Africa Market Value (US$ million) Forecast by Packaging, 2019 to 2034

Table 62: Middle East and Africa Market Volume (MT) Forecast by Packaging, 2019 to 2034

Table 63: Middle East and Africa Market Value (US$ million) Forecast by Distribution Channel, 2019 to 2034

Table 64: Middle East and Africa Market Volume (MT) Forecast by Distribution Channel, 2019 to 2034

List of Charts

Figure 1: Global Market Value (US$ million) by Flavor, 2024 to 2034

Figure 2: Global Market Value (US$ million) by Packaging, 2024 to 2034

Figure 3: Global Market Value (US$ million) by Distribution Channel, 2024 to 2034

Figure 4: Global Market Value (US$ million) by Region, 2024 to 2034

Figure 5: Global Market Value (US$ million) Analysis by Region, 2019 to 2034

Figure 6: Global Market Volume (MT) Analysis by Region, 2019 to 2034

Figure 7: Global Market Value Share (%) and BPS Analysis by Region, 2024 to 2034

Figure 8: Global Market Y-o-Y Growth (%) Projections by Region, 2024 to 2034

Figure 9: Global Market Value (US$ million) Analysis by Flavor, 2019 to 2034

Figure 10: Global Market Volume (MT) Analysis by Flavor, 2019 to 2034

Figure 11: Global Market Value Share (%) and BPS Analysis by Flavor, 2024 to 2034

Figure 12: Global Market Y-o-Y Growth (%) Projections by Flavor, 2024 to 2034

Figure 13: Global Market Value (US$ million) Analysis by Packaging, 2019 to 2034

Figure 14: Global Market Volume (MT) Analysis by Packaging, 2019 to 2034

Figure 15: Global Market Value Share (%) and BPS Analysis by Packaging, 2024 to 2034

Figure 16: Global Market Y-o-Y Growth (%) Projections by Packaging, 2024 to 2034

Figure 17: Global Market Value (US$ million) Analysis by Distribution Channel, 2019 to 2034

Figure 18: Global Market Volume (MT) Analysis by Distribution Channel, 2019 to 2034

Figure 19: Global Market Value Share (%) and BPS Analysis by Distribution Channel, 2024 to 2034

Figure 20: Global Market Y-o-Y Growth (%) Projections by Distribution Channel, 2024 to 2034

Figure 21: Global Market Attractiveness by Flavor, 2024 to 2034

Figure 22: Global Market Attractiveness by Packaging, 2024 to 2034

Figure 23: Global Market Attractiveness by Distribution Channel, 2024 to 2034

Figure 24: Global Market Attractiveness by Region, 2024 to 2034

Figure 25: North America Market Value (US$ million) by Flavor, 2024 to 2034

Figure 26: North America Market Value (US$ million) by Packaging, 2024 to 2034

Figure 27: North America Market Value (US$ million) by Distribution Channel, 2024 to 2034

Figure 28: North America Market Value (US$ million) by Country, 2024 to 2034

Figure 29: North America Market Value (US$ million) Analysis by Country, 2019 to 2034

Figure 30: North America Market Volume (MT) Analysis by Country, 2019 to 2034

Figure 31: North America Market Value Share (%) and BPS Analysis by Country, 2024 to 2034

Figure 32: North America Market Y-o-Y Growth (%) Projections by Country, 2024 to 2034

Figure 33: North America Market Value (US$ million) Analysis by Flavor, 2019 to 2034

Figure 34: North America Market Volume (MT) Analysis by Flavor, 2019 to 2034

Figure 35: North America Market Value Share (%) and BPS Analysis by Flavor, 2024 to 2034

Figure 36: North America Market Y-o-Y Growth (%) Projections by Flavor, 2024 to 2034

Figure 37: North America Market Value (US$ million) Analysis by Packaging, 2019 to 2034

Figure 38: North America Market Volume (MT) Analysis by Packaging, 2019 to 2034

Figure 39: North America Market Value Share (%) and BPS Analysis by Packaging, 2024 to 2034

Figure 40: North America Market Y-o-Y Growth (%) Projections by Packaging, 2024 to 2034

Figure 41: North America Market Value (US$ million) Analysis by Distribution Channel, 2019 to 2034

Figure 42: North America Market Volume (MT) Analysis by Distribution Channel, 2019 to 2034

Figure 43: North America Market Value Share (%) and BPS Analysis by Distribution Channel, 2024 to 2034

Figure 44: North America Market Y-o-Y Growth (%) Projections by Distribution Channel, 2024 to 2034

Figure 45: North America Market Attractiveness by Flavor, 2024 to 2034

Figure 46: North America Market Attractiveness by Packaging, 2024 to 2034

Figure 47: North America Market Attractiveness by Distribution Channel, 2024 to 2034

Figure 48: North America Market Attractiveness by Country, 2024 to 2034

Figure 49: Latin America Market Value (US$ million) by Flavor, 2024 to 2034

Figure 50: Latin America Market Value (US$ million) by Packaging, 2024 to 2034

Figure 51: Latin America Market Value (US$ million) by Distribution Channel, 2024 to 2034

Figure 52: Latin America Market Value (US$ million) by Country, 2024 to 2034

Figure 53: Latin America Market Value (US$ million) Analysis by Country, 2019 to 2034

Figure 54: Latin America Market Volume (MT) Analysis by Country, 2019 to 2034

Figure 55: Latin America Market Value Share (%) and BPS Analysis by Country, 2024 to 2034

Figure 56: Latin America Market Y-o-Y Growth (%) Projections by Country, 2024 to 2034

Figure 57: Latin America Market Value (US$ million) Analysis by Flavor, 2019 to 2034

Figure 58: Latin America Market Volume (MT) Analysis by Flavor, 2019 to 2034

Figure 59: Latin America Market Value Share (%) and BPS Analysis by Flavor, 2024 to 2034

Figure 60: Latin America Market Y-o-Y Growth (%) Projections by Flavor, 2024 to 2034

Figure 61: Latin America Market Value (US$ million) Analysis by Packaging, 2019 to 2034

Figure 62: Latin America Market Volume (MT) Analysis by Packaging, 2019 to 2034

Figure 63: Latin America Market Value Share (%) and BPS Analysis by Packaging, 2024 to 2034

Figure 64: Latin America Market Y-o-Y Growth (%) Projections by Packaging, 2024 to 2034

Figure 65: Latin America Market Value (US$ million) Analysis by Distribution Channel, 2019 to 2034

Figure 66: Latin America Market Volume (MT) Analysis by Distribution Channel, 2019 to 2034

Figure 67: Latin America Market Value Share (%) and BPS Analysis by Distribution Channel, 2024 to 2034

Figure 68: Latin America Market Y-o-Y Growth (%) Projections by Distribution Channel, 2024 to 2034

Figure 69: Latin America Market Attractiveness by Flavor, 2024 to 2034

Figure 70: Latin America Market Attractiveness by Packaging, 2024 to 2034

Figure 71: Latin America Market Attractiveness by Distribution Channel, 2024 to 2034

Figure 72: Latin America Market Attractiveness by Country, 2024 to 2034

Figure 73: Europe Market Value (US$ million) by Flavor, 2024 to 2034

Figure 74: Europe Market Value (US$ million) by Packaging, 2024 to 2034

Figure 75: Europe Market Value (US$ million) by Distribution Channel, 2024 to 2034

Figure 76: Europe Market Value (US$ million) by Country, 2024 to 2034

Figure 77: Europe Market Value (US$ million) Analysis by Country, 2019 to 2034

Figure 78: Europe Market Volume (MT) Analysis by Country, 2019 to 2034

Figure 79: Europe Market Value Share (%) and BPS Analysis by Country, 2024 to 2034

Figure 80: Europe Market Y-o-Y Growth (%) Projections by Country, 2024 to 2034

Figure 81: Europe Market Value (US$ million) Analysis by Flavor, 2019 to 2034

Figure 82: Europe Market Volume (MT) Analysis by Flavor, 2019 to 2034

Figure 83: Europe Market Value Share (%) and BPS Analysis by Flavor, 2024 to 2034

Figure 84: Europe Market Y-o-Y Growth (%) Projections by Flavor, 2024 to 2034

Figure 85: Europe Market Value (US$ million) Analysis by Packaging, 2019 to 2034

Figure 86: Europe Market Volume (MT) Analysis by Packaging, 2019 to 2034

Figure 87: Europe Market Value Share (%) and BPS Analysis by Packaging, 2024 to 2034

Figure 88: Europe Market Y-o-Y Growth (%) Projections by Packaging, 2024 to 2034

Figure 89: Europe Market Value (US$ million) Analysis by Distribution Channel, 2019 to 2034

Figure 90: Europe Market Volume (MT) Analysis by Distribution Channel, 2019 to 2034

Figure 91: Europe Market Value Share (%) and BPS Analysis by Distribution Channel, 2024 to 2034

Figure 92: Europe Market Y-o-Y Growth (%) Projections by Distribution Channel, 2024 to 2034

Figure 93: Europe Market Attractiveness by Flavor, 2024 to 2034

Figure 94: Europe Market Attractiveness by Packaging, 2024 to 2034

Figure 95: Europe Market Attractiveness by Distribution Channel, 2024 to 2034

Figure 96: Europe Market Attractiveness by Country, 2024 to 2034

Figure 97: East Asia Market Value (US$ million) by Flavor, 2024 to 2034

Figure 98: East Asia Market Value (US$ million) by Packaging, 2024 to 2034

Figure 99: East Asia Market Value (US$ million) by Distribution Channel, 2024 to 2034

Figure 100: East Asia Market Value (US$ million) by Country, 2024 to 2034

Figure 101: East Asia Market Value (US$ million) Analysis by Country, 2019 to 2034

Figure 102: East Asia Market Volume (MT) Analysis by Country, 2019 to 2034

Figure 103: East Asia Market Value Share (%) and BPS Analysis by Country, 2024 to 2034

Figure 104: East Asia Market Y-o-Y Growth (%) Projections by Country, 2024 to 2034

Figure 105: East Asia Market Value (US$ million) Analysis by Flavor, 2019 to 2034

Figure 106: East Asia Market Volume (MT) Analysis by Flavor, 2019 to 2034

Figure 107: East Asia Market Value Share (%) and BPS Analysis by Flavor, 2024 to 2034

Figure 108: East Asia Market Y-o-Y Growth (%) Projections by Flavor, 2024 to 2034

Figure 109: East Asia Market Value (US$ million) Analysis by Packaging, 2019 to 2034

Figure 110: East Asia Market Volume (MT) Analysis by Packaging, 2019 to 2034

Figure 111: East Asia Market Value Share (%) and BPS Analysis by Packaging, 2024 to 2034

Figure 112: East Asia Market Y-o-Y Growth (%) Projections by Packaging, 2024 to 2034

Figure 113: East Asia Market Value (US$ million) Analysis by Distribution Channel, 2019 to 2034

Figure 114: East Asia Market Volume (MT) Analysis by Distribution Channel, 2019 to 2034

Figure 115: East Asia Market Value Share (%) and BPS Analysis by Distribution Channel, 2024 to 2034

Figure 116: East Asia Market Y-o-Y Growth (%) Projections by Distribution Channel, 2024 to 2034

Figure 117: East Asia Market Attractiveness by Flavor, 2024 to 2034

Figure 118: East Asia Market Attractiveness by Packaging, 2024 to 2034

Figure 119: East Asia Market Attractiveness by Distribution Channel, 2024 to 2034

Figure 120: East Asia Market Attractiveness by Country, 2024 to 2034

Figure 121: South Asia Market Value (US$ million) by Flavor, 2024 to 2034

Figure 122: South Asia Market Value (US$ million) by Packaging, 2024 to 2034

Figure 123: South Asia Market Value (US$ million) by Distribution Channel, 2024 to 2034

Figure 124: South Asia Market Value (US$ million) by Country, 2024 to 2034

Figure 125: South Asia Market Value (US$ million) Analysis by Country, 2019 to 2034

Figure 126: South Asia Market Volume (MT) Analysis by Country, 2019 to 2034

Figure 127: South Asia Market Value Share (%) and BPS Analysis by Country, 2024 to 2034

Figure 128: South Asia Market Y-o-Y Growth (%) Projections by Country, 2024 to 2034

Figure 129: South Asia Market Value (US$ million) Analysis by Flavor, 2019 to 2034

Figure 130: South Asia Market Volume (MT) Analysis by Flavor, 2019 to 2034

Figure 131: South Asia Market Value Share (%) and BPS Analysis by Flavor, 2024 to 2034

Figure 132: South Asia Market Y-o-Y Growth (%) Projections by Flavor, 2024 to 2034

Figure 133: South Asia Market Value (US$ million) Analysis by Packaging, 2019 to 2034

Figure 134: South Asia Market Volume (MT) Analysis by Packaging, 2019 to 2034

Figure 135: South Asia Market Value Share (%) and BPS Analysis by Packaging, 2024 to 2034

Figure 136: South Asia Market Y-o-Y Growth (%) Projections by Packaging, 2024 to 2034

Figure 137: South Asia Market Value (US$ million) Analysis by Distribution Channel, 2019 to 2034

Figure 138: South Asia Market Volume (MT) Analysis by Distribution Channel, 2019 to 2034

Figure 139: South Asia Market Value Share (%) and BPS Analysis by Distribution Channel, 2024 to 2034

Figure 140: South Asia Market Y-o-Y Growth (%) Projections by Distribution Channel, 2024 to 2034

Figure 141: South Asia Market Attractiveness by Flavor, 2024 to 2034

Figure 142: South Asia Market Attractiveness by Packaging, 2024 to 2034

Figure 143: South Asia Market Attractiveness by Distribution Channel, 2024 to 2034

Figure 144: South Asia Market Attractiveness by Country, 2024 to 2034

Figure 145: Oceania Market Value (US$ million) by Flavor, 2024 to 2034

Figure 146: Oceania Market Value (US$ million) by Packaging, 2024 to 2034

Figure 147: Oceania Market Value (US$ million) by Distribution Channel, 2024 to 2034

Figure 148: Oceania Market Value (US$ million) by Country, 2024 to 2034

Figure 149: Oceania Market Value (US$ million) Analysis by Country, 2019 to 2034

Figure 150: Oceania Market Volume (MT) Analysis by Country, 2019 to 2034

Figure 151: Oceania Market Value Share (%) and BPS Analysis by Country, 2024 to 2034

Figure 152: Oceania Market Y-o-Y Growth (%) Projections by Country, 2024 to 2034

Figure 153: Oceania Market Value (US$ million) Analysis by Flavor, 2019 to 2034

Figure 154: Oceania Market Volume (MT) Analysis by Flavor, 2019 to 2034

Figure 155: Oceania Market Value Share (%) and BPS Analysis by Flavor, 2024 to 2034

Figure 156: Oceania Market Y-o-Y Growth (%) Projections by Flavor, 2024 to 2034

Figure 157: Oceania Market Value (US$ million) Analysis by Packaging, 2019 to 2034

Figure 158: Oceania Market Volume (MT) Analysis by Packaging, 2019 to 2034

Figure 159: Oceania Market Value Share (%) and BPS Analysis by Packaging, 2024 to 2034

Figure 160: Oceania Market Y-o-Y Growth (%) Projections by Packaging, 2024 to 2034

Figure 161: Oceania Market Value (US$ million) Analysis by Distribution Channel, 2019 to 2034

Figure 162: Oceania Market Volume (MT) Analysis by Distribution Channel, 2019 to 2034

Figure 163: Oceania Market Value Share (%) and BPS Analysis by Distribution Channel, 2024 to 2034

Figure 164: Oceania Market Y-o-Y Growth (%) Projections by Distribution Channel, 2024 to 2034

Figure 165: Oceania Market Attractiveness by Flavor, 2024 to 2034

Figure 166: Oceania Market Attractiveness by Packaging, 2024 to 2034

Figure 167: Oceania Market Attractiveness by Distribution Channel, 2024 to 2034

Figure 168: Oceania Market Attractiveness by Country, 2024 to 2034

Figure 169: Middle East and Africa Market Value (US$ million) by Flavor, 2024 to 2034

Figure 170: Middle East and Africa Market Value (US$ million) by Packaging, 2024 to 2034

Figure 171: Middle East and Africa Market Value (US$ million) by Distribution Channel, 2024 to 2034

Figure 172: Middle East and Africa Market Value (US$ million) by Country, 2024 to 2034

Figure 173: Middle East and Africa Market Value (US$ million) Analysis by Country, 2019 to 2034

Figure 174: Middle East and Africa Market Volume (MT) Analysis by Country, 2019 to 2034

Figure 175: Middle East and Africa Market Value Share (%) and BPS Analysis by Country, 2024 to 2034

Figure 176: Middle East and Africa Market Y-o-Y Growth (%) Projections by Country, 2024 to 2034

Figure 177: Middle East and Africa Market Value (US$ million) Analysis by Flavor, 2019 to 2034

Figure 178: Middle East and Africa Market Volume (MT) Analysis by Flavor, 2019 to 2034

Figure 179: Middle East and Africa Market Value Share (%) and BPS Analysis by Flavor, 2024 to 2034

Figure 180: Middle East and Africa Market Y-o-Y Growth (%) Projections by Flavor, 2024 to 2034

Figure 181: Middle East and Africa Market Value (US$ million) Analysis by Packaging, 2019 to 2034

Figure 182: Middle East and Africa Market Volume (MT) Analysis by Packaging, 2019 to 2034

Figure 183: Middle East and Africa Market Value Share (%) and BPS Analysis by Packaging, 2024 to 2034

Figure 184: Middle East and Africa Market Y-o-Y Growth (%) Projections by Packaging, 2024 to 2034

Figure 185: Middle East and Africa Market Value (US$ million) Analysis by Distribution Channel, 2019 to 2034

Figure 186: Middle East and Africa Market Volume (MT) Analysis by Distribution Channel, 2019 to 2034

Figure 187: Middle East and Africa Market Value Share (%) and BPS Analysis by Distribution Channel, 2024 to 2034

Figure 188: Middle East and Africa Market Y-o-Y Growth (%) Projections by Distribution Channel, 2024 to 2034

Figure 189: Middle East and Africa Market Attractiveness by Flavor, 2024 to 2034

Figure 190: Middle East and Africa Market Attractiveness by Packaging, 2024 to 2034

Figure 191: Middle East and Africa Market Attractiveness by Distribution Channel, 2024 to 2034

Figure 192: Middle East and Africa Market Attractiveness by Country, 2024 to 2034

Recommendations

Food and Beverage

Infant Formula Market

Published : March 2024

Food and Beverage

A2 Lactose-free Milk Market

Published : December 2023

Food and Beverage

A2 Infant Formula Market

Published : December 2023

Food and Beverage

A2 Milk Market

Published : July 2023

Explore Food and Beverage Insights

View Reports