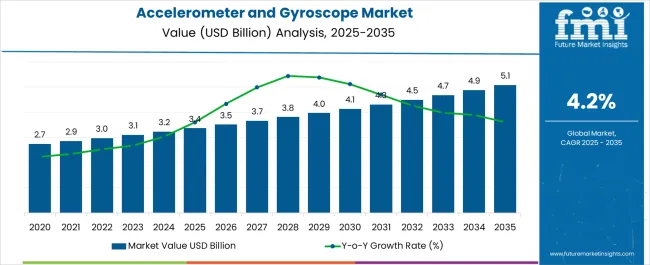
The accelerometer and gyroscope market is estimated to be valued at USD 3.4 billion in 2025 and is projected to reach USD 5.1 billion by 2035, registering a compound annual growth rate (CAGR) of 4.2% over the forecast period.
The market operates within a complex regulatory framework that distinguishes between consumer-grade sensors and precision instruments capable of military applications. Market dynamics reveal persistent challenges in component classification processes where manufacturers must navigate export control determinations that significantly influence product development strategies and international distribution channels. Engineering teams encounter operational friction between commercial product specifications and military-grade performance thresholds that trigger additional regulatory oversight and licensing requirements.
Procurement processes demonstrate how different performance specifications create distinct market segments with varying regulatory compliance requirements. Consumer electronics manufacturers typically utilize lower-precision sensors that fall below export control thresholds, while aerospace and defense contractors require high-accuracy devices subject to comprehensive licensing procedures. This performance-based regulatory structure creates competitive dynamics where sensor manufacturers must carefully balance technical capabilities against compliance complexity and market accessibility considerations.
The market demonstrates increasing integration between accelerometer and gyroscope technologies in multi-axis sensor packages that complicate regulatory evaluation processes. System integrators must assess combined sensor performance characteristics against export control criteria, while individual component classifications may not reflect integrated system capabilities. These evaluation complexities create procurement challenges for manufacturers developing products that incorporate multiple sensor technologies with different regulatory classifications.
Supply chain management reveals unique challenges related to component sourcing and international distribution for products subject to export control requirements. Manufacturers must implement enhanced tracking systems for controlled sensors while maintaining separate distribution channels for commercial-grade devices. These operational requirements create cost implications that influence competitive positioning, particularly for companies serving both commercial and defense market segments with similar sensor technologies.
Quality assurance processes show how regulatory compliance requirements influence manufacturing procedures and testing protocols for precision sensors. Manufacturers developing products near regulatory thresholds must implement enhanced calibration procedures and documentation systems to support export control determinations. These compliance requirements often conflict with commercial manufacturing efficiency objectives, creating operational tensions between regulatory departments and production teams regarding optimal manufacturing processes.
Market trends indicate growing demand for sensor fusion technologies that combine accelerometer and gyroscope data with other measurement systems, creating additional regulatory evaluation complexity. Product developers must coordinate between different sensor types with varying export control classifications, while system-level performance characteristics may trigger additional regulatory scrutiny. These integration challenges influence product architecture decisions and often require extensive regulatory consultation during development phases.

| Metric | Value |
|---|---|
| Accelerometer and Gyroscope Market Estimated Value in (2025 E) | USD 3.4 billion |
| Accelerometer and Gyroscope Market Forecast Value in (2035 F) | USD 5.1 billion |
| Forecast CAGR (2025 to 2035) | 4.2% |
The accelerometer and gyroscope market is witnessing strong expansion owing to rising adoption of motion sensing technologies across consumer electronics, automotive systems, and industrial automation. Increasing demand for compact and energy efficient sensors in smartphones, wearables, and gaming devices has accelerated deployment.
The growing trend of autonomous vehicles and advanced driver assistance systems is further driving integration of high precision accelerometers and gyroscopes. Technological advancements in microelectromechanical systems have improved accuracy, reduced cost, and enhanced durability, making these sensors accessible across multiple industries.
Additionally, the expansion of IoT ecosystems and smart manufacturing initiatives has reinforced their relevance in real time monitoring and predictive maintenance. The market outlook remains positive as industries increasingly prioritize miniaturized, cost effective, and highly reliable sensor solutions to support innovation in mobility, connectivity, and automation.
The accelerometer segment is projected to account for 62.30% of the total revenue by 2025 within the type category, making it the leading segment. This growth is being driven by rising demand for compact motion detection sensors in smartphones, wearables, and gaming consoles.
Their ability to measure linear acceleration with high precision has made them indispensable in consumer devices. Additionally, applications in automotive crash detection and navigation systems have supported adoption.
Continuous improvements in MEMS design and integration into multi sensor modules have further reinforced accelerometers as the dominant segment.
The 1 axis dimension segment is expected to represent 45.60% of total revenue by 2025 within the dimension category, positioning it as the most prominent segment. This dominance is attributed to cost efficiency, simpler integration, and suitability for applications requiring single directional motion measurement.
Widespread adoption in basic industrial monitoring, gaming, and entry level consumer electronics has supported its market share.
Additionally, lower power consumption and ease of design have made 1 axis solutions highly attractive for manufacturers prioritizing affordability and efficiency.
The consumer electronics segment is anticipated to hold 38.90% of market revenue by 2025 within the industrial vertical category, making it the largest end use segment. This is due to the increasing penetration of smartphones, tablets, and wearable devices globally, all of which rely on accelerometers and gyroscopes for motion sensing, screen orientation, and gaming applications.
Continuous innovation in augmented reality and virtual reality technologies has further supported demand.
The consumer electronics sector’s focus on miniaturization, performance optimization, and user experience enhancement continues to drive the widespread integration of these sensors, reinforcing its dominance in the market.
According to Future Market Insights, global accelerometer and gyroscope sales are projected to surge at 4.2% CAGR between 2025 and 2035, in comparison to 5.1% CAGR recorded during the historical period from 2020 to 2025.
Increasing demand from industries such as automotive, defense, healthcare, and consumer electronics is a prominent factor driving the global accelerometer and gyroscope market.
Accelerometers and gyroscopes have become widely used devices across various industries for measuring motion. They are frequently employed in weapon testing, seismic measurements, safety airbags, and testing of anti-lock brake systems.
Rapid expansion of industries such as aerospace & defense, automotive, and healthcare is expected to boost the global accelerometer and gyroscope market during the forecast period.
Growing Popularity of MEMS Gyroscope and Accelerometer Boosting Market
Microelectronic mechanical system (MEMS) gyroscopes and accelerometers have become essential parts for enhancing automotive safety features. The development of autonomous driving is projected to spur need for these sensors for safety-related applications, opening new market opportunities.
Due to strict standards, automakers are being pressured to utilize the most recent MEMS sensor-based systems to reduce chances of accidents and improve passenger safety. As a result, automotive manufacturers are employing MEMS accelerometers in safety systems such as airbag deployment. This will boost the global gyroscope and accelerometer market.
Similarly, increasing usage of high-acceleration accelerometers in small-diameter missiles, automated aircraft, and underwater navigation systems will elevate accelerometer and gyroscope sales during the projection period.
Low Accuracy of Accelerometer and Gyroscopes and Lack of Standards Limiting Market Expansion
Despite several benefits, there are a few limitations and obstacles that would slow the expansion of the market as a whole. The market's expansion is being hampered by a shortage of qualified employees as well as by a lack of standards and procedures.
Similarly, the market for accelerometers is experiencing numerous significant issues as a result of the restricted precision of accelerometers in specific industries. This poses significant problems because the inertial navigation system is used in conjunction with accelerometers and gyroscopes in complex systems such as spacecraft, satellites, and missiles.
Further, frequent maintenance and the associated expenses could be obstacles to expansion of accelerometer and gyroscope industry.

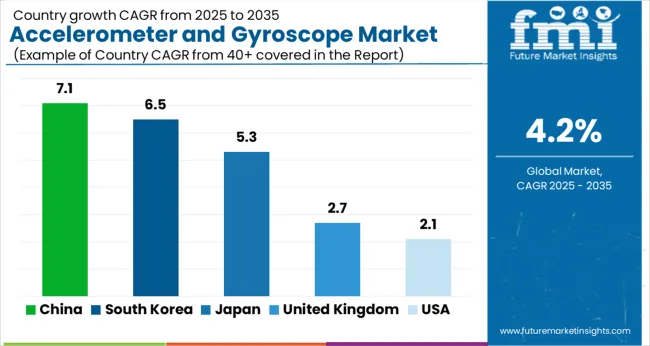
| Country | USA |
|---|---|
| Historical CAGR (2020 to 2025) | 2.1% |
| Anticipated CAGR (2025 to 2035) | 3.1% |
| Market Value (2035) | USD 5.1 million |
| Country | United Kingdom |
|---|---|
| Historical CAGR (2020 to 2025) | 0.7% |
| Anticipated CAGR (2025 to 2035) | 2.7% |
| Market Value (2035) | USD 123.2 million |
| Country | China |
|---|---|
| Historical CAGR (2020 to 2025) | 5.6% |
| Anticipated CAGR (2025 to 2035) | 7.1% |
| Market Value (2035) | USD 1.2 billion |
| Country | Japan |
|---|---|
| Historical CAGR (2020 to 2025) | 4.4% |
| Anticipated CAGR (2025 to 2035) | 5.3% |
| Market Value (2035) | USD 739.8 million |
| Country | South Korea |
|---|---|
| Historical CAGR (2020 to 2025) | 4.6% |
| Anticipated CAGR (2025 to 2035) | 6.5% |
| Market Value (2035) | USD 289.0 million |

Booming Aerospace and Defense Sector to Boost Accelerometer and Gyroscope Sales in the USA
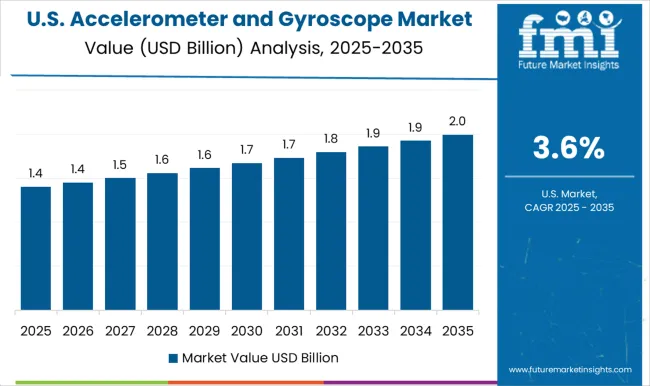
According to Future Market Insights, the USA accelerometer and gyroscope market is expected to witness a growth rate of 3.1% CAGR during the forecast period, reaching a total valuation of USD 5.1 million by 2035.
Between 2025 and 2035, the United States market is forecast to generate an absolute $ growth of USD 2.7 million. The accelerometer and gyroscope device industry in the United States of America witnessed a CAGR of 2.1% during the historical period from 2020 to 2025.
Rapid expansion of aerospace & defense sector due to increasing government spending and high adoption of advanced technologies are key factors driving accelerometer and gyroscope demand across the USA.
In recent years, there has been a dramatic increase in military spending across the United States. For instance, as per the EXECUTIVEGOV, the USA defense budget and military spending reached a colossal amount of USD 3.2 billion in 2024. This in turn is positively influencing accelerometer and gyroscope demand as these devices are being increasingly used in aircraft, submarines, ships, etc.
Similarly, increasing production and sales of consumer electronics and strong presence of leading accelerometer and gyroscope manufacturers that are constantly striving to introduce new products will bode well for the USA market.
Several USA-based companies are launching new products into the market to meet end user demand. For example, in April 2024, new small inertial measuring devices, the HG1125 and HG1126 from Honeywell, were released.
The company's goal with this introduction was to give its clients industry-leading precision and durability to withstand high-shock settings. The new devices also have affordable prices and have both industrial and military uses.
Rapid Expansion of Automotive and Consumer Electronics Industries Propelling Demand in China
The China accelerometer and gyroscope market is forecast to exhibit a CAGR of 5.6% between 2025 and 2035, reaching a valuation of USD 1.2 billion. Overall accelerometer and gyroscope sales in the country are likely to create an absolute $ opportunity of USD 505.4 million during the assessment period.
Accelerometer and gyroscope demand across China is driven by robust growth of electronics and automotive industries, favorable government support, and high military spending. China is one of the leading consumers of accelerometers and gyroscopes owing to the rising usage of these devices in defense, automotive and industrial sectors.
Further, heavy presence of leading players such as Skymems INC and availability of advanced products at lower prices will aid in the expansion of accelerometer and gyroscope industry across China.
Accelerometer Remains the Top Selling Type Worldwide
Based on type, the global accelerometer and gyroscope industry is segmented into accelerometer and gyroscope. Among these, accelerometer segment holds a significant market share and it is likely to retain its dominance during the assessment period. This is attributed to rising application of accelerometers across various industries, especially automotive.
FMI predicts the accelerometer segment to accelerate at 4.1% CAGR between 2025 and 2035, generating significant revenues by the end of 2035. During the historical period from 2020 to 2025, the accelerometer segment grew at 4.9% CAGR.
Accelerometers are devices that measure proper acceleration and are being increasingly used in various electronic devices, smartphones, and wearable devices. They also find usage in biomedical applications.
Rising production and sales of consumer electronics, automobiles, medical devices, and other electronic items that use accelerometers will boost growth of the target segment during the forecast period.

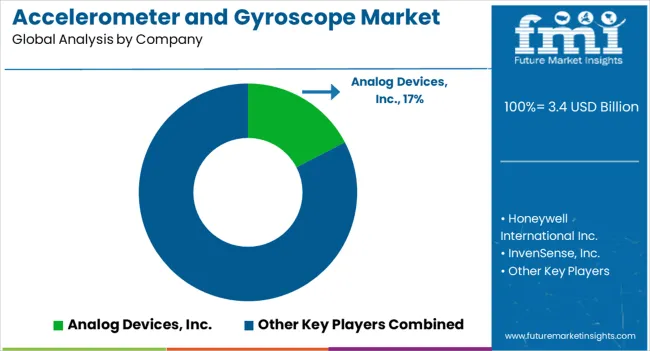
The Accelerometer and Gyroscope Market is witnessing steady growth as demand rises across automotive, consumer electronics, aerospace, and industrial automation sectors. Leading innovators such as Analog Devices Inc., Honeywell International Inc., and Robert Bosch GmbH are driving advancements in high-performance motion sensing technologies, focusing on precision, miniaturization, and power efficiency. Their solutions are integrated into safety-critical systems such as automotive stability control, navigation, and industrial robotics, where reliability and accuracy are essential.
STMicroelectronics N.V., NXP Semiconductors N.V., and Murata Manufacturing Co. Ltd. are leading suppliers of MEMS-based accelerometers and gyroscopes for smartphones, wearables, and IoT devices. Their focus on low-power design and compact packaging supports growing demand for sensor fusion technologies used in gesture recognition, augmented reality, and autonomous mobility.
Aerospace and defense applications are propelled by companies such as Northrop Grumman LITEF GmbH, Sensonor AS, and Fizoptika Corp., which specialize in tactical-grade and navigation-grade inertial sensors. These firms are leveraging fiber-optic and ring laser technologies to deliver ultra-precise performance in GPS-denied environments.
InvenSense Inc. and Kionix Inc. continue to enhance multi-axis MEMS sensors for consumer and industrial electronics, while Innalabs Holding Inc. and Colibrys Ltd. focus on high-stability sensors for geotechnical and defense applications.
The market trend is moving toward sensor fusion, AI-based calibration, and integration within system-on-chip (SoC) architectures. With rising adoption in electric vehicles, drones, and smart manufacturing, accelerometers and gyroscopes are becoming central to next-generation motion intelligence and navigation ecosystems.
| Attribute | Details |
|---|---|
| Estimated Market Size (2025) | USD 3.4 billion |
| Projected Market Size (2035) | USD 5.1 billion |
| Anticipated Growth Rate (2025 to 2035) | 4.2% CAGR |
| Forecast Period | 2025 to 2035 |
| Historical Data Available for | 2020 to 2025 |
| Market Analysis | USD Million for Value and Tons for Volume |
| Key Countries Covered | USA, Canada, Brazil, Mexico, Germany, Italy, France, United Kingdom, Spain, BENELUX, Russia, China, Japan, South Korea, India, ASEAN, Australia and New Zealand, Gulf Co-operation Council Countries, Türkiye, Northern Africa, and South Africa |
| Key Segments Covered | Type, Dimension, Industrial Vertical Grade, and Region |
| Key Companies Profiled |
Analog Devices Inc., Honeywell International Inc., InvenSense Inc., Murata Manufacturing Co. Ltd., Northrop Grumman LITEF GmbH, NXP Semiconductors N.V., Robert Bosch GmbH, Sensonor AS, STMicroelectronics N.V., Fizoptika Corp., Innalabs Holding Inc., Kionix Inc., and Colibrys Ltd. |
| Report Coverage | Market Forecast, Company Share Analysis, Competition Intelligence, DROT Analysis, Market Dynamics and Challenges, and Strategic Growth Initiatives |
The global accelerometer and gyroscope market is estimated to be valued at USD 3.4 billion in 2025.
The market size for the accelerometer and gyroscope market is projected to reach USD 5.1 billion by 2035.
The accelerometer and gyroscope market is expected to grow at a 4.2% CAGR between 2025 and 2035.
The key product types in accelerometer and gyroscope market are accelerometer and gyroscope.
In terms of dimension, 1-axis segment to command 45.6% share in the accelerometer and gyroscope market in 2025.


Our Research Products

The "Full Research Suite" delivers actionable market intel, deep dives on markets or technologies, so clients act faster, cut risk, and unlock growth.

The Leaderboard benchmarks and ranks top vendors, classifying them as Established Leaders, Leading Challengers, or Disruptors & Challengers.

Locates where complements amplify value and substitutes erode it, forecasting net impact by horizon

We deliver granular, decision-grade intel: market sizing, 5-year forecasts, pricing, adoption, usage, revenue, and operational KPIs—plus competitor tracking, regulation, and value chains—across 60 countries broadly.

Spot the shifts before they hit your P&L. We track inflection points, adoption curves, pricing moves, and ecosystem plays to show where demand is heading, why it is changing, and what to do next across high-growth markets and disruptive tech

Real-time reads of user behavior. We track shifting priorities, perceptions of today’s and next-gen services, and provider experience, then pace how fast tech moves from trial to adoption, blending buyer, consumer, and channel inputs with social signals (#WhySwitch, #UX).

Partner with our analyst team to build a custom report designed around your business priorities. From analysing market trends to assessing competitors or crafting bespoke datasets, we tailor insights to your needs.
Supplier Intelligence
Discovery & Profiling
Capacity & Footprint
Performance & Risk
Compliance & Governance
Commercial Readiness
Who Supplies Whom
Scorecards & Shortlists
Playbooks & Docs
Category Intelligence
Definition & Scope
Demand & Use Cases
Cost Drivers
Market Structure
Supply Chain Map
Trade & Policy
Operating Norms
Deliverables
Buyer Intelligence
Account Basics
Spend & Scope
Procurement Model
Vendor Requirements
Terms & Policies
Entry Strategy
Pain Points & Triggers
Outputs
Pricing Analysis
Benchmarks
Trends
Should-Cost
Indexation
Landed Cost
Commercial Terms
Deliverables
Brand Analysis
Positioning & Value Prop
Share & Presence
Customer Evidence
Go-to-Market
Digital & Reputation
Compliance & Trust
KPIs & Gaps
Outputs
Full Research Suite comprises of:
Market outlook & trends analysis
Interviews & case studies
Strategic recommendations
Vendor profiles & capabilities analysis
5-year forecasts
8 regions and 60+ country-level data splits
Market segment data splits
12 months of continuous data updates
DELIVERED AS:
PDF EXCEL ONLINE
Piezoelectric Accelerometer Market Size and Share Forecast Outlook 2025 to 2035
Android Automotive OS (AAOS) Market Size and Share Forecast Outlook 2025 to 2035
Anderson Cascade Impactor Market Size and Share Forecast Outlook 2025 to 2035
Andersen-Tawil Syndrome Treatment Market Trends - Growth & Future Prospects 2025 to 2035
Andro Supplements Market
Candle Filter Cartridges Market Size and Share Forecast Outlook 2025 to 2035
Handheld Electrostatic Meter Market Size and Share Forecast Outlook 2025 to 2035
Hand Towel Automatic Folding Machine Market Size and Share Forecast Outlook 2025 to 2035
Handheld Ultrasound Scanner Market Size and Share Forecast Outlook 2025 to 2035
Handheld Tagging Gun Market Forecast and Outlook 2025 to 2035
Handheld Imaging Systems Market Size and Share Forecast Outlook 2025 to 2035
Sandwich Panel System Market Size and Share Forecast Outlook 2025 to 2035
Hand Tools Market Size and Share Forecast Outlook 2025 to 2035
Land Survey Equipment Market Size and Share Forecast Outlook 2025 to 2035
Handloom Product Market Size and Share Forecast Outlook 2025 to 2035
Band File Sander Belts Market Size and Share Forecast Outlook 2025 to 2035
Handheld XRF Analyzers Market Size and Share Forecast Outlook 2025 to 2035
Sand Abrasion Tester Market Size and Share Forecast Outlook 2025 to 2035
Sand Testing Equipments Market Size and Share Forecast Outlook 2025 to 2035
Landscape Lighting Market Size and Share Forecast Outlook 2025 to 2035

Thank you!
You will receive an email from our Business Development Manager. Please be sure to check your SPAM/JUNK folder too.
Chat With
MaRIA