Acoustic Vehicle Alerting System Market Size, Share, and Forecast Outlook 2025 to 2035

The global acoustic vehicle alerting system (AVAS) market is anticipated to reach 2.5 billion in 2025 and 10.1 billion by 2035, expanding at a CAGR of 15% with a multiplying factor of about 4 over the decade. Inflection point mapping highlights the phases where regulatory changes, technology adoption, and market acceptance drive accelerated growth.
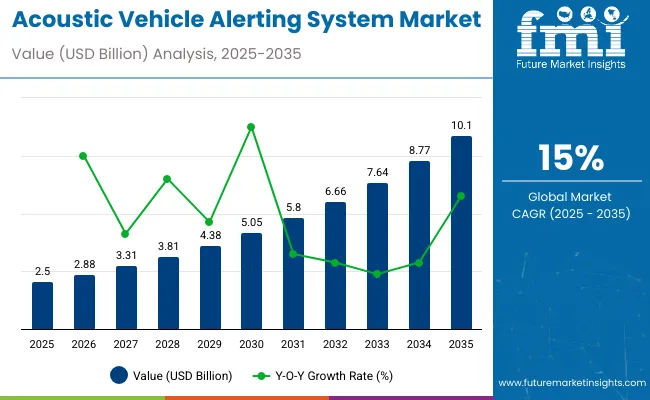
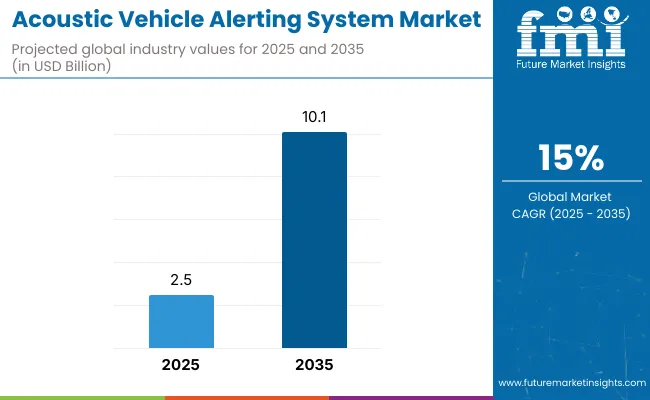
Acoustic Vehicle Alerting System Market Value Analysis

Quick stats of acoustic vehicle alerting system market

  • Acoustic vehicle alerting system market size (2025): USD 2.5 billion
  • Projected acoustic vehicle alerting system market size (2035): USD 10.1 billion
  • Forecast CAGR of acoustic vehicle alerting system market (2025 to 2035): 15%
  • Leading segment of acoustic vehicle alerting system market (2025): Passenger vehicles
  • Key growth regions of acoustic vehicle alerting system market: North America, Europe, Asia Pacific
  • Top key players of acoustic vehicle alerting system market: Toyota Motor Corporation, Honda Motor Co Ltd, Volkswagen AG
  • Leading player share of acoustic vehicle alerting system market (2025): Toyota Motor Corporation - 25%

Acoustic Vehicle Alerting System Market

Metric Value
Estimated Value in (2025E) USD 2.5 billion
Forecast Value in (2035F) USD 10.1 billion
Forecast CAGR (2025 to 2035) 15%

The first inflection point emerged when global safety authorities mandated sound systems for electric and hybrid vehicles to improve pedestrian awareness. This regulatory push created the foundation for rapid adoption.

A second inflection point is expected around the early 2030s as manufacturers integrate advanced sound design technologies, enabling customizable and adaptive acoustic alerts that enhance both safety and brand differentiation. Widespread use of electric vehicles, combined with advancements in digital signal processing, will further accelerate adoption.

By 2035, with the market reaching 10.1 billion, inflection point mapping shows a transition from regulatory compliance to value-driven adoption, where AVAS becomes a standard feature tied to user experience and vehicle identity. The progression across these points demonstrates how regulation, consumer expectations, and technological innovation interact to define growth pathways and position AVAS as an integral part of future mobility ecosystems.

The AVAS market is influenced by several parent sectors. Automotive electronics and vehicle safety systems account for around 33%, as alert systems are integrated into electric and hybrid vehicles. Vehicle manufacturing and assembly contributes roughly 30%, driven by new EV launches and regulatory requirements.

Sound engineering and acoustic devices represent about 17%, supplying speakers, tone generators, and control modules. Software platforms and connectivity solutions make up approximately 12%, enabling adaptive sound modulation and integration with driver assistance systems. Regulatory compliance and aftermarket services account for around 8%, supporting retrofits, testing, and certification for safety standards.

The market is advancing with adaptive sound technologies, energy-efficient designs, and regulatory alignment. Automakers are introducing customizable sound profiles that adjust volume and tone depending on vehicle speed, proximity to pedestrians, and environmental noise.

Electric and hybrid vehicle adoption is accelerating AVAS deployment, as silent vehicles need audible alerts for safety. Compact, lightweight, and low-power alert modules are increasingly preferred. Collaboration between car manufacturers, audio technology providers, and safety authorities is driving standardization, improving system performance, and ensuring global compliance. Integration with smart vehicle platforms enables real-time adjustment and predictive safety alerts.

Top Acoustic Vehicle Alerting System Market Dynamics

The global acoustic vehicle alerting system market is projected to reach USD 2.5 billion in 2025, with a strong CAGR of 15%, reflecting increasing demand for pedestrian safety solutions in electric and hybrid vehicles. Regulatory mandates in Europe, North America, and Asia require sound-emitting devices for vehicles traveling below 30 km/h, driving adoption.

Sales are highest in passenger electric cars, while commercial electric buses and delivery vans are gaining traction. Integration with advanced driver-assistance systems is enhancing system functionality.

Driving Force Safety Regulations and EV Growth

The primary driver is regulatory compliance, with over 40 countries mandating AVAS on electric and hybrid vehicles. Electric passenger cars represent nearly 60% of adoption due to low inherent engine noise. AVAS adoption enhances pedestrian and cyclist safety, reducing accidents in urban areas.

Integration with vehicle control systems allows variable sound output based on speed and environment. OEMs are increasingly offering AVAS as standard equipment in EV and hybrid models to meet compliance while improving brand safety perception.

  • Regulatory mandates cover speeds below 30 km/h, enforcing system installation.
  • Passenger electric cars contribute around 60% of AVAS adoption.
  • Variable frequency AVAS reduces noise pollution while maintaining pedestrian awareness.

Growth Avenue Advanced Signal Technology

Manufacturers are developing directional sound systems and multi-frequency AVAS for enhanced safety without contributing to urban noise. Compact, lightweight units reduce vehicle weight by 0.5-1 kg per system, improving energy efficiency. Software-controlled sound profiles allow OEMs to customize alerts by model and region.

Integration with autonomous driving systems and pedestrian detection enhances response times. AVAS systems with modular speakers allow easy replacement and upgrades, extending lifecycle and reducing maintenance costs.

  • Directional AVAS improves pedestrian localization accuracy.
  • Multi-frequency units enhance detection across diverse urban sound environments.
  • Modular designs allow easy replacement and lifecycle extension.

Emerging Trend Smart Connectivity and IoT Integration

Connected AVAS units are being linked to vehicle telematics, enabling real-time monitoring of sound output and system health. Some units now include adaptive volume control, adjusting sound intensity based on ambient noise levels. Predictive maintenance notifications via vehicle diagnostics reduce downtime and warranty claims.

Integration with IoT-enabled fleet management systems allows operators to track AVAS performance across multiple vehicles. These smart features are increasingly demanded by fleet operators and premium OEMs, enhancing safety compliance and operational reliability.

  • Adaptive volume AVAS adjusts intensity based on surrounding noise.
  • Predictive maintenance reduces unexpected service events by 10-12%.
  • IoT-enabled fleets allow remote monitoring and performance analytics.

Market Challenge Cost and Integration Complexity

AVAS unit costs, ranging from USD 250 to USD 450, add incremental costs to EV and hybrid vehicle pricing. Integration into existing vehicle electronics and chassis can require additional calibration, increasing engineering hours by 5-8%.

OEMs face supply constraints in speaker components, amplifiers, and control electronics, extending lead times by 6-10 weeks. Smaller vehicle manufacturers find compliance cost-prohibitive, limiting adoption in emerging markets. Regulatory differences across countries also increase design complexity, requiring multiple sound profiles and certifications.

  • Unit cost of USD 250-450 adds incremental price to vehicles.
  • Integration and calibration increase engineering hours by 5-8%.
  • Component supply constraints can extend lead times by 6-10 weeks.

Analyzing Acoustic Vehicle Alerting System Market by Top Investment Segments

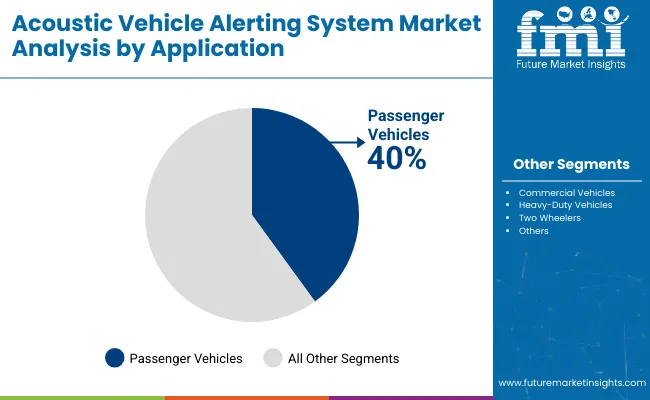
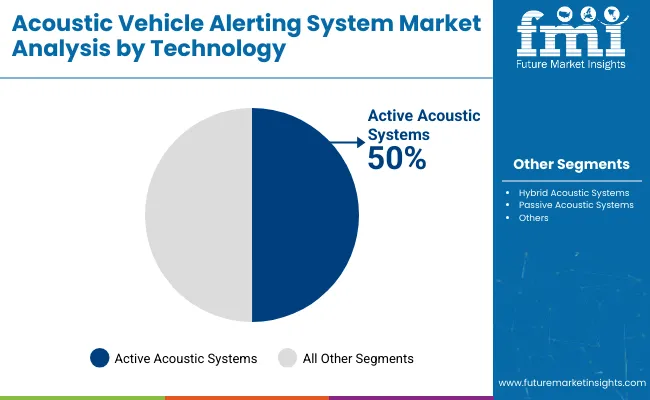
The Acoustic Vehicle Alerting System market is shaped by application, technology, vehicle type, and end user. Passenger vehicles dominate demand, accounting for 40% of usage, followed by commercial and heavy-duty vehicles. Active acoustic systems capture 50% of the technology market, providing enhanced sound generation for low-speed electric and hybrid vehicles. Key players such as Bosch, Continental, Denso, and Valeo focus on integrating high-efficiency acoustic modules, customizable sound profiles, and compliance with pedestrian safety standards across global fleets.
Passenger vehicles lead AVAS Market by Application

Acoustic Vehicle Alerting System Market By Application

Passenger vehicles account for 40% of AVAS demand, reflecting regulatory pressure for pedestrian safety in urban environments. Commercial vehicles follow with 25%, heavy-duty vehicles 20%, and two-wheelers 15%. Passenger EVs and hybrids utilize AVAS for low-speed sound generation under 20 km/h to alert pedestrians.

Companies like Bosch, Valeo, and Denso design compact, energy-efficient systems tailored for passenger cars, ensuring minimal impact on battery life. Urban mobility trends, city noise regulations, and pedestrian safety standards drive adoption. Passenger AVAS systems often feature adjustable sound profiles for speed-dependent alerts and customizable tones.
  • Average AVAS sound level for passenger vehicles: 56-68 dB.
  • Deployment in electric passenger vehicles increased by 35% between 2023-2025.
  • AVAS units in passenger cars typically weigh 1.5-2.5 kg.

Active Acoustic Systems likely to Dominate by Technology

Acoustic Vehicle Alerting System Market By Technology

Active acoustic systems hold 50% share in AVAS technology due to superior real-time sound generation and programmable features. Hybrid systems capture 30% and passive systems 20%. Active systems use speakers and amplifiers to emit variable frequency sounds, adapting to vehicle speed and ambient noise.

Valeo, Continental, Bosch, and Denso integrate active systems into EVs and hybrids for compliance with UNECE R138 standards. These systems improve pedestrian detection in urban areas while minimizing energy consumption. Growth is also driven by smart city initiatives requiring enhanced safety features for low-speed urban mobility.
  • Active systems can modulate sound frequencies between 2-5 kHz for pedestrian awareness.
  • Power consumption averages 15-25 W per AVAS unit.
  • Active AVAS adoption is projected to grow by 18% CAGR through 2027.

Electric vehicles lead AVAS Market by Vehicle Type

Acoustic Vehicle Alerting System Market By Vehicle Type

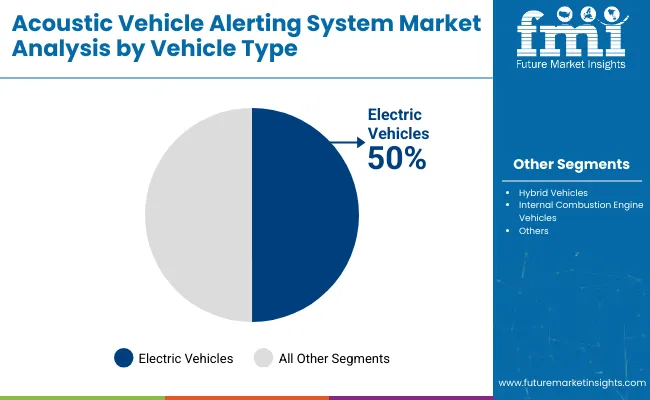
Electric vehicles account for 50% of AVAS adoption as silent operation at low speeds necessitates pedestrian alerting. Hybrid vehicles follow at 30%, and ICE vehicles at 20%, primarily for regulatory compliance in urban zones. EV manufacturers, including Tesla, Nissan, BMW, and Hyundai, integrate AVAS as standard equipment for new models.

AVAS modules are typically positioned at the front and rear of the vehicle, producing directional sound for safety. The increasing share of EVs in global fleets, particularly in Europe and North America, accelerates AVAS deployment, while hybrids and plug-in hybrids adopt AVAS selectively depending on low-speed electric operation.
  • Typical AVAS range in EVs: 0-20 km/h for active sound emission.
  • Average installation cost per vehicle: $80-120 for OEM units.
  • By 2026, over 60% of newly sold EVs globally will feature AVAS.

Automobile manufacturers lead AVAS Market by End User

Acoustic Vehicle Alerting System Market By End User

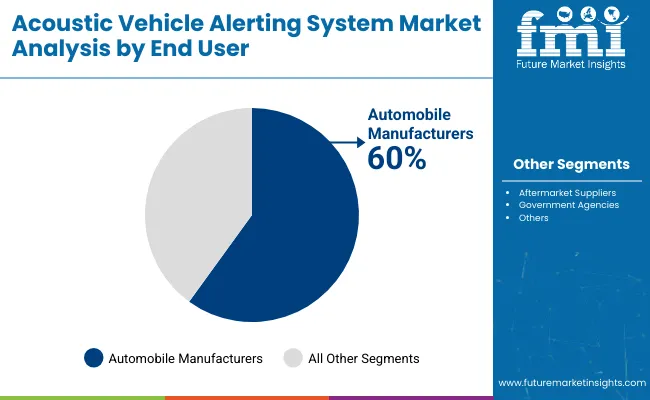
Automobile manufacturers account for 60% of AVAS demand, incorporating the systems during production to meet global pedestrian safety regulations. Aftermarket suppliers contribute 25%, providing retrofit solutions for older EVs and hybrids, while government agencies account for 15%, funding urban safety and fleet retrofitting programs.

Major AVAS suppliers such as Bosch, Continental, Valeo, and Denso partner with OEMs for integrated design, ensuring compliance and minimal impact on vehicle efficiency. Adoption is highest in regions with strict UNECE or FMVSS standards, including Europe, Japan, and North America. End-user focus ensures reliable performance, standardized sound levels, and cost-effective production.
  • OEM contracts often cover 3-5 years for volume production.
  • Aftermarket AVAS units average USD 150 per vehicle.
  • Government fleet retrofits typically cover speeds under 20 km/h for pedestrian safety.

Top Countries Expanding, Producing, and Innovating in the Acoustic Vehicle Alerting System Market

Acoustic Vehicle Alerting System Market Country Wise Analysis

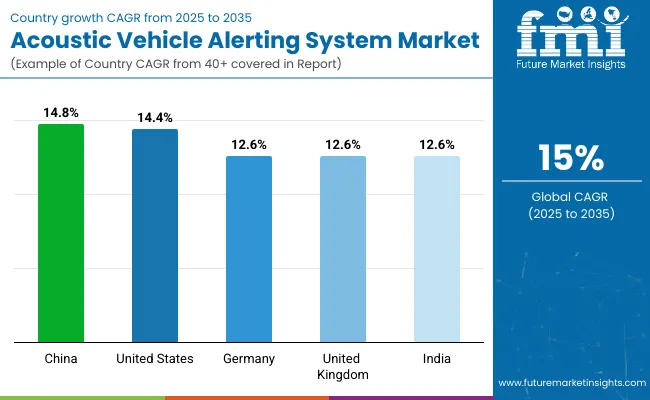
The global acoustic vehicle alerting system (AVAS) market grows from 2.5 billion USD in 2025 to 10.1 billion USD by 2035, registering a CAGR of 15%. China records 14.8%, slightly below the global rate, driven by BRICS-supported electric vehicle deployment and urban safety measures.

The United States follows at 14.4%, −4% under the global CAGR, influenced by OECD-backed regulations and gradual adoption across passenger and commercial vehicles. Germany, the United Kingdom, and India each stand at 12.6%, −16% compared with the global benchmark, reflecting steady expansion in vehicle fleets and phased adoption of alerting systems. Overall, BRICS economies, particularly China and India, are accelerating adoption, while OECD markets maintain steady progress through regulatory and technological measures.

Growth Analysis of AVAS Market in China

China is expected to grow at a CAGR of 14.8%, fueled by rapid electric vehicle adoption and regulatory mandates requiring acoustic vehicle alerting systems for all hybrids and EVs. The government has invested heavily in safety standards, and major automakers are integrating AVAS across passenger cars, buses, and light commercial vehicles.

R&D in customizable sound emissions and pedestrian detection technology is accelerating, while local suppliers are scaling production to meet both domestic and export demand. Urban centers are implementing pedestrian safety programs that increase the necessity of AVAS in high-traffic areas. By 2035, China is projected to lead the global AVAS production landscape and become a major exporter of components to Europe and North America.

  • Over 10 million EVs expected to be AVAS-equipped by 2030
  • Expansion of sensor-integrated AVAS projected to grow 22% annually
  • Customizable alert sound systems forecast to increase 20% per year

Market Forecast for AVAS in the United States

The United States AVAS market is projected to grow at a CAGR of 14.4%, supported by federal pedestrian safety regulations and rising hybrid and electric vehicle penetration. Adoption is strongest in commercial fleets and metropolitan regions, where safety requirements are stringent. Automakers are investing in AI-enabled adaptive alert sounds and integrating AVAS with advanced driver assistance systems.

Infrastructure programs are also promoting the installation of AVAS-compatible test tracks and urban EV safety zones. California remains a core market, but nationwide expansion is underway as awareness of silent vehicle risks rises. By 2035, AVAS-equipped vehicles are expected to become standard across all new EV and hybrid models.

  • AI-powered adaptive alert systems projected to grow 18% annually
  • Deployment of AVAS in commercial fleets forecast to increase 15% per year
  • EV testing zones for AVAS integration expected to cover 10 states by 2030

Future Outlook for AVAS Market in Germany

Germany is expanding at a CAGR of 12.6%, driven by stringent European Union vehicle safety directives and growing electric vehicle adoption. Premium and mid-tier automotive manufacturers are integrating AVAS across passenger cars and light commercial vehicles. Investment in advanced noise management and acoustic design is a priority, enabling quieter and more effective pedestrian alert systems.

Germany also focuses on exporting AVAS components to neighboring countries, capitalizing on technical expertise and manufacturing quality. Urban mobility programs in cities like Berlin and Hamburg are increasing demand for AVAS in fleet vehicles. By 2035, Germany is projected to maintain a significant role in AVAS R&D and supply for European electric vehicles.

  • Noise-optimized AVAS expected to cover 70% of new passenger EVs
  • Export of AVAS components projected to grow 8% annually
  • Urban fleet AVAS adoption forecast to increase 10% per year

Expansion of AVAS Market in the United Kingdom

The United Kingdom is growing at a CAGR of 12.6%, supported by electric vehicle adoption and regulatory emphasis on pedestrian safety. Growth is strongest in urban commuting vehicles, where high pedestrian density drives the need for acoustic alerts. The UK market focuses on modular AVAS systems that can be integrated into multiple vehicle types, including buses and delivery fleets.

Public transport authorities are increasingly specifying AVAS compliance for procurement. Research on customizable sound profiles tailored to city traffic conditions is underway. By 2035, the UK is expected to achieve near-universal AVAS deployment in metropolitan EVs, while small manufacturers are exploring low-cost solutions for suburban electric vehicles.

  • Modular AVAS systems projected to increase 50% of production by 2035
  • City-focused sound optimization expected to grow 12% annually
  • Fleet adoption by public transport projected to expand 15% by 2030

Growth Forecast for AVAS Market in India

India is expanding at a CAGR of 12.6%, driven by increasing electric two-wheeler and passenger car adoption in urban and semi-urban areas. Safety regulations are being phased in, requiring AVAS for EVs sold in major cities. Local manufacturers are producing cost-effective systems compatible with low-speed vehicles, while startups focus on integrating low-cost sensors and customizable alert sounds.

Growing awareness among consumers about silent vehicle risks supports adoption in private and fleet vehicles. By 2035, India is expected to see a rapid increase in AVAS-equipped electric vehicles, particularly for public transport, shared mobility, and last-mile delivery solutions.

  • Over 5 million EVs projected to be AVAS-equipped by 2030
  • Low-cost sensor integration forecast to grow 15% annually
  • Fleet adoption in shared mobility projected to rise 12% per year

Leading Acoustic Vehicle Alerting System CompaniesToyota Motor Corporation - 25% (market leader)

The acoustic vehicle alerting system (AVAS) market features a combination of automakers and specialized suppliers, each employing strategies to enhance vehicle safety and meet regulatory requirements. Toyota Motor Corporation leads the market by integrating AVAS into its hybrid and electric vehicles, providing customizable alert sounds for pedestrians and cyclists.

Subaru Corporation and Honda Motor Co Ltd focus on consistent acoustic signals for low-speed operations, ensuring both safety and user comfort. Volkswagen AG and BMW AG combine in-house development with supplier partnerships to deliver reliable alerting systems across multiple EV and hybrid models.

Specialized technology providers strengthen the market by offering modular and premium solutions. Aisin Seiki Co Ltd and Harman International develop adaptable AVAS components suitable for different vehicle platforms. Voxx International and Bose focus on high-quality audio alert systems, while Continental AG and Daimler AG integrate AVAS with broader vehicle safety solutions.

Nissan Motor Co Ltd and Ford Motor Company continue to refine sound output and volume control for regional compliance. These approaches, including product development, strategic partnerships, and integration into new EV models, allow companies to maintain competitiveness while promoting adoption of acoustic vehicle alerting systems worldwide.Recent Industry News

  • In December 2024, Gentex acquired VOXX International to strengthen its automotive components portfolio, focusing on developing advanced solutions including acoustic vehicle alerting systems for electric and hybrid vehicles.
  • In July 2024, Brose introduced a new acoustic vehicle alerting system specifically designed for hybrid and electric vehicles, enhancing safety and compliance with emerging automotive noise regulations.

Leading Players

  • Toyota Motor Corporation
  • Honda Motor Co Ltd
  • Volkswagen AG
  • BMW AG
  • Subaru Corporation
  • Ford Motor Company
  • Nissan Motor Co Ltd
  • Daimler AG
  • Aisin Seiki Co Ltd
  • Harman International
  • Continental AG
  • Voxx International

Report Scope

Report Attributes Details
Market Size (2025) USD 2.5 billion
Projected Market Size (2035) USD 10.1 billion
CAGR (2025 to 2035) 15%
Base Year for Estimation 2024
Historical Period 2020 to 2024
Projection Period 2025 to 2035
Quantitative Units USD billion for value
Application Segments Analyzed Passenger Vehicles, Commercial Vehicles, Two Wheelers, Heavy-Duty Vehicles
Technology Segments Analyzed Active Acoustic Systems, Passive Acoustic Systems, Hybrid Acoustic Systems
Vehicle Type Segments Analyzed Electric Vehicles, Hybrid Vehicles, Internal Combustion Engine Vehicles
End-User Segments Analyzed Automobile Manufacturers, Aftermarket Suppliers, Government Agencies
Regions Covered North America, Latin America, Western Europe, Eastern Europe, Asia Pacific, Middle East and Africa
Countries Covered United States, Canada, Mexico, Brazil, Argentina, Germany, United Kingdom, France, Italy, Spain, Netherlands, Sweden, Poland, China, Japan, India, South Korea, Thailand, Vietnam, Australia, New Zealand, United Arab Emirates, Saudi Arabia, South Africa, Turkey, Egypt
Leading Players Toyota Motor Corporation, Honda Motor Co Ltd, Volkswagen AG, BMW AG, Subaru Corporation, Ford Motor Company, Nissan Motor Co Ltd, Daimler AG, Aisin Seiki Co Ltd, Harman International, Continental AG, Voxx International
Additional Attributes Dollar sales by system type and vehicle category, demand dynamics across electric, hybrid, and commercial vehicles, regional adoption trends across North America, Europe, and Asia-Pacific, innovation in customizable sound profiles, AI-enabled detection, low-frequency alerts, environmental impact of energy use and noise pollution, and emerging use in pedestrian safety, urban mobility, and autonomous vehicle integration

Acoustic Vehicle Alerting System Market Analyzed by Key Investment Segments

By Application

  • Passenger Vehicles
  • Commercial Vehicles
  • Two Wheelers
  • Heavy-Duty Vehicles

By Technology

  • Active Acoustic Systems
  • Passive Acoustic Systems
  • Hybrid Acoustic Systems

By Vehicle Type

  • Electric Vehicles
  • Hybrid Vehicles
  • Internal Combustion Engine Vehicles

By End User

  • Automobile Manufacturers
  • Aftermarket Suppliers
  • Government Agencies

By Region

  • North America
  • Latin America
  • Western Europe
  • Eastern Europe
  • Asia Pacific
  • The Middle East and Africa

Table of Content

  1. Executive Summary
    • Global Market Outlook
    • Demand-side Trends
    • Supply-side Trends
    • Technology Roadmap Analysis
    • Analysis and Recommendations
  2. Market Overview
    • Market Coverage / Taxonomy
    • Market Definition / Scope / Limitations
  3. Market Background
    • Market Dynamics
      • Drivers
      • Restraints
      • Opportunity
      • Trends
    • Scenario Forecast
      • Demand in Optimistic Scenario
      • Demand in Likely Scenario
      • Demand in Conservative Scenario
    • Opportunity Map Analysis
    • Product Life Cycle Analysis
    • Supply Chain Analysis
      • Supply Side Participants and their Roles
        • Producers
        • Mid-Level Participants (Traders/ Agents/ Brokers)
        • Wholesalers and Distributors
      • Value Added and Value Created at Node in the Supply Chain
      • List of Raw Material Suppliers
      • List of Existing and Potential Buyer’s
    • Investment Feasibility Matrix
    • Value Chain Analysis
      • Profit Margin Analysis
      • Wholesalers and Distributors
      • Retailers
    • PESTLE and Porter’s Analysis
    • Regulatory Landscape
      • By Key Regions
      • By Key Countries
    • Regional Parent Market Outlook
    • Production and Consumption Statistics
    • Import and Export Statistics
  4. Global Market Analysis 2020 to 2024 and Forecast, 2025 to 2035
    • Historical Market Size Value (USD Billion) & Volume (Thousand Units) Analysis, 2020 to 2024
    • Current and Future Market Size Value (USD Billion) & Volume (Thousand Units) Projections, 2025 to 2035
      • Y-o-Y Growth Trend Analysis
      • Absolute $ Opportunity Analysis
  5. Global Market Pricing Analysis 2020 to 2024 and Forecast 2025 to 2035
  6. Global Market Analysis 2020 to 2024 and Forecast 2025 to 2035, By Application
    • Introduction / Key Findings
    • Historical Market Size Value (USD Billion) & Volume (Thousand Units) Analysis By Application, 2020 to 2024
    • Current and Future Market Size Value (USD Billion) & Volume (Thousand Units) Analysis and Forecast By Application, 2025 to 2035
      • Passenger Vehicles
      • Commercial Vehicles
      • Heavy-Duty Vehicles
      • Two Wheelers
    • Y-o-Y Growth Trend Analysis By Application, 2020 to 2024
    • Absolute $ Opportunity Analysis By Application, 2025 to 2035
  7. Global Market Analysis 2020 to 2024 and Forecast 2025 to 2035, By Technology
    • Introduction / Key Findings
    • Historical Market Size Value (USD Billion) & Volume (Thousand Units) Analysis By Technology, 2020 to 2024
    • Current and Future Market Size Value (USD Billion) & Volume (Thousand Units) Analysis and Forecast By Technology, 2025 to 2035
      • Active Acoustic Systems
      • Hybrid Acoustic Systems
      • Passive Acoustic Systems
    • Y-o-Y Growth Trend Analysis By Technology, 2020 to 2024
    • Absolute $ Opportunity Analysis By Technology, 2025 to 2035
  8. Global Market Analysis 2020 to 2024 and Forecast 2025 to 2035, By Vehicle Type
    • Introduction / Key Findings
    • Historical Market Size Value (USD Billion) & Volume (Thousand Units) Analysis By Vehicle Type, 2020 to 2024
    • Current and Future Market Size Value (USD Billion) & Volume (Thousand Units) Analysis and Forecast By Vehicle Type, 2025 to 2035
      • Electric Vehicles
      • Hybrid Vehicles
      • Internal Combustion Engine Vehicles
    • Y-o-Y Growth Trend Analysis By Vehicle Type, 2020 to 2024
    • Absolute $ Opportunity Analysis By Vehicle Type, 2025 to 2035
  9. Global Market Analysis 2020 to 2024 and Forecast 2025 to 2035, By End User
    • Introduction / Key Findings
    • Historical Market Size Value (USD Billion) & Volume (Thousand Units) Analysis By End User, 2020 to 2024
    • Current and Future Market Size Value (USD Billion) & Volume (Thousand Units) Analysis and Forecast By End User, 2025 to 2035
      • Automobile Manufacturers
      • Aftermarket Suppliers
      • Government Agencies
    • Y-o-Y Growth Trend Analysis By End User, 2020 to 2024
    • Absolute $ Opportunity Analysis By End User, 2025 to 2035
  10. Global Market Analysis 2020 to 2024 and Forecast 2025 to 2035, By Region
    • Introduction
    • Historical Market Size Value (USD Billion) & Volume (Thousand Units) Analysis By Region, 2020 to 2024
    • Current Market Size Value (USD Billion) & Volume (Thousand Units) Analysis and Forecast By Region, 2025 to 2035
      • North America
      • Latin America
      • Western Europe
      • Eastern Europe
      • East Asia
      • South Asia & Pacific
      • Middle East and Africa
    • Market Attractiveness Analysis By Region
  11. North America Market Analysis 2020 to 2024 and Forecast 2025 to 2035, By Country
    • Historical Market Size Value (USD Billion) & Volume (Thousand Units) Trend Analysis By Market Taxonomy, 2020 to 2024
    • Market Size Value (USD Billion) & Volume (Thousand Units) Forecast By Market Taxonomy, 2025 to 2035
      • By Country
        • USA
        • Canada
        • Mexico
      • By Application
      • By Technology
      • By Vehicle Type
      • By End User
    • Market Attractiveness Analysis
      • By Country
      • By Application
      • By Technology
      • By Vehicle Type
      • By End User
    • Key Takeaways
  12. Latin America Market Analysis 2020 to 2024 and Forecast 2025 to 2035, By Country
    • Historical Market Size Value (USD Billion) & Volume (Thousand Units) Trend Analysis By Market Taxonomy, 2020 to 2024
    • Market Size Value (USD Billion) & Volume (Thousand Units) Forecast By Market Taxonomy, 2025 to 2035
      • By Country
        • Brazil
        • Argentina
        • Rest of LATAM
      • By Application
      • By Technology
      • By Vehicle Type
      • By End User
    • Market Attractiveness Analysis
      • By Country
      • By Application
      • By Technology
      • By Vehicle Type
      • By End User
    • Key Takeaways
  13. Western Europe Market Analysis 2020 to 2024 and Forecast 2025 to 2035, By Country
    • Historical Market Size Value (USD Billion) & Volume (Thousand Units) Trend Analysis By Market Taxonomy, 2020 to 2024
    • Market Size Value (USD Billion) & Volume (Thousand Units) Forecast By Market Taxonomy, 2025 to 2035
      • By Country
        • Germany
        • Italy
        • France
        • UK
        • Spain
        • BENELUX
        • Nordic
        • Rest of W.Europe
      • By Application
      • By Technology
      • By Vehicle Type
      • By End User
    • Market Attractiveness Analysis
      • By Country
      • By Application
      • By Technology
      • By Vehicle Type
      • By End User
    • Key Takeaways
  14. Eastern Europe Market Analysis 2020 to 2024 and Forecast 2025 to 2035, By Country
    • Historical Market Size Value (USD Billion) & Volume (Thousand Units) Trend Analysis By Market Taxonomy, 2020 to 2024
    • Market Size Value (USD Billion) & Volume (Thousand Units) Forecast By Market Taxonomy, 2025 to 2035
      • By Country
        • Russia
        • Hungary
        • Poland
        • Balkan & Baltics
        • Rest of E. Europe
      • By Application
      • By Technology
      • By Vehicle Type
      • By End User
    • Market Attractiveness Analysis
      • By Country
      • By Application
      • By Technology
      • By Vehicle Type
      • By End User
    • Key Takeaways
  15. East Asia Market Analysis 2020 to 2024 and Forecast 2025 to 2035, By Country
    • Historical Market Size Value (USD Billion) & Volume (Thousand Units) Trend Analysis By Market Taxonomy, 2020 to 2024
    • Market Size Value (USD Billion) & Volume (Thousand Units) Forecast By Market Taxonomy, 2025 to 2035
      • By Country
        • China
        • Japan
        • South Korea
      • By Application
      • By Technology
      • By Vehicle Type
      • By End User
    • Market Attractiveness Analysis
      • By Country
      • By Application
      • By Technology
      • By Vehicle Type
      • By End User
    • Key Takeaways
  16. South Asia & Pacific Market Analysis 2020 to 2024 and Forecast 2025 to 2035, By Country
    • Historical Market Size Value (USD Billion) & Volume (Thousand Units) Trend Analysis By Market Taxonomy, 2020 to 2024
    • Market Size Value (USD Billion) & Volume (Thousand Units) Forecast By Market Taxonomy, 2025 to 2035
      • By Country
        • India
        • Australia & New Zealand
        • ASEAN
        • Rest of SAP
      • By Application
      • By Technology
      • By Vehicle Type
      • By End User
    • Market Attractiveness Analysis
      • By Country
      • By Application
      • By Technology
      • By Vehicle Type
      • By End User
    • Key Takeaways
  17. Middle East and Africa Market Analysis 2020 to 2024 and Forecast 2025 to 2035, By Country
    • Historical Market Size Value (USD Billion) & Volume (Thousand Units) Trend Analysis By Market Taxonomy, 2020 to 2024
    • Market Size Value (USD Billion) & Volume (Thousand Units) Forecast By Market Taxonomy, 2025 to 2035
      • By Country
        • GCC Countries
        • Northern Africa
        • South Africa
        • Turkiye
        • Rest of MEA
      • By Application
      • By Technology
      • By Vehicle Type
      • By End User
    • Market Attractiveness Analysis
      • By Country
      • By Application
      • By Technology
      • By Vehicle Type
      • By End User
    • Key Takeaways
  18. Key Countries Market Analysis
    • USA
      • Pricing Analysis
      • Market Share Analysis, 2024
        • By Application
        • By Technology
        • By Vehicle Type
        • By End User
    • Canada
      • Pricing Analysis
      • Market Share Analysis, 2024
        • By Application
        • By Technology
        • By Vehicle Type
        • By End User
    • Brazil
      • Pricing Analysis
      • Market Share Analysis, 2024
        • By Application
        • By Technology
        • By Vehicle Type
        • By End User
    • Mexico
      • Pricing Analysis
      • Market Share Analysis, 2024
        • By Application
        • By Technology
        • By Vehicle Type
        • By End User
    • Argentina
      • Pricing Analysis
      • Market Share Analysis, 2024
        • By Application
        • By Technology
        • By Vehicle Type
        • By End User
  19. Market Structure Analysis
    • Competition Dashboard
    • Competition Benchmarking
    • Market Share Analysis of Top Players
      • By Regional
      • By Application
      • By Technology
      • By Vehicle Type
      • By End User
  20. Competition Analysis
    • Competition Deep Dive
      • Toyota Motor Corporation
        • Overview
        • Product Portfolio
        • Profitability by Market Segments (Product/Age /Sales Channel/Region)
        • Sales Footprint
        • Strategy Overview
          • Marketing Strategy
          • Product Strategy
          • Channel Strategy
      • Honda Motor Co Ltd
        • Overview
        • Product Portfolio
        • Profitability by Market Segments (Product/Age /Sales Channel/Region)
        • Sales Footprint
        • Strategy Overview
          • Marketing Strategy
          • Product Strategy
          • Channel Strategy
      • Volkswagen AG
        • Overview
        • Product Portfolio
        • Profitability by Market Segments (Product/Age /Sales Channel/Region)
        • Sales Footprint
        • Strategy Overview
          • Marketing Strategy
          • Product Strategy
          • Channel Strategy
      • BMW AG
        • Overview
        • Product Portfolio
        • Profitability by Market Segments (Product/Age /Sales Channel/Region)
        • Sales Footprint
        • Strategy Overview
          • Marketing Strategy
          • Product Strategy
          • Channel Strategy
      • Subaru Corporation
        • Overview
        • Product Portfolio
        • Profitability by Market Segments (Product/Age /Sales Channel/Region)
        • Sales Footprint
        • Strategy Overview
          • Marketing Strategy
          • Product Strategy
          • Channel Strategy
      • Ford Motor Company
        • Overview
        • Product Portfolio
        • Profitability by Market Segments (Product/Age /Sales Channel/Region)
        • Sales Footprint
        • Strategy Overview
          • Marketing Strategy
          • Product Strategy
          • Channel Strategy
      • Nissan Motor Co Ltd
        • Overview
        • Product Portfolio
        • Profitability by Market Segments (Product/Age /Sales Channel/Region)
        • Sales Footprint
        • Strategy Overview
          • Marketing Strategy
          • Product Strategy
          • Channel Strategy
      • Daimler AG
        • Overview
        • Product Portfolio
        • Profitability by Market Segments (Product/Age /Sales Channel/Region)
        • Sales Footprint
        • Strategy Overview
          • Marketing Strategy
          • Product Strategy
          • Channel Strategy
      • Aisin Seiki Co Ltd
        • Overview
        • Product Portfolio
        • Profitability by Market Segments (Product/Age /Sales Channel/Region)
        • Sales Footprint
        • Strategy Overview
          • Marketing Strategy
          • Product Strategy
          • Channel Strategy
      • Harman International
        • Overview
        • Product Portfolio
        • Profitability by Market Segments (Product/Age /Sales Channel/Region)
        • Sales Footprint
        • Strategy Overview
          • Marketing Strategy
          • Product Strategy
          • Channel Strategy
      • Continental AG
        • Overview
        • Product Portfolio
        • Profitability by Market Segments (Product/Age /Sales Channel/Region)
        • Sales Footprint
        • Strategy Overview
          • Marketing Strategy
          • Product Strategy
          • Channel Strategy
      • Voxx International
        • Overview
        • Product Portfolio
        • Profitability by Market Segments (Product/Age /Sales Channel/Region)
        • Sales Footprint
        • Strategy Overview
          • Marketing Strategy
          • Product Strategy
          • Channel Strategy
  21. Assumptions & Acronyms Used
  22. Research Methodology

List of Tables

  • Table 1: Global Market Value (USD Billion) Forecast by Region, 2020-2035
  • Table 2: Global Market Volume (Thousand Units) Forecast by Region, 2020-2035
  • Table 3: Global Market Value (USD Billion) Forecast by Application, 2020-2035
  • Table 4: Global Market Volume (Thousand Units) Forecast by Application, 2020-2035
  • Table 5: Global Market Value (USD Billion) Forecast by Technology, 2020-2035
  • Table 6: Global Market Volume (Thousand Units) Forecast by Technology, 2020-2035
  • Table 7: Global Market Value (USD Billion) Forecast by Vehicle Type, 2020-2035
  • Table 8: Global Market Volume (Thousand Units) Forecast by Vehicle Type, 2020-2035
  • Table 9: Global Market Value (USD Billion) Forecast by End User, 2020-2035
  • Table 10: Global Market Volume (Thousand Units) Forecast by End User, 2020-2035
  • Table 11: North America Market Value (USD Billion) Forecast by Country, 2020-2035
  • Table 12: North America Market Volume (Thousand Units) Forecast by Country, 2020-2035
  • Table 13: North America Market Value (USD Billion) Forecast by Application, 2020-2035
  • Table 14: North America Market Volume (Thousand Units) Forecast by Application, 2020-2035
  • Table 15: North America Market Value (USD Billion) Forecast by Technology, 2020-2035
  • Table 16: North America Market Volume (Thousand Units) Forecast by Technology, 2020-2035
  • Table 17: North America Market Value (USD Billion) Forecast by Vehicle Type, 2020-2035
  • Table 18: North America Market Volume (Thousand Units) Forecast by Vehicle Type, 2020-2035
  • Table 19: North America Market Value (USD Billion) Forecast by End User, 2020-2035
  • Table 20: North America Market Volume (Thousand Units) Forecast by End User, 2020-2035
  • Table 21: Latin America Market Value (USD Billion) Forecast by Country, 2020-2035
  • Table 22: Latin America Market Volume (Thousand Units) Forecast by Country, 2020-2035
  • Table 23: Latin America Market Value (USD Billion) Forecast by Application, 2020-2035
  • Table 24: Latin America Market Volume (Thousand Units) Forecast by Application, 2020-2035
  • Table 25: Latin America Market Value (USD Billion) Forecast by Technology, 2020-2035
  • Table 26: Latin America Market Volume (Thousand Units) Forecast by Technology, 2020-2035
  • Table 27: Latin America Market Value (USD Billion) Forecast by Vehicle Type, 2020-2035
  • Table 28: Latin America Market Volume (Thousand Units) Forecast by Vehicle Type, 2020-2035
  • Table 29: Latin America Market Value (USD Billion) Forecast by End User, 2020-2035
  • Table 30: Latin America Market Volume (Thousand Units) Forecast by End User, 2020-2035
  • Table 31: Western Europe Market Value (USD Billion) Forecast by Country, 2020-2035
  • Table 32: Western Europe Market Volume (Thousand Units) Forecast by Country, 2020-2035
  • Table 33: Western Europe Market Value (USD Billion) Forecast by Application, 2020-2035
  • Table 34: Western Europe Market Volume (Thousand Units) Forecast by Application, 2020-2035
  • Table 35: Western Europe Market Value (USD Billion) Forecast by Technology, 2020-2035
  • Table 36: Western Europe Market Volume (Thousand Units) Forecast by Technology, 2020-2035
  • Table 37: Western Europe Market Value (USD Billion) Forecast by Vehicle Type, 2020-2035
  • Table 38: Western Europe Market Volume (Thousand Units) Forecast by Vehicle Type, 2020-2035
  • Table 39: Western Europe Market Value (USD Billion) Forecast by End User, 2020-2035
  • Table 40: Western Europe Market Volume (Thousand Units) Forecast by End User, 2020-2035
  • Table 41: Eastern Europe Market Value (USD Billion) Forecast by Country, 2020-2035
  • Table 42: Eastern Europe Market Volume (Thousand Units) Forecast by Country, 2020-2035
  • Table 43: Eastern Europe Market Value (USD Billion) Forecast by Application, 2020-2035
  • Table 44: Eastern Europe Market Volume (Thousand Units) Forecast by Application, 2020-2035
  • Table 45: Eastern Europe Market Value (USD Billion) Forecast by Technology, 2020-2035
  • Table 46: Eastern Europe Market Volume (Thousand Units) Forecast by Technology, 2020-2035
  • Table 47: Eastern Europe Market Value (USD Billion) Forecast by Vehicle Type, 2020-2035
  • Table 48: Eastern Europe Market Volume (Thousand Units) Forecast by Vehicle Type, 2020-2035
  • Table 49: Eastern Europe Market Value (USD Billion) Forecast by End User, 2020-2035
  • Table 50: Eastern Europe Market Volume (Thousand Units) Forecast by End User, 2020-2035
  • Table 51: East Asia Market Value (USD Billion) Forecast by Country, 2020-2035
  • Table 52: East Asia Market Volume (Thousand Units) Forecast by Country, 2020-2035
  • Table 53: East Asia Market Value (USD Billion) Forecast by Application, 2020-2035
  • Table 54: East Asia Market Volume (Thousand Units) Forecast by Application, 2020-2035
  • Table 55: East Asia Market Value (USD Billion) Forecast by Technology, 2020-2035
  • Table 56: East Asia Market Volume (Thousand Units) Forecast by Technology, 2020-2035
  • Table 57: East Asia Market Value (USD Billion) Forecast by Vehicle Type, 2020-2035
  • Table 58: East Asia Market Volume (Thousand Units) Forecast by Vehicle Type, 2020-2035
  • Table 59: East Asia Market Value (USD Billion) Forecast by End User, 2020-2035
  • Table 60: East Asia Market Volume (Thousand Units) Forecast by End User, 2020-2035
  • Table 61: South Asia & Pacific Market Value (USD Billion) Forecast by Country, 2020-2035
  • Table 62: South Asia & Pacific Market Volume (Thousand Units) Forecast by Country, 2020-2035
  • Table 63: South Asia & Pacific Market Value (USD Billion) Forecast by Application, 2020-2035
  • Table 64: South Asia & Pacific Market Volume (Thousand Units) Forecast by Application, 2020-2035
  • Table 65: South Asia & Pacific Market Value (USD Billion) Forecast by Technology, 2020-2035
  • Table 66: South Asia & Pacific Market Volume (Thousand Units) Forecast by Technology, 2020-2035
  • Table 67: South Asia & Pacific Market Value (USD Billion) Forecast by Vehicle Type, 2020-2035
  • Table 68: South Asia & Pacific Market Volume (Thousand Units) Forecast by Vehicle Type, 2020-2035
  • Table 69: South Asia & Pacific Market Value (USD Billion) Forecast by End User, 2020-2035
  • Table 70: South Asia & Pacific Market Volume (Thousand Units) Forecast by End User, 2020-2035
  • Table 71: Middle East and Africa Market Value (USD Billion) Forecast by Country, 2020-2035
  • Table 72: Middle East and Africa Market Volume (Thousand Units) Forecast by Country, 2020-2035
  • Table 73: Middle East and Africa Market Value (USD Billion) Forecast by Application, 2020-2035
  • Table 74: Middle East and Africa Market Volume (Thousand Units) Forecast by Application, 2020-2035
  • Table 75: Middle East and Africa Market Value (USD Billion) Forecast by Technology, 2020-2035
  • Table 76: Middle East and Africa Market Volume (Thousand Units) Forecast by Technology, 2020-2035
  • Table 77: Middle East and Africa Market Value (USD Billion) Forecast by Vehicle Type, 2020-2035
  • Table 78: Middle East and Africa Market Volume (Thousand Units) Forecast by Vehicle Type, 2020-2035
  • Table 79: Middle East and Africa Market Value (USD Billion) Forecast by End User, 2020-2035
  • Table 80: Middle East and Africa Market Volume (Thousand Units) Forecast by End User, 2020-2035

List of Figures

  • Figure 1: Global Market Volume (Thousand Units) Forecast 2020-2035
  • Figure 2: Global Market Pricing Analysis
  • Figure 3: Global Market Value (USD Billion) Forecast 2020-2035
  • Figure 4: Global Market Value Share and BPS Analysis by Application, 2025 and 2035
  • Figure 5: Global Market Y-o-Y Growth Comparison by Application, 2025-2035
  • Figure 6: Global Market Attractiveness Analysis by Application
  • Figure 7: Global Market Value Share and BPS Analysis by Technology, 2025 and 2035
  • Figure 8: Global Market Y-o-Y Growth Comparison by Technology, 2025-2035
  • Figure 9: Global Market Attractiveness Analysis by Technology
  • Figure 10: Global Market Value Share and BPS Analysis by Vehicle Type, 2025 and 2035
  • Figure 11: Global Market Y-o-Y Growth Comparison by Vehicle Type, 2025-2035
  • Figure 12: Global Market Attractiveness Analysis by Vehicle Type
  • Figure 13: Global Market Value Share and BPS Analysis by End User, 2025 and 2035
  • Figure 14: Global Market Y-o-Y Growth Comparison by End User, 2025-2035
  • Figure 15: Global Market Attractiveness Analysis by End User
  • Figure 16: Global Market Value (USD Billion) Share and BPS Analysis by Region, 2025 and 2035
  • Figure 17: Global Market Y-o-Y Growth Comparison by Region, 2025-2035
  • Figure 18: Global Market Attractiveness Analysis by Region
  • Figure 19: North America Market Incremental $ Opportunity, 2025-2035
  • Figure 20: Latin America Market Incremental $ Opportunity, 2025-2035
  • Figure 21: Western Europe Market Incremental $ Opportunity, 2025-2035
  • Figure 22: Eastern Europe Market Incremental $ Opportunity, 2025-2035
  • Figure 23: East Asia Market Incremental $ Opportunity, 2025-2035
  • Figure 24: South Asia & Pacific Market Incremental $ Opportunity, 2025-2035
  • Figure 25: Middle East and Africa Market Incremental $ Opportunity, 2025-2035
  • Figure 26: North America Market Value Share and BPS Analysis by Country, 2025 and 2035
  • Figure 27: North America Market Value Share and BPS Analysis by Application, 2025 and 2035
  • Figure 28: North America Market Y-o-Y Growth Comparison by Application, 2025-2035
  • Figure 29: North America Market Attractiveness Analysis by Application
  • Figure 30: North America Market Value Share and BPS Analysis by Technology, 2025 and 2035
  • Figure 31: North America Market Y-o-Y Growth Comparison by Technology, 2025-2035
  • Figure 32: North America Market Attractiveness Analysis by Technology
  • Figure 33: North America Market Value Share and BPS Analysis by Vehicle Type, 2025 and 2035
  • Figure 34: North America Market Y-o-Y Growth Comparison by Vehicle Type, 2025-2035
  • Figure 35: North America Market Attractiveness Analysis by Vehicle Type
  • Figure 36: North America Market Value Share and BPS Analysis by End User, 2025 and 2035
  • Figure 37: North America Market Y-o-Y Growth Comparison by End User, 2025-2035
  • Figure 38: North America Market Attractiveness Analysis by End User
  • Figure 39: Latin America Market Value Share and BPS Analysis by Country, 2025 and 2035
  • Figure 40: Latin America Market Value Share and BPS Analysis by Application, 2025 and 2035
  • Figure 41: Latin America Market Y-o-Y Growth Comparison by Application, 2025-2035
  • Figure 42: Latin America Market Attractiveness Analysis by Application
  • Figure 43: Latin America Market Value Share and BPS Analysis by Technology, 2025 and 2035
  • Figure 44: Latin America Market Y-o-Y Growth Comparison by Technology, 2025-2035
  • Figure 45: Latin America Market Attractiveness Analysis by Technology
  • Figure 46: Latin America Market Value Share and BPS Analysis by Vehicle Type, 2025 and 2035
  • Figure 47: Latin America Market Y-o-Y Growth Comparison by Vehicle Type, 2025-2035
  • Figure 48: Latin America Market Attractiveness Analysis by Vehicle Type
  • Figure 49: Latin America Market Value Share and BPS Analysis by End User, 2025 and 2035
  • Figure 50: Latin America Market Y-o-Y Growth Comparison by End User, 2025-2035
  • Figure 51: Latin America Market Attractiveness Analysis by End User
  • Figure 52: Western Europe Market Value Share and BPS Analysis by Country, 2025 and 2035
  • Figure 53: Western Europe Market Value Share and BPS Analysis by Application, 2025 and 2035
  • Figure 54: Western Europe Market Y-o-Y Growth Comparison by Application, 2025-2035
  • Figure 55: Western Europe Market Attractiveness Analysis by Application
  • Figure 56: Western Europe Market Value Share and BPS Analysis by Technology, 2025 and 2035
  • Figure 57: Western Europe Market Y-o-Y Growth Comparison by Technology, 2025-2035
  • Figure 58: Western Europe Market Attractiveness Analysis by Technology
  • Figure 59: Western Europe Market Value Share and BPS Analysis by Vehicle Type, 2025 and 2035
  • Figure 60: Western Europe Market Y-o-Y Growth Comparison by Vehicle Type, 2025-2035
  • Figure 61: Western Europe Market Attractiveness Analysis by Vehicle Type
  • Figure 62: Western Europe Market Value Share and BPS Analysis by End User, 2025 and 2035
  • Figure 63: Western Europe Market Y-o-Y Growth Comparison by End User, 2025-2035
  • Figure 64: Western Europe Market Attractiveness Analysis by End User
  • Figure 65: Eastern Europe Market Value Share and BPS Analysis by Country, 2025 and 2035
  • Figure 66: Eastern Europe Market Value Share and BPS Analysis by Application, 2025 and 2035
  • Figure 67: Eastern Europe Market Y-o-Y Growth Comparison by Application, 2025-2035
  • Figure 68: Eastern Europe Market Attractiveness Analysis by Application
  • Figure 69: Eastern Europe Market Value Share and BPS Analysis by Technology, 2025 and 2035
  • Figure 70: Eastern Europe Market Y-o-Y Growth Comparison by Technology, 2025-2035
  • Figure 71: Eastern Europe Market Attractiveness Analysis by Technology
  • Figure 72: Eastern Europe Market Value Share and BPS Analysis by Vehicle Type, 2025 and 2035
  • Figure 73: Eastern Europe Market Y-o-Y Growth Comparison by Vehicle Type, 2025-2035
  • Figure 74: Eastern Europe Market Attractiveness Analysis by Vehicle Type
  • Figure 75: Eastern Europe Market Value Share and BPS Analysis by End User, 2025 and 2035
  • Figure 76: Eastern Europe Market Y-o-Y Growth Comparison by End User, 2025-2035
  • Figure 77: Eastern Europe Market Attractiveness Analysis by End User
  • Figure 78: East Asia Market Value Share and BPS Analysis by Country, 2025 and 2035
  • Figure 79: East Asia Market Value Share and BPS Analysis by Application, 2025 and 2035
  • Figure 80: East Asia Market Y-o-Y Growth Comparison by Application, 2025-2035
  • Figure 81: East Asia Market Attractiveness Analysis by Application
  • Figure 82: East Asia Market Value Share and BPS Analysis by Technology, 2025 and 2035
  • Figure 83: East Asia Market Y-o-Y Growth Comparison by Technology, 2025-2035
  • Figure 84: East Asia Market Attractiveness Analysis by Technology
  • Figure 85: East Asia Market Value Share and BPS Analysis by Vehicle Type, 2025 and 2035
  • Figure 86: East Asia Market Y-o-Y Growth Comparison by Vehicle Type, 2025-2035
  • Figure 87: East Asia Market Attractiveness Analysis by Vehicle Type
  • Figure 88: East Asia Market Value Share and BPS Analysis by End User, 2025 and 2035
  • Figure 89: East Asia Market Y-o-Y Growth Comparison by End User, 2025-2035
  • Figure 90: East Asia Market Attractiveness Analysis by End User
  • Figure 91: South Asia & Pacific Market Value Share and BPS Analysis by Country, 2025 and 2035
  • Figure 92: South Asia & Pacific Market Value Share and BPS Analysis by Application, 2025 and 2035
  • Figure 93: South Asia & Pacific Market Y-o-Y Growth Comparison by Application, 2025-2035
  • Figure 94: South Asia & Pacific Market Attractiveness Analysis by Application
  • Figure 95: South Asia & Pacific Market Value Share and BPS Analysis by Technology, 2025 and 2035
  • Figure 96: South Asia & Pacific Market Y-o-Y Growth Comparison by Technology, 2025-2035
  • Figure 97: South Asia & Pacific Market Attractiveness Analysis by Technology
  • Figure 98: South Asia & Pacific Market Value Share and BPS Analysis by Vehicle Type, 2025 and 2035
  • Figure 99: South Asia & Pacific Market Y-o-Y Growth Comparison by Vehicle Type, 2025-2035
  • Figure 100: South Asia & Pacific Market Attractiveness Analysis by Vehicle Type
  • Figure 101: South Asia & Pacific Market Value Share and BPS Analysis by End User, 2025 and 2035
  • Figure 102: South Asia & Pacific Market Y-o-Y Growth Comparison by End User, 2025-2035
  • Figure 103: South Asia & Pacific Market Attractiveness Analysis by End User
  • Figure 104: Middle East and Africa Market Value Share and BPS Analysis by Country, 2025 and 2035
  • Figure 105: Middle East and Africa Market Value Share and BPS Analysis by Application, 2025 and 2035
  • Figure 106: Middle East and Africa Market Y-o-Y Growth Comparison by Application, 2025-2035
  • Figure 107: Middle East and Africa Market Attractiveness Analysis by Application
  • Figure 108: Middle East and Africa Market Value Share and BPS Analysis by Technology, 2025 and 2035
  • Figure 109: Middle East and Africa Market Y-o-Y Growth Comparison by Technology, 2025-2035
  • Figure 110: Middle East and Africa Market Attractiveness Analysis by Technology
  • Figure 111: Middle East and Africa Market Value Share and BPS Analysis by Vehicle Type, 2025 and 2035
  • Figure 112: Middle East and Africa Market Y-o-Y Growth Comparison by Vehicle Type, 2025-2035
  • Figure 113: Middle East and Africa Market Attractiveness Analysis by Vehicle Type
  • Figure 114: Middle East and Africa Market Value Share and BPS Analysis by End User, 2025 and 2035
  • Figure 115: Middle East and Africa Market Y-o-Y Growth Comparison by End User, 2025-2035
  • Figure 116: Middle East and Africa Market Attractiveness Analysis by End User
  • Figure 117: Global Market - Tier Structure Analysis
  • Figure 118: Global Market - Company Share Analysis

Frequently Asked Questions

What is the projected size of the acoustic vehicle alerting system market by 2035?

The market is projected to reach USD 10.1 billion by 2035.

What CAGR is expected for the acoustic vehicle alerting system market between 2025 and 2035?

The market is forecasted to grow at a CAGR of 15% during 2025 to 2035.

Which application segment holds the largest share in 2025?

Passenger vehicles are expected to hold 40% share in 2025.

Which technology segment dominates the acoustic vehicle alerting system market?

Active acoustic systems account for 50% of the market share in 2025.

Who is the leading player in the acoustic vehicle alerting system market and what is its share?

Toyota Motor Corporation leads the market with a 25% share in 2025.

Explore Similar Insights

Future Market Insights

Acoustic Vehicle Alerting System Market

Chat With

MaRIA

Hi There, I am MaRIA, Your Market Research Intelligence Assistant. How may I help you?