

- Market Size (2026)
- USD 2.8 Bn
- Forecast (2036)
- USD 7.1 Bn
- CAGR (2026 to 2036)
- 9.8%
How big is Aeroponic Market in 2026?
Sales in the aeroponic market are projected to grow at 9.8% CAGR, with the market size rising from USD 2.6 billion in 2025 to USD 2.8 billion in 2026 and reaching USD 7.1 billion by 2036.
According to Future Market Insights analysis, the global aeroponic market stands at USD 2.6 billion in 2025 and rises to USD 2.8 billion in 2026. Industry valuation is projected to reach USD 7.1 billion by 2036, expanding at a 9.8% CAGR and generating USD 4.3 billion in added revenue. Severe freshwater scarcity and escalating urban land costs are pushing commercial cultivators toward controlled environment agriculture systems that mist bare root zones and recirculate runoff. A 2026 critical review in Agriculture confirmed that closed-loop aeroponic misting reduces water demand by over 90% while delivering 45% to 75% higher crop yields than soil cultivation [1]. Commercial applications represent 72.0% of demand in 2026, driven by continuous leafy green harvests and recurring equipment maintenance. However, high electricity tariffs for artificial lighting and rapid root desiccation during nozzle clogging remain significant operational hurdles for facility operators.
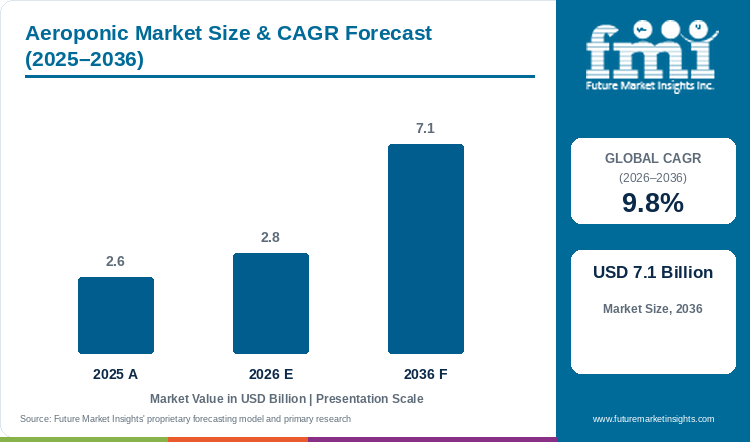
Key Market Trends & Insights
- By component: Irrigation components accounted for 28.0% of the market in 2026, reflecting the dependence of root-zone nutrition on consistent nozzle pressure, pump output, and filter performance working together.
- By farming method: Indoor farming captured 68.0% of farming method demand in 2026, with year-round production schedules decoupled from seasonal outdoor conditions driving adoption near metropolitan supply chains.
- By solution: Equipment, software controls, and maintenance services remain closely matched in relative demand, attributable to the operational risk of mist-line pressure failures that lack automated alerting.
- By application: Commercial applications represented 72.0% of revenue in 2026, shaped by large-format growing rooms, contracted multi-cycle crop programs, and recurring equipment service spend.
- By crop type: Leafy greens and herbs lead crop type demand, owing to short cycle lengths that allow facility operators to recover lighting and infrastructure costs within a season.
- By end user: Commercial growers account for the larger portion of system purchases, while research institutions and households acquire smaller-format units for controlled trials and personal cultivation.
Regional Highlights
- Fastest-growing evaluated country: USA, at 20.3% CAGR from 2026 to 2036.
- South Korea at 20.2%, the European Union at 20.0%, and Japan at 19.9% follow, while the UK records 19.8%.
Market Size & Forecast
Table 1: Market Size and Forecast for the Aeroponic Market (USD billion and CAGR percentage), 2025 to 2036
| Metric | Value |
|---|---|
| 2025 Market Size | USD 2.6 billion |
| Estimated Market Size in 2026 | USD 2.8 billion |
| Projected Market Size by 2036 | USD 7.1 billion |
| CAGR, 2026 to 2036 | 9.8% |
| Added Revenue, 2026 to 2036 | USD 4.3 billion |
Cultivation economics differ across indoor facilities because energy consumption per harvest cycle determines commercial survival. While closed environments allow year-round production regardless of outdoor climate, artificial lighting and HVAC systems introduce heavy baseline electricity expenses. In January 2025, USDA Agricultural Research Service researchers identified high power tariffs and climate control loads as central economic bottlenecks for vertical farming systems [2]. Consequently, growers are investing in automated misting zones, cleanable filtration units, and redundant backup pumps to protect high-density root chambers from sudden mechanical failure.
Installed Growing Area and Water-Use Sizing
Table 2: Growing-Area and Water-Use Indicators for the Aeroponic Market (USD billion, million square meters, and billion liters), 2025 to 2036
| Metric | 2025 | 2026 | 2036 |
|---|---|---|---|
| Market size (USD billion) | 2.6 | 2.8 | 7.1 |
| Commercial aeroponic growing area (million m2) | 3.2 to 4.1 | 3.5 to 4.5 | 7.4 to 9.6 |
| Annual recirculated water demand (billion liters) | 18 to 25 | 20 to 28 | 43 to 61 |
| Annual field-water displacement (billion liters) | 180 to 250 | 200 to 280 | 430 to 610 |
Aeroponic facilities integrate automated nutrient dosing, lighting grids, and climate controls within sealed growing chambers, enabling faster crop turns while demanding immediate fail-safe mechanisms. Capital deployment in commercial greenhouse cultivation is consequently shifting toward compartmentalized misting zones, inline self-cleaning filters, and dual-pump loops rather than centralized single-line infrastructure. This architecture increases initial installation costs, but allows operators to isolate plumbing blockages and maintain production across adjacent bays during maintenance.
Facility Economics and Production Intensity
Aeroponic facilities bring nutrient dosing, lights and climate equipment inside one production room, due to which output can increase but a failure also reaches the crop much faster. Investment in controlled environment agriculture is therefore shifting towards smaller mist zones, cleanable filters and backup pumping rather than one common line for the complete facility. This arrangement adds cost at the beginning, still it allows an operator to isolate a fault and continue production in other zones. Farms connected with retail contracts are likely to take this expense first, because missing a scheduled pack-out can cost more than the additional equipment.
Table 3: Revenue and Production Intensity Indicators for the Aeroponic Market (USD), 2025 to 2036
| Metric | 2025 | 2026 | 2036 |
|---|---|---|---|
| Market revenue per square meter (USD) | 620 to 800 | 620 to 800 | 740 to 960 |
| System and component spend per crop cycle (USD/m2) | 70 to 105 | 75 to 110 | 90 to 135 |
| Annual crop cycles for leafy greens | 10 to 16 | 10 to 16 | 12 to 18 |
| Water recirculation rate | 90% to 97% | 90% to 97% | 92% to 98% |
Table 4: Commercial Facility Spending Indicators for the Aeroponic Market (USD billion and percentages), 2026
| Metric | Value | Basis |
|---|---|---|
| Market size, 2026 | USD 2.8 billion | Report value |
| Commercial application revenue | USD 2.0 billion | 72.0% share |
| Indoor farming revenue | USD 1.9 billion | 68.0% share |
| Irrigation component revenue | USD 0.8 billion | 28.0% share |
Analyst Perspective
“Aeroponic operators need stable mist delivery and crop economics that remain dependable under commercial production schedules. Suppliers integrating filtration, sensing, and climate controls can secure recurring system and service agreements.”
- Nandini Roy Choudhury, Principal Consultant, Future Market Insights.
How is the Aeroponic Market segmented?
The aeroponic market is segmented by component, farming method, solution, application, crop type, and end user.
Component covers irrigation components, lighting systems, climate control, sensors, automation platforms, and others.
Farming method covers indoor farming, outdoor farming, and hybrid farming.
Solution covers equipment, software and controls, installation and integration, and maintenance and advisory services.
Application covers commercial, research and institutional, and residential.
Crop type covers leafy greens, herbs and microgreens, fruiting vegetables, strawberries and berries, root crops, and others.
End user covers commercial growers, vertical farms, greenhouses, research bodies, educational institutions, and households.
Why does Irrigation Component lead the component category?
Irrigation Component represents 28.0% of component demand in 2026, managing precision mist delivery across commercial root zones.
Table 5: Component Share for the Aeroponic Market (percentage share), 2026
| Component | Share (2026) |
|---|---|
| Irrigation Component | 28.0% |
| Other Components Combined | 72.0%* |
| Total | 100.0% |
*Calculated as the balance remaining after deducting the leading segment share from 100.0%.
Table 6: Component Leadership and Market Growth for the Aeroponic Market (segment and CAGR percentage), 2026 to 2036
| Metric | Value |
|---|---|
| Global CAGR (2026 to 2036) | 9.8% |
| Leading Component | Irrigation Component |
Misting assemblies and precision irrigation components represent 28.0% of component demand in 2026 because droplet size and pulse timing directly govern root respiration and nutrient uptake. Exposed root systems carry no soil buffer, making pump pressure consistency and filtration reliability vital to crop survival.
- By component, Irrigation Component is projected to account for 28.0% in 2026, driven by direct control over mist timing and root-zone nutrition.
- Commercial growers prioritize dual-manifold assemblies and stainless-steel micro-nozzles that prevent mineral scale buildup during intensive production cycles.
What supports Indoor Farming as the preferred farming method?
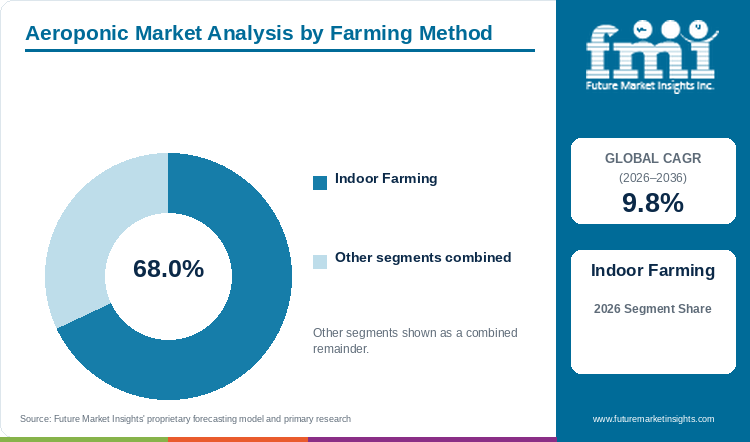
Indoor Farming accounts for 68.0% of farming method demand in 2026, supported by year-round environmental control and urban proximity.
Indoor farming captures 68.0% of farming method demand in 2026 by decoupling commercial harvest schedules from outdoor weather extremes and seasonal temperature swings. Facilities located near metropolitan retail hubs deploy specialized indoor farming equipment to supply high-turnover culinary herbs and leafy greens with minimal transit shrinkage.
- In 2026, Indoor Farming is expected to lead farming method with 68.0% share, supported by predictable schedules near metropolitan buyers.
- However, profitability depends strictly on selecting crops that command premium freshness margins to offset facility power tariffs.
How does Commercial maintain dominance across application demand?
Commercial captures 72.0% of application demand in 2026 as operators standardize large growing rooms and contracted crop programs.
Commercial applications dominate demand with a 72.0% share in 2026 as institutional growers scale industrialized growing chambers tied to long-term grocery procurement contracts. Operators integrate automated dosing sensors with farm management software to guarantee uniform plant height and weight in every harvest batch. While residential and educational kits expand retail awareness, high commercial equipment spend keeps industrial enterprises at the forefront of market revenue.
- By application, Commercial is forecast to represent 72.0% in 2026, underpinned by larger installations and recurring maintenance requirements.
- In October 2025, AeroFarms reported third-party validated results confirming superior nutrient density across indoor-cultivated micro broccoli [5].
What are the drivers, restraints, and opportunities in the aeroponic market?
Water scarcity expands demand, whereas power intensity and root-zone failure risk restrict deployment, and nutritional crop engineering creates higher-value opportunities.
Acute regional water scarcity provides aeroponic technology with a distinct competitive advantage across arid and urban regions where municipal water access is restricted. Closed-loop misting chambers capture and re-filter unabsorbed nutrient solution, cutting field water requirements by more than 90%. Furthermore, deployment of smart agricultural sensors enables real-time monitoring of electrical conductivity and root temperature, preventing small fluidic variations from escalating into catastrophic root dehydration.
- Restraint: Lighting, cooling, filtration, and pump redundancy raise capital and operating costs while system interruptions threaten whole crop zones.
- Opportunity: Sensor-controlled aeroponics supports premium microgreens, nutritionally fortified crops, berries, and specialized plant research.
Growth Analysis and Future Potential: Water-Efficient Production Catalysts
Nozzle fouling represents a critical vulnerability in aeroponic installations because hanging roots lack moisture-retaining substrates found in conventional hydroponic systems. If mist delivery ceases for even fifteen minutes during peak vegetative cycles, crop loss becomes inevitable. Facility managers must consequently install parallel secondary pumps, pressure fail-safes, and multi-stage particulate filters, substantially increasing baseline capital expenditure.
Risk Assessment of the Aeroponic Market: Energy and Root-Zone Friction
A blocked nozzle is more serious in aeroponics than in a substrate farm because the exposed root has no moisture reserve. Operators therefore keep backup pumps, staged filtration and alarms, which raises investment before the first crop is sold. Electricity is another friction when lighting and cooling runs for long hours. The risk is higher for a small grower having one room and one crop, as there is no other zone to absorb the loss. Suppliers that can show mist uniformity, cleaning time and restart procedure are likely to pass commercial trials faster than suppliers only offering a lower equipment price.
Commercial Opportunity Analysis: Crop Fortification and Modular Systems
The highest commercial return emerges when growers use targeted nutrient misting to biofortify specialty crops rather than competing on commodity lettuce volume. Pairing energy-efficient agricultural lighting platforms with ultrasonic aeroponic rolling benches allows operators to customize crop mineral profiles. In March 2026, LettUs Grow, in collaboration with the John Innes Centre, the Quadram Institute, and the University of Bristol, completed multi-year aeroponic research demonstrating vitamin B12 fortification in pea shoots at levels meeting the recommended daily allowance in a 15-gram serving [6], validating functional food cultivation in controlled environments.
Aeroponic Market by Country and Jurisdiction (2026 to 2036)
As per Future Market Insights, the USA represents the fastest-growing aeroponic market among five evaluated jurisdictions at 20.3% CAGR, while the UK records 19.8%. Across covered markets, commercial success depends on smart-farming support, reliable energy access, technical labor, and growers able to convert controlled output into premium produce contracts.
Table 7: Country and Jurisdiction CAGR and Primary Growth Levers for the Aeroponic Market (CAGR percentage and operational drivers), 2026 to 2036
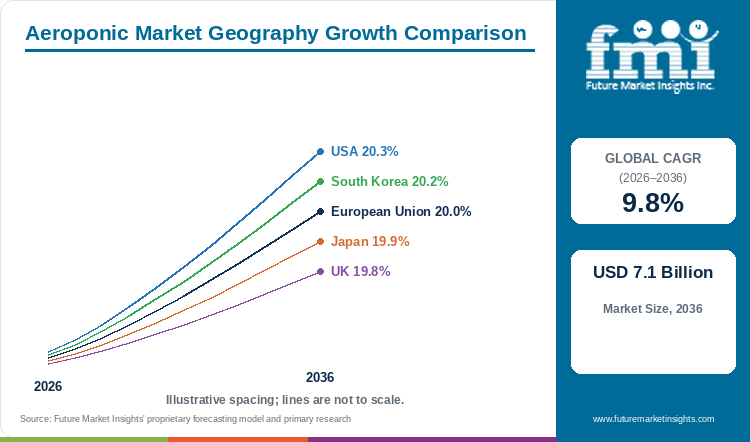
| Country / Jurisdiction | CAGR (2026 to 2036) | Primary Growth Lever |
|---|---|---|
| USA | 20.3% | Urban agriculture support and commercial indoor-farm distribution |
| South Korea | 20.2% | 2025-2029 smart-farming plan and vertical-farm regulatory support |
| European Union | 20.0% | Water efficiency, CEA investment, and resource reporting |
| Japan | 19.9% | Farm-labor decline and smart-agriculture deployment |
| UK | 19.8% | Food-security investment and CEA decarbonization |
Source: Future Market Insights analysis
USA Aeroponic Market Outlook (2026 to 2036)
The United States market exhibits a distinctive trajectory backed by commercial retail distribution networks for branded leafy greens and culinary herbs. Federal agricultural frameworks actively support urban and innovative indoor cultivation facilities, facilitating equipment financing and technical guidance [4]. An anticipated 20.3% CAGR through 2036 remains contingent upon strict energy management, as elevated facility power tariffs require operators to prioritize high-margin microgreens over commodity field crops.
Key takeaway: Federal support for innovative production combines with strong retail channels, while energy discipline determines commercial scale.
South Korea Aeroponic Market Outlook (2026 to 2036)
South Korea is projected to advance at a 20.2% CAGR through 2036, propelled by national agricultural modernization initiatives rather than local fresh produce deficits. Under the 2025-2029 Smart-Farming Master Plan, the government aims to convert 35% of the nation's 55,000 hectares of horticultural greenhouses into modernized facilities deploying smart agriculture solutions and closed-loop misting systems [3]. While automation adoption expands, domestic facilities face operational shortages of certified agronomists capable of fine-tuning nutrient recipes.
Key takeaway: National smart-farm targets create structured demand for automation, training, and integrated cultivation systems.
European Union Aeroponic Market Outlook (2026 to 2036)
European Union demand is likely to grow at 20.0% CAGR through 2036 as water use and energy performance are being examined together. Aeroponics can fit this direction because nutrient solution is recirculated and greenhouse-compatible benches can use daylight instead of depending completely on artificial lighting. The opportunity will not be equal across member states, since electricity price, climate and greenhouse base changes from one country to another. Projects combining heat recovery, efficient lights and measurable water records are more likely to obtain investment, while a fully enclosed farm selling a low-priced crop can remain difficult even with high water saving.
Key takeaway: Resource reporting and water efficiency favor aeroponics, but local energy economics shape project bankability.
Japan Aeroponic Market Outlook (2026 to 2036)
Demographic pressures represent the decisive growth catalyst in Japan, where the Ministry of Agriculture, Forestry and Fisheries projects core agricultural producers to contract from 1.16 million to 300,000 workers over two decades [7]. Consequently, Japan's market is forecast to expand at a 19.9% CAGR through 2036 as commercial growers install automated aeroponic benches to maintain continuous harvest output without labor dependencies.
Key takeaway: Labor decline and compact urban demand support automation-led aeroponics with modular entry points.
UK Aeroponic Market Outlook (2026 to 2036)
In the United Kingdom, market expansion is projected at a 19.8% CAGR through 2036, centered primarily on retrofitting established commercial glasshouses rather than building new fully enclosed vertical facilities. Public sector funding for domestic food security supports controlled agriculture technology adoption [8]. However, volatile grid power prices compel growers to integrate renewable energy generation and waste heat recovery to maintain viable operating margins.
Key takeaway: Innovation support creates openings, while low-carbon energy integration remains central to viable procurement.
Full report coverage includes North America; Latin America; Western Europe; Eastern Europe; East Asia; South Asia and Pacific; Middle East and Africa.
Who are the notable companies in the aeroponic market?
AeroFarms, LettUs Grow Ltd., Airponix Ltd., Eeki Foods, AEssenseGrows, BrightFarms, and Tower Garden are notable companies operating in this market.
Competition in aeroponics is not limited to equipment manufacturers. AeroFarms and Eeki use proprietary growing arrangements to sell produce, while LettUs Grow, Airponix and AEssenseGrows sell the root-zone technology itself. Tower Garden enter through smaller or distributed formats. This difference matters because a crop operator proves the economics through retail sales, whereas a technology supplier has to prove mist uniformity, cleaning access and service response at another grower’s site. Urban farming demand can widen the buyer base, but suppliers having no local technical support may find geographic expansion slower than the product launch suggests.
- Commercial Crop Platforms: AeroFarms, Eeki Foods, and BrightFarms connect controlled production with established produce channels.
- Aeroponic Technology Specialists: LettUs Grow, Airponix, and AEssenseGrows focus on root-zone delivery and environmental control.
Competitive Benchmarking: Aeroponic Market
Table 8: Competitive Benchmarking for the Aeroponic Market (qualitative capability ratings), 2026
| Company | Aeroponic Technology | Commercial Access | Automation Depth | Geographic Reach |
|---|---|---|---|---|
| AeroFarms | High | High | High | Medium |
| LettUs Grow Ltd. | High | High | High | Medium |
| Airponix Ltd. | High | Medium | High | Medium |
| Eeki Foods | High | High | High | Medium |
| AEssenseGrows | High | High | High | High |
| BrightFarms | Low | High | High | Medium |
| Tower Garden | Medium | Medium | Low | High |
Scoring basis: High reflects broad public evidence within the capability. Medium reflects a narrower or partner-led position. Low indicates limited direct evidence for the capability rather than an overall company weakness.
Key Developments in the Aeroponic Market
- In August 2026, AeroFarms expanded national retail distribution by launching indoor-cultivated micro arugula and micro broccoli varieties [9].
- In July 2025, Eeki raised USD 7 million from Sixth Sense Ventures to fund the rollout of its Gen-3 aeroponic growing chambers and expand commercial farm operations across India [10].
- In 2025, Airponix received international recognition in Fast Company’s World Changing Ideas Awards for its precision fog root-nourishment platform [11].
Key Players in the Aeroponic Market
Commercial Crop Platforms
- AeroFarms
- Eeki Foods
- BrightFarms
Aeroponic Technology Specialists
- LettUs Grow Ltd.
- Airponix Ltd.
- AEssenseGrows
Modular and Distributed Systems
- Tower Garden
Aeroponic Market - Report Scope
Table 9: Report Scope for the Aeroponic Market (coverage fields and definitions), 2026 to 2036
| Coverage field | Report scope |
|---|---|
| Market breakdown | Component; Farming Method; Solution; Application; Crop Type; End User |
| Quantitative Units | USD Billion |
| Market Definition | Revenue from aeroponic systems, equipment, controls, integration, and in-scope services using mist-based root nutrition. |
| Regions Covered | North America; Latin America; Western Europe; Eastern Europe; East Asia; South Asia and Pacific; Middle East and Africa |
| Countries / Jurisdictions Covered | USA; South Korea; European Union; Japan; UK; and additional markets in the full report |
| Key Companies Covered | AeroFarms; LettUs Grow; Airponix; Eeki Foods; AEssenseGrows; BrightFarms; Tower Garden |
| Forecast Period | 2026 to 2036 |
| Approach | Primary and secondary research with market triangulation. |
Aeroponic Market - Research Methodology
Table 10: Research Methodology for the Aeroponic Market (research methods and approach), 2026 edition
| Method | Approach |
|---|---|
| Primary Research | Interviews with system manufacturers, component suppliers, commercial growers, distributors, agronomists, industry experts, and key opinion leaders validate purchasing criteria and adoption patterns. |
| Secondary Research | Company annual reports, investor presentations, regulatory publications, industry associations, technical papers, trade journals, company websites, product literature, and public sources support the assessment. |
| Market Sizing and Forecasting | Top-down and bottom-up approaches assess equipment revenue, installation intensity, commercial growing area, pricing, and adoption for 2026 to 2036. |
| Data Triangulation and Validation | Findings are checked against agricultural indicators, water constraints, controlled-environment investment, regulatory direction, company developments, and historical trends. |
Aeroponic Market by Segments
Aeroponic Market segmented by Component:
- Irrigation Component (Misting and Nutrient Delivery)
- Lighting Systems
- Climate Control
- Sensors
- Automation Platforms
- Others
Aeroponic Market segmented by Farming Method:
- Indoor Farming
- Outdoor Farming
- Hybrid Farming
Aeroponic Market segmented by Solution:
- Equipment
- Software and Controls
- Installation and Integration
- Maintenance and Advisory Services
Aeroponic Market segmented by Application:
- Commercial
- Research and Institutional
- Residential
Aeroponic Market segmented by Crop Type:
- Leafy Greens
- Herbs and Microgreens
- Fruiting Vegetables
- Strawberries and Berries
- Root Crops
- Others
Aeroponic Market segmented by End User:
- Commercial Growers
- Vertical Farms
- Greenhouses
- Research Bodies
- Educational Institutions
- Households
Aeroponic Market by Region
- North America
- United States
- Canada
- Latin America
- Brazil
- Mexico
- Argentina
- Chile
- Western Europe
- Germany
- France
- United Kingdom
- Italy
- Spain
- Benelux
- Nordics
- Eastern Europe
- Poland
- Czech Republic
- Romania
- Hungary
- East Asia
- China
- Japan
- South Korea
- South Asia and Pacific
- India
- ASEAN
- Australia and New Zealand
- Middle East and Africa
- GCC Countries
- South Africa
- Turkiye
- Israel
Research Sources and Bibliography
- [1] Chu, S.-W., & Wan, T.-J. (2026, January 20). Advancing sustainable agriculture through aeroponics: A critical review of integrated water-energy-nutrient management and environmental impact mitigation. Agriculture, 16(2), 265.
- [2] U.S. Department of Agriculture, Agricultural Research Service. (2025, January 10). Vertical farming - No longer a futuristic concept. USDA ARS Research Publications.
- [3] Ministry of Agriculture, Food and Rural Affairs, Republic of Korea. (2025, February 26). First Master Plan for Promotion of the Growth of the Smart-Farming Industry, 2025-2029. MAFRA Policy Directives.
- [4] U.S. Department of Agriculture. (2025). Urban agriculture and innovative production grant guidelines. USDA Federal Guidelines.
- [5] AeroFarms. (2025, October 16). Third-party research confirms nutrient density of AeroFarms Micro Broccoli. Commercial Disclosures.
- [6] LettUs Grow. (2026, May 5). Scaling vitamin B12 fortification in aeroponic crops. Corporate Research Publications.
- [7] Ministry of Agriculture, Forestry and Fisheries, Japan. (2025). Strategic initiatives to realize smart agriculture in aging rural demographics. MAFF Technical Reports.
- [8] UK Parliament, Environment, Food and Rural Affairs Committee. (2025, July 16). The Government’s vision for farming: Decarbonization and controlled environment agriculture. EFRA Committee Reports.
- [9] AeroFarms. (2026, August 26). AeroFarms adds Micro Arugula and Micro Broccoli as indoor-grown produce expands retail distribution. Commercial Releases.
- [10] Eeki Foods. (2026). How Eeki is redefining agricultural infrastructure with Gen-3 climate chambers. Corporate Technical Whitepapers.
- [11] Airponix Ltd. (2025). World Changing Ideas recognition and AI-driven precision fog technology. Corporate Announcements.
This bibliography is provided for reader reference and is not exhaustive. The full report contains the complete source record and detailed citations.
This Report Answers
- How large is the aeroponic market in 2026 and what is forecast for 2036?
- Which water, land, and food-security pressures support aeroponic investment?
- Why do irrigation components lead component demand?
- Why does indoor farming lead the farming method category?
- Why do commercial applications account for the largest share?
- How do growth rates differ across the USA, South Korea, the EU, Japan, and the UK?
- Which companies supply aeroponic systems or operate relevant production platforms?
- What should buyers evaluate before purchasing an aeroponic system?
Frequently Asked Questions
How big is the Aeroponic Market in 2026, and what is forecast for 2036?
Future Market Insights estimates the aeroponic market at USD 2.8 billion in 2026 and USD 7.1 billion by 2036, as commercial farms continue taking mist-based production near urban buyers.
What is the CAGR for the Aeroponic Market from 2026 to 2036?
The aeroponic market is projected to grow at a 9.8% CAGR from 2026 to 2036, supported by closed-loop water conservation and automated indoor harvest schedules.
Which component leads the Aeroponic Market?
Irrigation Component leads with 28.0% share in 2026, reflecting the importance of mist delivery, pumping, filtration, and nutrient controls.
Which farming method leads the Aeroponic Market?
Indoor Farming accounts for 68.0% in 2026 as growers seek year-round schedules and environmental control near urban buyers.
Which application holds the largest share?
Commercial applications represent 72.0% in 2026 due to larger installations, contracted crop programs, and ongoing service requirements.
Who are the key players in the market?
Key participants include AeroFarms, LettUs Grow, Airponix, Eeki Foods, AEssenseGrows, Freight Farms, BrightFarms, and Tower Garden.
Preview the report firsthand - request a free sample
Get SampleGet the brochure for pricing and purchase details.
Get PDFTable of Content
- Key Takeaways
- Market Size and CAGR
- Top Growth Driver
- Fastest Growing Segment
- Leading Region
- Key Companies
- Emerging Opportunities
- Executive Summary
- Global Market Outlook
- Demand-side Trends
- Supply-side Trends
- Technology Roadmap Analysis
- Analysis and Recommendations
- Analyst Perspective (What is happening? Why now? What should investors know?)
- Key Questions Answered
- How large is the market?
- What is the CAGR?
- What are key trends?
- Which region dominates?
- Who are the leaders?
- Market Overview
- Market Coverage / Taxonomy
- Market Definition / Scope / Limitations
- Research Methodology
- Chapter Orientation
- Analytical Lens and Working Hypotheses
- Market Structure, Signals, and Trend Drivers
- Benchmarking and Cross-market Comparability
- Market Sizing, Forecasting, and Opportunity Mapping
- Research Design and Evidence Framework
- Desk Research Programme (Secondary Evidence)
- Expert Input and Fieldwork (Primary Evidence)
- Tooling, Models, and Reference Databases
- Data Engineering and Model Build
- Quality Assurance and Audit Trail
- Market Background
- Market Dynamics (Drivers, Restraints, Opportunity, Trends)
- Scenario Forecast (Optimistic, Likely, Conservative)
- Impact Analysis
- AI Impact
- Sustainability Impact
- Regulatory Impact
- Technology Impact
- Consumer / Buyer Analysis
- Purchase Drivers
- Adoption Barriers
- Buyer Journey
- Opportunity Map Analysis
- Product Life Cycle Analysis
- Supply Chain Analysis
- Investment Feasibility Matrix
- Value Chain Analysis
- PESTLE and Porter's Analysis
- Regulatory Landscape
- Regional Parent Market Outlook
- Production and Consumption Statistics
- Import and Export Statistics
- Global Market Analysis and Forecast, 2021 to 2036
- Historical Market Size Value (USD Billion) Analysis, 2021 to 2025
- Current and Future Market Size Value (USD Billion) Projections, 2026 to 2036
- Y-o-Y Growth Trend Analysis
- Absolute $ Opportunity Analysis
- Global Market Pricing Analysis, 2021 to 2036
- Global Market Analysis and Forecast, By Component, 2021 to 2036
- Introduction / Key Findings
- Historical Market Size Value (USD Billion) Analysis By Component, 2021 to 2025
- Current and Future Market Size Value (USD Billion) Analysis and Forecast By Component, 2026 to 2036
- Irrigation Component (Misting and Nutrient Delivery)
- Lighting Systems
- Climate Control
- Sensors
- Automation Platforms
- Others
- Y-o-Y Growth Trend Analysis By Component, 2021 to 2025
- Absolute $ Opportunity Analysis By Component, 2026 to 2036
- Global Market Analysis and Forecast, By Farming Method, 2021 to 2036
- Introduction / Key Findings
- Historical Market Size Value (USD Billion) Analysis By Farming Method, 2021 to 2025
- Current and Future Market Size Value (USD Billion) Analysis and Forecast By Farming Method, 2026 to 2036
- Indoor Farming
- Outdoor Farming
- Hybrid Farming
- Y-o-Y Growth Trend Analysis By Farming Method, 2021 to 2025
- Absolute $ Opportunity Analysis By Farming Method, 2026 to 2036
- Global Market Analysis and Forecast, By Solution, 2021 to 2036
- Introduction / Key Findings
- Historical Market Size Value (USD Billion) Analysis By Solution, 2021 to 2025
- Current and Future Market Size Value (USD Billion) Analysis and Forecast By Solution, 2026 to 2036
- Equipment
- Software and Controls
- Installation and Integration
- Maintenance and Advisory Services
- Y-o-Y Growth Trend Analysis By Solution, 2021 to 2025
- Absolute $ Opportunity Analysis By Solution, 2026 to 2036
- Global Market Analysis and Forecast, By Application, 2021 to 2036
- Introduction / Key Findings
- Historical Market Size Value (USD Billion) Analysis By Application, 2021 to 2025
- Current and Future Market Size Value (USD Billion) Analysis and Forecast By Application, 2026 to 2036
- Commercial
- Research and Institutional
- Residential
- Y-o-Y Growth Trend Analysis By Application, 2021 to 2025
- Absolute $ Opportunity Analysis By Application, 2026 to 2036
- Global Market Analysis and Forecast, By Crop Type, 2021 to 2036
- Introduction / Key Findings
- Historical Market Size Value (USD Billion) Analysis By Crop Type, 2021 to 2025
- Current and Future Market Size Value (USD Billion) Analysis and Forecast By Crop Type, 2026 to 2036
- Leafy Greens
- Herbs and Microgreens
- Fruiting Vegetables
- Strawberries and Berries
- Root Crops
- Others
- Y-o-Y Growth Trend Analysis By Crop Type, 2021 to 2025
- Absolute $ Opportunity Analysis By Crop Type, 2026 to 2036
- Global Market Analysis and Forecast, By End User, 2021 to 2036
- Introduction / Key Findings
- Historical Market Size Value (USD Billion) Analysis By End User, 2021 to 2025
- Current and Future Market Size Value (USD Billion) Analysis and Forecast By End User, 2026 to 2036
- Commercial Growers
- Vertical Farms
- Greenhouses
- Research Bodies
- Educational Institutions
- Households
- Y-o-Y Growth Trend Analysis By End User, 2021 to 2025
- Absolute $ Opportunity Analysis By End User, 2026 to 2036
- Global Market Analysis and Forecast, By Region, 2021 to 2036
- Introduction
- Historical Market Size Value (USD Billion) Analysis By Region, 2021 to 2025
- Current Market Size Value (USD Billion) Analysis and Forecast By Region, 2026 to 2036
- North America
- Latin America
- Western Europe
- Eastern Europe
- East Asia
- South Asia and Pacific
- Middle East and Africa
- Market Attractiveness Analysis By Region
- North America Market Analysis and Forecast, By Country, 2021 to 2036
- Historical Market Size Value (USD Billion) Trend Analysis By Market Taxonomy, 2021 to 2025
- Market Size Value (USD Billion) Forecast By Market Taxonomy, 2026 to 2036
- By Country
- United States
- Canada
- By Component
- By Farming Method
- By Solution
- By Application
- By Crop Type
- By End User
- By Country
- Market Attractiveness Analysis
- By Country
- By Component
- By Farming Method
- By Solution
- By Application
- By Crop Type
- By End User
- Key Takeaways
- Latin America Market Analysis and Forecast, By Country
- Historical Market Size Value (USD Billion) Trend Analysis By Market Taxonomy, 2021 to 2025
- Market Size Value (USD Billion) Forecast By Market Taxonomy, 2026 to 2036
- By Country
- Brazil
- Mexico
- Argentina
- Chile
- By Component
- By Farming Method
- By Solution
- By Application
- By Crop Type
- By End User
- By Country
- Market Attractiveness Analysis
- By Country
- By Component
- By Farming Method
- By Solution
- By Application
- By Crop Type
- By End User
- Key Takeaways
- Western Europe Market Analysis and Forecast, By Country
- Historical Market Size Value (USD Billion) Trend Analysis By Market Taxonomy, 2021 to 2025
- Market Size Value (USD Billion) Forecast By Market Taxonomy, 2026 to 2036
- By Country
- Germany
- France
- United Kingdom
- Italy
- Spain
- Benelux
- Nordics
- By Component
- By Farming Method
- By Solution
- By Application
- By Crop Type
- By End User
- By Country
- Market Attractiveness Analysis
- By Country
- By Component
- By Farming Method
- By Solution
- By Application
- By Crop Type
- By End User
- Key Takeaways
- Eastern Europe Market Analysis and Forecast, By Country
- Historical Market Size Value (USD Billion) Trend Analysis By Market Taxonomy, 2021 to 2025
- Market Size Value (USD Billion) Forecast By Market Taxonomy, 2026 to 2036
- By Country
- Poland
- Czech Republic
- Romania
- Hungary
- By Component
- By Farming Method
- By Solution
- By Application
- By Crop Type
- By End User
- By Country
- Market Attractiveness Analysis
- By Country
- By Component
- By Farming Method
- By Solution
- By Application
- By Crop Type
- By End User
- Key Takeaways
- East Asia Market Analysis and Forecast, By Country
- Historical Market Size Value (USD Billion) Trend Analysis By Market Taxonomy, 2021 to 2025
- Market Size Value (USD Billion) Forecast By Market Taxonomy, 2026 to 2036
- By Country
- China
- Japan
- South Korea
- By Component
- By Farming Method
- By Solution
- By Application
- By Crop Type
- By End User
- By Country
- Market Attractiveness Analysis
- By Country
- By Component
- By Farming Method
- By Solution
- By Application
- By Crop Type
- By End User
- Key Takeaways
- South Asia and Pacific Market Analysis and Forecast, By Country
- Historical Market Size Value (USD Billion) Trend Analysis By Market Taxonomy, 2021 to 2025
- Market Size Value (USD Billion) Forecast By Market Taxonomy, 2026 to 2036
- By Country
- India
- ASEAN
- Australia and New Zealand
- By Component
- By Farming Method
- By Solution
- By Application
- By Crop Type
- By End User
- By Country
- Market Attractiveness Analysis
- By Country
- By Component
- By Farming Method
- By Solution
- By Application
- By Crop Type
- By End User
- Key Takeaways
- Middle East and Africa Market Analysis and Forecast, By Country
- Historical Market Size Value (USD Billion) Trend Analysis By Market Taxonomy, 2021 to 2025
- Market Size Value (USD Billion) Forecast By Market Taxonomy, 2026 to 2036
- By Country
- GCC Countries
- South Africa
- Turkiye
- Israel
- By Component
- By Farming Method
- By Solution
- By Application
- By Crop Type
- By End User
- By Country
- Market Attractiveness Analysis
- By Country
- By Component
- By Farming Method
- By Solution
- By Application
- By Crop Type
- By End User
- Key Takeaways
- Key Countries Market Analysis
- United States
- Pricing Analysis
- Market Share Analysis, 2025
- By Component
- By Farming Method
- By Solution
- By Application
- By Crop Type
- By End User
- Canada
- Pricing Analysis
- Market Share Analysis, 2025
- By Component
- By Farming Method
- By Solution
- By Application
- By Crop Type
- By End User
- Mexico
- Pricing Analysis
- Market Share Analysis, 2025
- By Component
- By Farming Method
- By Solution
- By Application
- By Crop Type
- By End User
- Brazil
- Pricing Analysis
- Market Share Analysis, 2025
- By Component
- By Farming Method
- By Solution
- By Application
- By Crop Type
- By End User
- Chile
- Pricing Analysis
- Market Share Analysis, 2025
- By Component
- By Farming Method
- By Solution
- By Application
- By Crop Type
- By End User
- Germany
- Pricing Analysis
- Market Share Analysis, 2025
- By Component
- By Farming Method
- By Solution
- By Application
- By Crop Type
- By End User
- United Kingdom
- Pricing Analysis
- Market Share Analysis, 2025
- By Component
- By Farming Method
- By Solution
- By Application
- By Crop Type
- By End User
- Italy
- Pricing Analysis
- Market Share Analysis, 2025
- By Component
- By Farming Method
- By Solution
- By Application
- By Crop Type
- By End User
- Spain
- Pricing Analysis
- Market Share Analysis, 2025
- By Component
- By Farming Method
- By Solution
- By Application
- By Crop Type
- By End User
- France
- Pricing Analysis
- Market Share Analysis, 2025
- By Component
- By Farming Method
- By Solution
- By Application
- By Crop Type
- By End User
- India
- Pricing Analysis
- Market Share Analysis, 2025
- By Component
- By Farming Method
- By Solution
- By Application
- By Crop Type
- By End User
- ASEAN
- Pricing Analysis
- Market Share Analysis, 2025
- By Component
- By Farming Method
- By Solution
- By Application
- By Crop Type
- By End User
- Australia and New Zealand
- Pricing Analysis
- Market Share Analysis, 2025
- By Component
- By Farming Method
- By Solution
- By Application
- By Crop Type
- By End User
- China
- Pricing Analysis
- Market Share Analysis, 2025
- By Component
- By Farming Method
- By Solution
- By Application
- By Crop Type
- By End User
- Japan
- Pricing Analysis
- Market Share Analysis, 2025
- By Component
- By Farming Method
- By Solution
- By Application
- By Crop Type
- By End User
- South Korea
- Pricing Analysis
- Market Share Analysis, 2025
- By Component
- By Farming Method
- By Solution
- By Application
- By Crop Type
- By End User
- Poland
- Pricing Analysis
- Market Share Analysis, 2025
- By Component
- By Farming Method
- By Solution
- By Application
- By Crop Type
- By End User
- Hungary
- Pricing Analysis
- Market Share Analysis, 2025
- By Component
- By Farming Method
- By Solution
- By Application
- By Crop Type
- By End User
- South Africa
- Pricing Analysis
- Market Share Analysis, 2025
- By Component
- By Farming Method
- By Solution
- By Application
- By Crop Type
- By End User
- European Union
- Pricing Analysis
- Market Share Analysis, 2025
- By Component
- By Farming Method
- By Solution
- By Application
- By Crop Type
- By End User
- United States
- Market Structure Analysis
- Competition Dashboard
- Competition Benchmarking
- Market Share Analysis of Top Players
- By Regional
- By Component
- By Farming Method
- By Solution
- By Application
- By Crop Type
- By End User
- Emerging Startups
- Innovation Benchmarking
- Competition Analysis
- Competition Deep Dive
- AeroFarms
- Overview
- Product Portfolio
- Profitability by Market Segments
- Sales Footprint
- Strategy Overview
- Marketing Strategy
- Product Strategy
- Channel Strategy
- LettUs Grow Ltd.
- Airponix Ltd.
- Eeki Foods
- AEssenseGrows
- BrightFarms
- Tower Garden
- AeroFarms
- Case Studies
- Success Stories
- Recent Developments
- Competition Deep Dive
- Assumptions & Acronyms Used


