

- Market Size (2026)
- USD 3.05 Bn
- Forecast (2036)
- USD 5.85 Bn
- CAGR (2026 to 2036)
- 6.7%
Aftermarket Custom Exterior Lighting Upgrade Packages Market Size, Market Forecast and Outlook By FMI
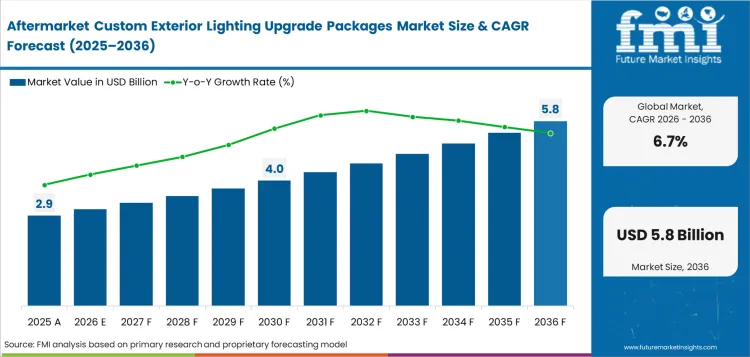
The aftermarket custom exterior lighting upgrade packages market was valued at USD 2.86 billion in 2025 and is estimated at USD 3.05 billion in 2026. It is projected to reach USD 5.85 billion by 2036 at 6.7% CAGR. LED headlamp kits are projected to lead package type demand with 34.0% share. Passenger cars are expected to hold 56.0% share by vehicle type in 2026.
Summary of the Aftermarket Custom Exterior Lighting Upgrade Packages Market
- Demand and Growth Drivers
- Owners are replacing halogen lamps with LED retrofit kits where street legal approvals reduce fitment risk.
- Workshops are attaching lighting upgrades to collision repair and exterior appearance jobs.
- Off-road buyers are adding light bars for trail use where utility value supports package pricing.
- Online sellers are improving fitment filters as buyers compare approval status before ordering kits.
- Product and Segment View
- LED headlamp kits are projected to lead the package type segment with 34.0% share as buyers want clearer road visibility.
- Passenger cars are expected to lead vehicle type demand with 56.0% share given the size of the private car fleet.
- E-commerce is projected to account for 42.0% share of sales channel demand as fitment tables support remote purchase.
- DIY kits are estimated to hold 46.0% share of installation mode demand as plug fit products reduce workshop dependence.
- Geography and Competitive Outlook
- India is expected to record 8.1% CAGR as vehicle ownership and accessory retail widen in metro cities.
- China is projected at 7.6% CAGR as online parts channels and domestic LED supply support upgrade volumes.
- ams OSRAM and Lumileds compete on legal LED retrofit breadth while specialist brands compete on styling packages.
- Regulated markets reward suppliers that publish approvals, compatibility lists and clear installation limits.
- Analyst Opinion
- Nikhil Kaitwade, Principal Consultant at Future Market Insights says, “I see this market becoming less about bright lights and more about safe fitment. Owners still want a sharper look. Workshops and online sellers now need products that pass local lighting rules and install without creating glare. Suppliers that give clear approval proof will win repeat business.”
- Aftermarket Custom Exterior Lighting Upgrade Packages Market Value Analysis
- Demand is rising as owners replace halogen lamps with LED retrofit kits that offer clearer visibility and improved performance for daily driving.
- Growth is supported by workshops bundling lighting upgrades with repair and maintenance jobs, making upgrades more convenient during vehicle service visits.
- Increasing online sales and better fitment tools are enabling buyers to easily compare and purchase compatible lighting kits.
- Rising interest in off-road use and vehicle styling is driving demand for light bars and exterior lighting packages that enhance both utility and appearance.
Key Takeaways, Market Size, and Forecast
- The aftermarket custom exterior lighting upgrade packages market was valued at USD 2.86 billion in 2025.
- By 2036, the market is projected to reach USD 5.85 billion as LED retrofit kits become easier to specify.
- From 2026 to 2036, the market is projected to expand at 6.7% CAGR.
- The market is projected to create an incremental opportunity of USD 2.80 billion between 2026 and 2036.
- LED headlamp kits are projected to account for 34.0% share of package type demand in 2026.
- Passenger cars are expected to account for 56.0% share of vehicle type demand in 2026.
- India at 8.1% CAGR and China at 7.6% CAGR are some of the countries with considerable demand outlook.
Exterior lighting upgrades now face tighter scrutiny because brightness alone does not make a road-use product acceptable. In May 2026, eCFR stated that FMVSS 108 applies to original lamps and replacement lamps. That makes compliance proof central for suppliers selling headlights and fog lights. Vehicle-specific fog packages are gaining relevance because installers need products that fit cleanly and meet road-use rules. In April 2025, Baja Designs said its 2025 Toyota 4Runner S2 SAE kit is designed to meet SAE J583 fog lamp requirements.
The sharp cutoff helps buyers compare light control instead of raw output only. Customization remains important in truck and off-road channels. In November 2025, ORACLE Lighting listed 9,600 lumen low beam output, 7,200 lumen high beam output and IP68 protection for 2016 to 2023 Toyota Tacoma lensless headlights. That gives premium upgrade brands a clearer route through model-specific fitment and durable design.
Aftermarket Custom Exterior Lighting Upgrade Packages Market Definition
The aftermarket custom exterior lighting upgrade packages market covers lighting kits sold after the vehicle leaves the factory. Scope includes LED headlamp kits, light bars, signal lamp upgrades, accent lighting kits, wiring harnesses and controller packs. The market includes parts sold through online stores, specialty retailers, workshops and dealerships. Revenue includes hardware packages and bundled fitment value only when lighting kits are separately identified.
Aftermarket Custom Exterior Lighting Upgrade Packages Market Inclusions
Market scope includes road use LED retrofit products when suppliers claim legal approvals. It also includes off-road light bars, sequential turn signal kits, fog lamp upgrades, daytime running lamp kits and exterior accent packages. The study includes passenger cars, pickup trucks and sport utility vehicles. It also covers light commercial vehicles and motorcycles when exterior lighting upgrades are sold as packages.
Aftermarket Custom Exterior Lighting Upgrade Packages Market Exclusions
Scope excludes original equipment lighting supplied to automakers before vehicle sale. It also excludes interior ambient lighting, ordinary replacement bulbs without upgrade positioning and body kits sold without lighting hardware. Insurance repair lamps are excluded when the part only restores factory fit. Electrical labor is excluded unless it is bundled with the lighting package sale.
Aftermarket Custom Exterior Lighting Upgrade Packages Market Research Methodology
- Primary Research: Future Market Insights analysts reviewed installer feedback, retailer catalogues, fitment notes and supplier approval claims in major aftermarket countries.
- Desk Research: The study used public data from automotive associations, transport authorities, safety regulations and official supplier product releases.
- Market Sizing and Forecasting: The model combined broader lighting accessory value, vehicle parc depth, online parts penetration and package average selling prices.
- Data Validation: Results were reconciled against automotive lighting demand, automotive e-tailing, specialty equipment data and country vehicle fleet indicators.
Why is the Aftermarket Custom Exterior Lighting Upgrade Packages Market Growing?
- Halogen replacement is one of the primary factor owners buy LED headlamp kits for daily road use.
- Exterior styling upgrades are shifting to online stores as fitment filters reduce ordering errors.
- Workshops are attaching lighting upgrades to repair visits when lamp access and vehicle downtime are already part of the repair visit.
Aftermarket exterior lighting is expanding as the product gives owners a visible benefit. A lamp upgrade changes road visibility and exterior appearance in one purchase. Title 49 of the Code of Federal Regulations Section 571.108 specifies requirements for original and replacement lamps, reflective devices and associated equipment. That rule makes approval proof a sales tool in the United States. Products with unclear beam control face more returns and more installer caution.
Online channels are changing how owners purchase lighting kits. FMI analysis on automotive e-tailing industry indicates that parts buyers are shifting more search and comparison activity to online stores. Lighting packages benefit from this channel when listings include bulb type and legal notes. The channel also raises price pressure as comparable kits appear beside each other.
Market Segmentation Analysis
- LED headlamp kits are projected to account for 34.0% share of package type demand in 2026 as daily visibility is the clearest upgrade reason.
- Passenger cars are projected to account for 56.0% share of vehicle type demand in 2026 as the private car fleet gives sellers the widest compatible model pool.
- E-commerce is projected to account for 42.0% share of sales channel demand in 2026 as vehicle-year filters make remote kit selection easier.
- DIY kits are projected to account for 46.0% share of installation mode demand in 2026 as plug-fit formats lower workshop dependence.
- LED retrofit is projected to account for 61.0% share of technology demand in 2026 as halogen replacement gives owners a visible and functional upgrade.
- Enthusiast owners are projected to account for 39.0% share of buyer group demand in 2026 as style-focused owners purchase multi-part exterior packages.
The market is divided into six primary segment groups based on package type, vehicle type, sales channel, installation mode, technology and buyer group. Package type shows what buyers add to the vehicle. Vehicle type shows where the upgrade base is concentrated. Sales channel and installation mode explain how the package reaches owners. Technology and buyer group explain why each kit is selected.
Insights into the LED Headlamp Kits Package Type Segment
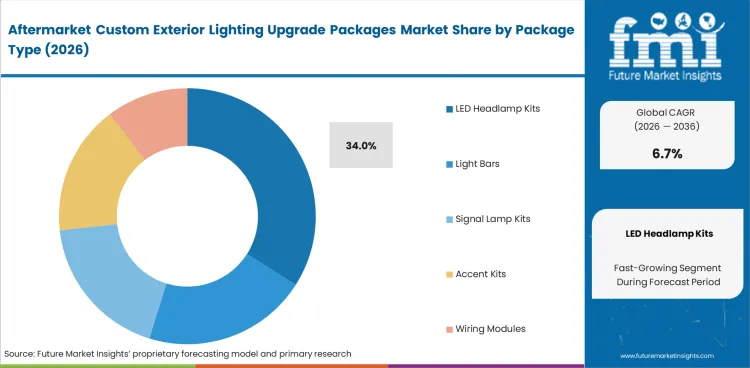
- LED Headlamp Kits is projected to account for 34.0% share of package type demand in 2026. Owners can see the road benefit immediately after installation.
- Road legal LED headlamp kits sell better when approval claims are clear. Lumileds stated in February 2024 that Philips Ultinon Pro6000 Boost offers up to 300% more light versus the legal halogen minimum.
Insights into the Passenger Cars Vehicle Type Segment
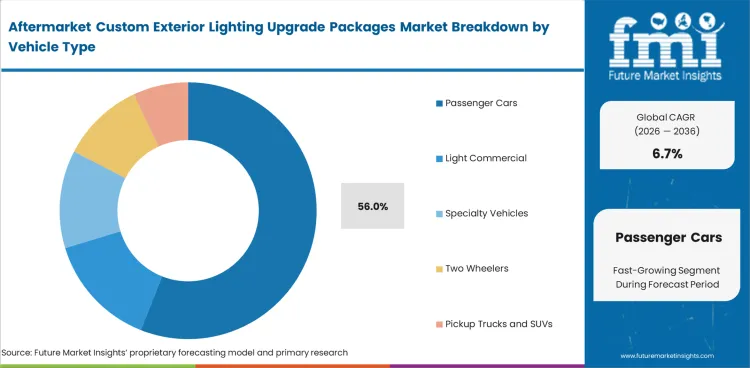
- Passenger cars is projected to account for 56.0% share of vehicle type demand in 2026. The large car fleet gives sellers a wide compatibility pool.
- Passenger cars lead because the installed base is large. The European Automobile Manufacturers Association reported almost 249 million passenger cars across the European Union in 2023.
Insights into the E-commerce Sales Channel Segment
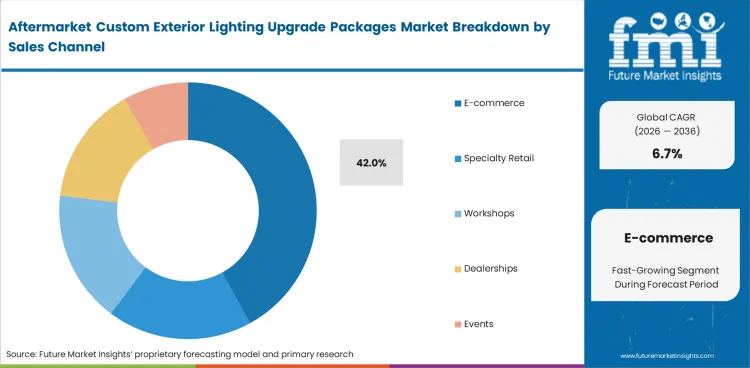
- E-commerce is projected to account for 42.0% share of sales channel demand in 2026. Buyers can compare legal notes and fitment data before ordering.
- Online listings work when fitment data is precise. Sellers lose orders when bulb sizes, housing limits and legal notes are not written clearly.
Insights into the DIY Kits Installation Mode Segment
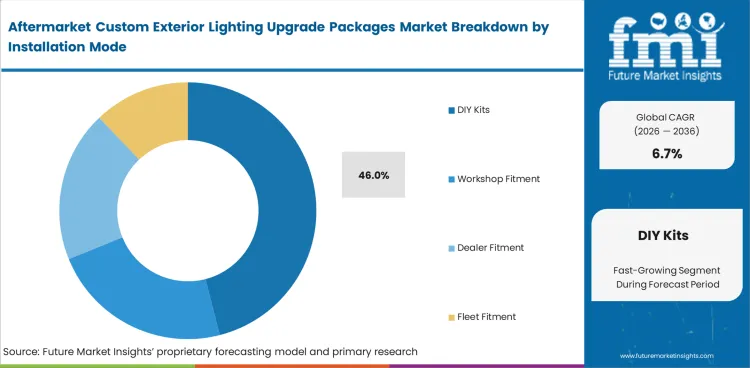
- DIY Kits is projected to account for 46.0% share of installation mode demand in 2026. Plug-fit formats let owners install basic kits with fewer tools.
- DIY kits keep share where plugs and compact heat sinks reduce fitting time. Complex housings send some buyers toward workshops.
Insights into the LED Retrofit Technology Segment
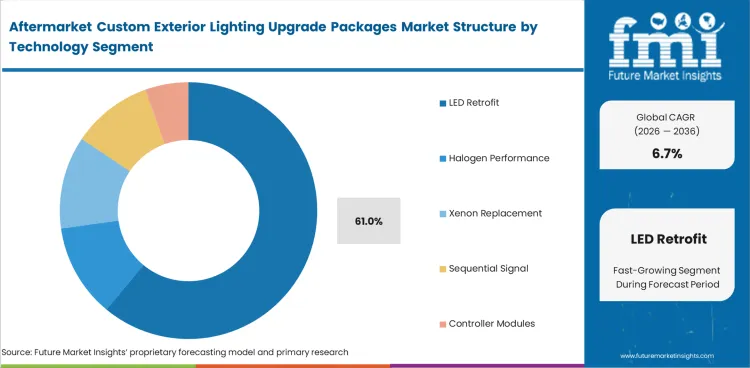
- LED Retrofit is projected to account for 61.0% share of technology demand in 2026. Halogen replacement gives the upgrade a clear performance reason.
- LED retrofit packages benefit from lower energy draw and longer life claims. ENERGY STAR states that LED lighting products produce light up to 90% more efficiently than incandescent bulbs.
Insights into the Enthusiast Owners Buyer Group Segment
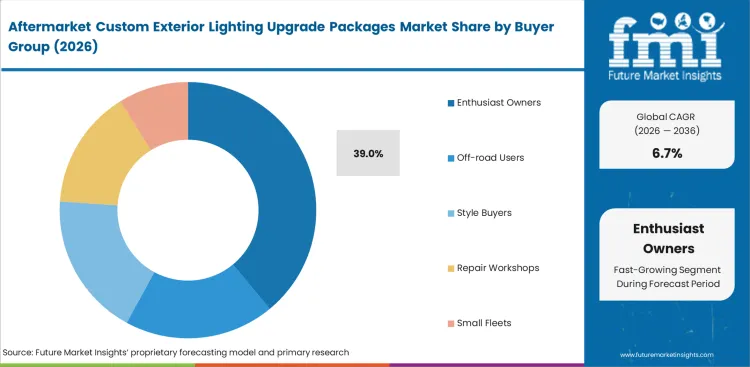
- Enthusiast Owners is projected to account for 39.0% share of buyer group demand in 2026. Style-focused owners often add matching signal and accent kits later.
- Enthusiast owners buy the first upgrade and then add matching signal or accent kits. Bundled product families raise repeat purchase value.
Aftermarket Custom Exterior Lighting Upgrade Packages Market Drivers, Restraints, and Opportunities
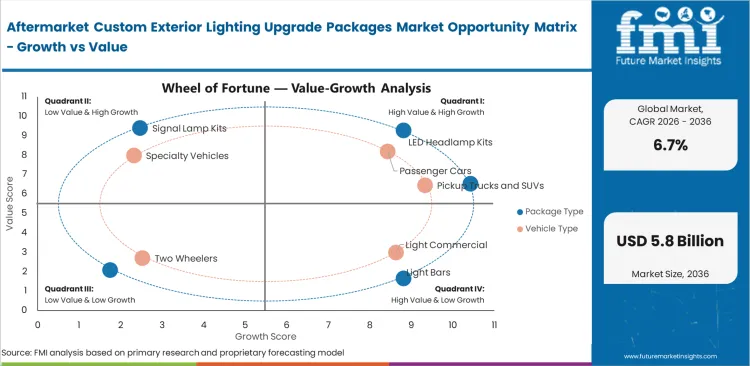
- LED retrofit kits are taking share as legal approval pages reduce uncertainty for workshops and online buyers.
- Glare and color rules constrain poor quality lighting kits in regulated road use markets.
- Off-road light bars create package value where buyers need trail visibility and rugged mounting hardware.
- Fitment databases create opportunity as retailers use vehicle-year matching to lower returns.
Approval Proof Drives Sales
Legal proof is becoming part of the product value. Buyers do not compare brightness because road use rules decide whether a kit is practical. OSRAM states that Night Breaker LED products allow street legal LED upgrades for compatible vehicles. That claim helps retailers explain why one product costs more than an unapproved import. Suppliers with compatibility lists and installation notes are expected to capture more repeat workshop orders.
Glare Rules Limit Poor Kits
Poorly controlled beam patterns create the main restraint for the category. The National Highway Traffic Safety Administration states that auxiliary lamps cannot impair the effectiveness of required lighting equipment. That wording pushes installers to avoid products with unclear color or placement limits. Retailers are expected to favor packages with better beam control and clearer use warnings. Low price kits will keep volume in loose channels but face more returns in regulated channels.
Fitment Data Creates Margin
A significant opportunity is fitment data that tells buyers which kit matches the vehicle. The United States Census Bureau tracks automotive parts, accessory and tire stores as a dedicated retail category. That retail category rewards sellers that reduce installation problems before purchase. Fitment tools and photo guides help convert browsing into completed orders. Packages with wiring, mounts and support can hold better pricing than loose bulbs.
Analysis of Aftermarket Custom Exterior Lighting Upgrade Packages Market By Key Countries
.webp "Top Country Growth Comparison Aftermarket Custom Exterior Lighting Upgrade Packages Market Cagr (2026 2036)")
| Country | CAGR |
|---|---|
| United States | 6.4% |
| China | 7.6% |
| India | 8.1% |
| Germany | 5.9% |
| Japan | 5.4% |
| United Kingdom | 5.7% |
| Brazil | 7.0% |
Source: Future Market Insights analysis based on public source review and proprietary forecasting model.
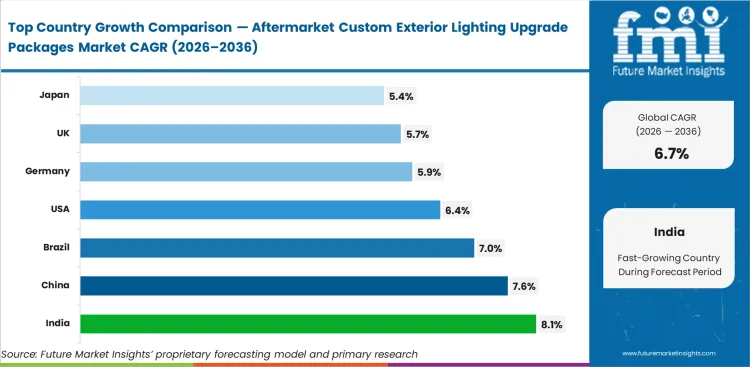
Aftermarket Custom Exterior Lighting Upgrade Packages Market CAGR Analysis By Country
- The United States is projected to record a 6.4% CAGR through 2036 as pickup and off-road accessory buyers sustain package demand.
- China is expected to expand at 7.6% CAGR through 2036 since domestic LED supply supports lower kit prices.
- India is forecast to grow at 8.1% CAGR through 2036 as car ownership and accessory retail widen in large cities.
- Germany is expected to advance at 5.9% CAGR through 2036 because road legal retrofit approval remains central to purchase decisions.
- Japan is projected to rise at 5.4% CAGR through 2036 where compact vehicle fitment limits package size.
- The United Kingdom is forecast at 5.7% CAGR through 2036 as aging vehicles support replacement led upgrade sales.
- Brazil is expected to post 7.0% CAGR through 2036 as pickups and sport utility vehicles support visible exterior upgrades.
The global average of 6.7% reflects a balance between regulated road use and discretionary styling demand. India, China and Brazil are forecast above the average because vehicle ownership and accessory channels are still expanding. Germany, Japan and the United Kingdom are lower because fitment control and compliance proof shape purchases more tightly.
Demand Outlook for Aftermarket Custom Exterior Lighting Upgrade Packages in the United States
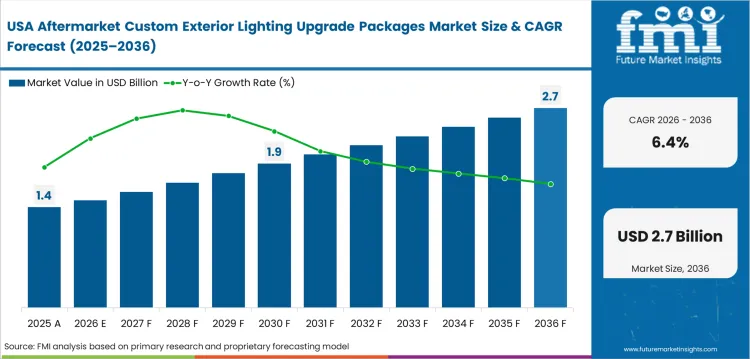
Pickup and sport utility owners keep the United States ahead in higher priced lighting packages. The country is projected to record a 6.4% CAGR during the forecast period as off-road and daily use upgrades overlap. The Specialty Equipment Market Association says its 2025 report covers consumer spending in the 2024 specialty equipment channel. That channel is the main sales channel for light bars and LED headlamp kits. Suppliers that pair bright output with legal notes and warranty support can gain better shelf space.
- California retailers need clear road use notes because vehicle modification enforcement varies by locality.
- Texas pickup owners support light bar sales through off-road events and rural driving needs.
- Michigan workshops can attach lighting upgrades to collision repair and winter visibility jobs.
Sales Analysis of Aftermarket Custom Exterior Lighting Upgrade Packages in China
China supplies a large share of lower cost LED parts and finished lighting kits. China is expected to expand at 7.6% CAGR by 2036 since domestic LED supply supports lower package prices. China’s government reported that new energy vehicles in use exceeded 30 million by the end of 2024. Lighting sellers are expected to adapt styling kits for electric vehicles and compact urban models. Price competition will remain high because domestic supply is large.
- Guangdong factories support online sellers with short production runs and fast tooling changes.
- Shenzhen accessory retailers can test LED accent and signal kits through livestream commerce.
- Chengdu and Chongqing dealers reach sport utility owners who buy exterior styling packages.
Demand Analysis of Aftermarket Custom Exterior Lighting Upgrade Packages in India
Metro buyers in India are adding exterior lighting as cars become visible personal products. India is forecast to grow at 8.1% CAGR over the assessment period as ownership rises and accessory stores widen in large cities. The Society of Indian Automobile Manufacturers reported 4.3 million passenger vehicle sales in fiscal year 2024 to 2025. This expands the future upgrade base for lamps, accents and fitment kits. Suppliers need heat-tolerant products and clear warranty terms for Indian use.
- Delhi accessory hubs need plug fit kits that reduce installation time in dense retail clusters.
- Gujarat car ownership growth supports lighting upgrades through Ahmedabad and Surat accessory stores.
- Tamil Nadu vehicle production depth supports local channel knowledge for fitment and service.
Opportunity Analysis of Aftermarket Custom Exterior Lighting Upgrade Packages in Germany
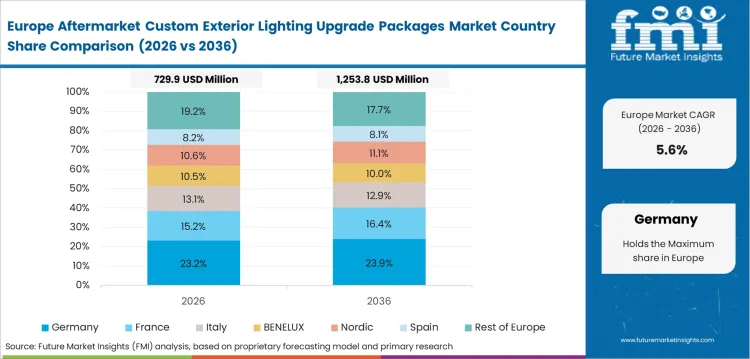
German buyers put road approval ahead of low price when lighting affects street use. Germany is expected to advance at 5.9% CAGR across the forecast decade as certified retrofit breadth shapes workshop acceptance. OSRAM says its Night Breaker LED W5W won a German Innovation Award in 2024. That product removed some approval matching steps for buyers. Suppliers with homologated lamps can earn trust where installers avoid unclear imported kits.
- Bavaria workshops serve owners who prefer approved LED retrofit bulbs over unverified bright kits.
- North Rhine Westphalia parts stores can sell lighting kits through dense commuter vehicle use.
- Stuttgart-area suppliers link retrofit demand with local automotive engineering expectations.
Future Outlook for Aftermarket Custom Exterior Lighting Upgrade Packages in Japan
Japan’s fitment culture favors products that suit compact vehicles and pass inspection discipline. Japan is projected to rise at 5.4% CAGR by the end of 2036 as limited space keeps package design conservative. The International Organization of Motor Vehicle Manufacturers lists Japan among the countries tracked in its 2025 vehicle production data. Local buyers are expected to favor compact LED bulbs and signal upgrades over large exterior light bars.
- Tokyo installers need compact products that suit kei cars and dense parking conditions.
- Nagoya channels can use domestic vehicle model knowledge to reduce fitment errors.
- Osaka accessory shops focus on small lamps and styling kits that avoid inspection problems.
Demand Outlook for Aftermarket Custom Exterior Lighting Upgrade Packages in the United Kingdom
The United Kingdom upgrade base depends on a large vehicle parc and repair-based replacement. The United Kingdom is forecast at 5.7% CAGR over the ten-year period as aging vehicles support LED replacement purchases. The Department for Transport reported 2.605 million vehicles registered for the first time in 2024. This keeps the future parc supplied with vehicles that later enter accessory channels. Suppliers need clear MOT suitability notes and retailer support.
- Midlands accessory stores can pair lamp upgrades with used vehicle refurbishment work.
- Scotland buyers value auxiliary lighting for rural roads and seasonal visibility needs.
- London workshops need compliant styling kits that avoid inspection and urban enforcement risk.
In-depth Analysis of Aftermarket Custom Exterior Lighting Upgrade Packages in Brazil
Brazil combines urban styling demand with pickup and sport utility vehicle use. Brazil is expected to post 7.0% CAGR during the forecast window as visible exterior upgrades remain part of accessory culture. The Brazilian Association of Automotive Vehicle Manufacturers publishes monthly vehicle production statistics through its ANFAVEA Letter. Vehicle output and a large used vehicle base support lighting package sales.
- São Paulo distributors can scale LED headlamp kits through dense accessory wholesale networks.
- Minas Gerais pickup users support auxiliary lighting for mixed urban and rural driving.
- Paraná workshops can attach lighting upgrades to vehicle personalization and repair visits.
Competitive Landscape and Strategic Positioning
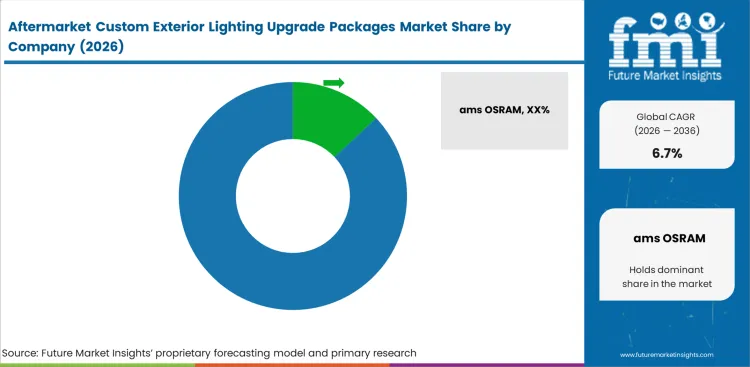
- The competitive outlook in the market is split between global lamp brands and specialist exterior styling suppliers.
- Global companies compete on legal approvals and bulb range. Warranty support also affects repeat workshop orders.
- Specialist brands compete through vehicle-specific kits and light bars. Appearance packages create a separate style route.
- Entry barriers include beam control and heat management. Fitment data and channel trust decide repeat orders.
Competition in the industry is best understood by buyer problem. A daily driver wants safer visibility and a legal upgrade. An off-road buyer wants output and mounting hardware. A styling buyer wants a look that matches the vehicle design. This split gives global lamp makers an advantage in road legal LED bulbs. It gives specialist brands room in light bars and appearance packages.
ams OSRAM and Lumileds have the clearest road legal retrofit positions in Europe. Their product pages emphasize approval status and compatibility support. HELLA and Valeo sit closer to original equipment lighting knowledge and aftermarket distribution. Diode Dynamics, Morimoto and Oracle Lighting compete where enthusiasts want vehicle-specific appearance and higher visual change. Smaller suppliers lose large accounts when they cannot prove beam pattern quality or support returns. The bridge from original equipment to upgrades affects supplier positioning. Broader adaptive front lighting shows how vehicle lighting is becoming more electronic and model specific. Aftermarket suppliers need not copy factory systems, but they must explain safe installation and avoid interfering with required lamps.
Key Companies in the Aftermarket Custom Exterior Lighting Upgrade Packages Market
Competition is best grouped by role as road legal bulbs, styling kits and off-road packages follow different buying logic.
- Road Legal Retrofit Leaders: ams OSRAM and Lumileds hold stronger positions in LED retrofit bulbs through approval proof and compatibility tools.
- Aftermarket and Original Equipment Lighting Specialists: HELLA and Valeo use lighting engineering depth and distribution links to support wider portfolios.
- Custom and Enthusiast Package Specialists: Diode Dynamics, Morimoto and Oracle Lighting compete through model-specific design and clear exterior styling value.
Competitive Benchmarking: Aftermarket Custom Exterior Lighting Upgrade Packages Market
| Company | Approval Proof | Fitment Depth | Custom Package Breadth | Geographic Footprint |
|---|---|---|---|---|
| ams OSRAM | High | High | Medium | Europe led with global distribution |
| Lumileds | High | High | Medium | Europe and global aftermarket reach |
| HELLA | Medium | High | Medium | Europe led with aftermarket depth |
| Valeo | Medium | Medium | Medium | Global lighting and service network |
| Diode Dynamics | Medium | High | High | North America led enthusiast channel |
| Morimoto | Medium | High | High | North America led specialty retail |
| Oracle Lighting | Medium | Medium | High | United States custom lighting base |
Source: Future Market Insights analysis based on public supplier portfolios and product evidence.
Key Developments in Aftermarket Custom Exterior Lighting Upgrade Packages Market
- In February 2024, Lumileds launched Philips Ultinon Pro6000 Boost LED retrofit bulbs with up to 300% more light compared with the halogen legal minimum.
- In May 2024, OSRAM Night Breaker LED W5W received a German Innovation Award and reduced approval matching steps for certain lamp functions.
- In March 2025, Valeo licensed TactoTek in-mold structural electronics technology for interior and exterior lighting applications.
- In April 2026, Valeo showcased commercial vehicle technologies at ACT Expo and reinforced lighting as part of vehicle safety systems.
Key Players in the Aftermarket Custom Exterior Lighting Upgrade Packages Market
Road Legal Retrofit Leaders
- ams OSRAM
- Lumileds
Aftermarket and Original Equipment Lighting Specialists
- HELLA
- Valeo
Custom and Enthusiast Package Specialists
- Diode Dynamics
- Morimoto
- Oracle Lighting
Report Scope and Coverage
| Item | Value |
|---|---|
| Quantitative Units | USD 3.05 billion to USD 5.85 billion with 6.7% CAGR |
| Market Definition | Aftermarket exterior lighting kits sold after vehicle sale for upgrade or custom use |
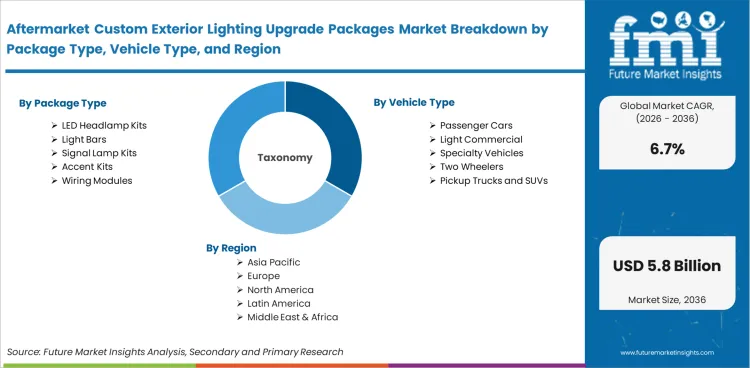
| Package Type | LED Headlamp Kits, Light Bars, Signal Lamp Kits, Accent Kits, Wiring Modules |
| Vehicle Type | Passenger Cars, Pickup Trucks and SUVs, Light Commercial, Specialty Vehicles, Two Wheelers |
| Sales Channel | E-commerce, Specialty Retail, Workshops, Dealerships, Events |
| Installation Mode | DIY Kits, Workshop Fitment, Dealer Fitment, Fleet Fitment |
| Technology | LED Retrofit, Halogen Performance, Xenon Replacement, Sequential Signal, Controller Modules |
| Buyer Group | Enthusiast Owners, Off-road Users, Style Buyers, Repair Workshops, Small Fleets |
| Regions Covered | North America, Latin America, Europe, East Asia, South Asia and Pacific, Middle East and Africa |
| Countries Covered | United States, China, India, Germany, Japan, United Kingdom, Brazil |
| Key Companies Profiled | ams OSRAM, Lumileds, HELLA, Valeo, Diode Dynamics, Morimoto, Oracle Lighting |
| Forecast Period | 2026 to 2036 |
| Approach | Hybrid top-down and bottom-up model with public source triangulation |
Aftermarket Custom Exterior Lighting Upgrade Packages Market by Segments
By Package Type
- LED Headlamp Kits
- Light Bars
- Signal Lamp Kits
- Accent Kits
- Wiring Modules
By Vehicle Type
- Passenger Cars
- Pickup Trucks and SUVs
- Light Commercial
- Specialty Vehicles
- Two Wheelers
By Sales Channel
- E-commerce
- Specialty Retail
- Workshops
- Dealerships
- Events
By Installation Mode
- DIY Kits
- Workshop Fitment
- Dealer Fitment
- Fleet Fitment
By Technology
- LED Retrofit
- Halogen Performance
- Xenon Replacement
- Sequential Signal
- Controller Modules
By Buyer Group
- Enthusiast Owners
- Off-road Users
- Style Buyers
- Repair Workshops
- Small Fleets
By Region
- North America
- Latin America
- Europe
- East Asia
- South Asia and Pacific
- Middle East and Africa
Research Sources and Bibliography
- Auto Care Association. (2026). Auto Care Factbook and industry overview.
- Electronic Code of Federal Regulations. (May 2026). 49 CFR 571.108 lamps reflective devices and associated equipment.
- National Highway Traffic Safety Administration. (May 2026). FMVSS 108 interpretation on auxiliary front color changing light.
- European Automobile Manufacturers Association. (January 2025). Vehicles on European roads 2025.
- United Kingdom Department for Transport. (June 2025). Vehicle licensing statistics United Kingdom 2024.
- Lumileds. (February 2024). Philips Ultinon Pro6000 Boost road legal LED retrofit bulbs.
- Lumileds. (May 2024). Philips Ultinon Pro6000 Boost bulbs for H1 headlights.
- OSRAM GmbH. (May 2026). Night Breaker LED and automotive lighting portfolio.
- OSRAM GmbH. (May 2026). OSRAM automotive awards for Night Breaker LED products.
- Valeo. (March 2025). Valeo and TactoTek announce collaboration for automotive lighting solutions.
- International Organization of Motor Vehicle Manufacturers. (May 2026). Production statistics.
- Society of Indian Automobile Manufacturers. (August 2025). Annual report 2024 to 2025.
- Federal Reserve Bank of St. Louis. (May 2026). Retail sales: Automotive parts, accessory, and tire stores. FRED.
- ENERGY STAR. (May 2026). Learn about LED lighting.
This bibliography is provided for reader reference and is not exhaustive. The full report contains the complete reference list and detailed citations.
This Report Answers
- What is the value of the Aftermarket Custom Exterior Lighting Upgrade Packages Market in 2026 and 2036?
- Which lighting package type holds the highest 2026 share and why does it lead?
- Which sales channel is expected to control the largest share of package demand?
- How do road use rules affect LED retrofit and auxiliary lighting kit sales?
- Which countries show the fastest outlook and which factors explain the spread?
- Which companies compete through approvals, fitment support and custom package breadth?
Frequently Asked Questions
What is the value of the Aftermarket Custom Exterior Lighting Upgrade Packages Market in 2026?
The aftermarket custom exterior lighting upgrade packages market is estimated at USD 3.05 billion in 2026 based on FMI analysis.
What will the Aftermarket Custom Exterior Lighting Upgrade Packages Market be worth by 2036?
The market is projected to reach USD 5.85 billion by 2036 as LED retrofit and light bar packages expand.
What CAGR is expected for the Aftermarket Custom Exterior Lighting Upgrade Packages Market?
The market is projected to expand at 6.7% CAGR from 2026 to 2036 across the forecast period.
Which package type leads the Aftermarket Custom Exterior Lighting Upgrade Packages Market?
LED headlamp kits lead with 34.0% share in 2026 since visibility upgrades offer the clearest buyer benefit.
Which sales channel leads the Aftermarket Custom Exterior Lighting Upgrade Packages Market?
E-commerce leads with 42.0% share in 2026 as vehicle-year filters help buyers choose compatible lighting packages.
Which country grows fastest in the Aftermarket Custom Exterior Lighting Upgrade Packages Market?
India grows fastest at 8.1% CAGR as car ownership and accessory retail widen across metro markets.
How do rules affect the Aftermarket Custom Exterior Lighting Upgrade Packages Market?
Lighting rules raise the value of approved kits because workshops avoid products that risk glare or inspection failure.
What limits the Aftermarket Custom Exterior Lighting Upgrade Packages Market?
The main limit is unclear compliance proof because buyers and installers avoid products with uncertain beam control.
Are LED kits better than halogen upgrades in this market?
LED kits usually carry more upgrade value because they offer clearer visibility and longer life when beam design is controlled.
What creates payback for buyers in this market?
Payback comes from better night visibility, fewer replacements and a stronger vehicle look without changing major body parts.
Preview the report firsthand - request a free sample
Get SampleGet the brochure for pricing and purchase details.
Get PDFTable of Content
- Key Takeaways
- Market Size and CAGR
- Top Growth Driver
- Fastest Growing Segment
- Leading Region
- Key Companies
- Emerging Opportunities
- Executive Summary
- Global Market Outlook
- Demand-side Trends
- Supply-side Trends
- Technology Roadmap Analysis
- Analysis and Recommendations
- Analyst Perspective (What is happening? Why now? What should investors know?)
- Key Questions Answered
- How large is the market?
- What is the CAGR?
- What are key trends?
- Which region dominates?
- Who are the leaders?
- Market Overview
- Market Coverage / Taxonomy
- Market Definition / Scope / Limitations
- Research Methodology
- Chapter Orientation
- Analytical Lens and Working Hypotheses
- Market Structure, Signals, and Trend Drivers
- Benchmarking and Cross-market Comparability
- Market Sizing, Forecasting, and Opportunity Mapping
- Research Design and Evidence Framework
- Desk Research Programme (Secondary Evidence)
- Expert Input and Fieldwork (Primary Evidence)
- Tooling, Models, and Reference Databases
- Data Engineering and Model Build
- Quality Assurance and Audit Trail
- Market Background
- Market Dynamics (Drivers, Restraints, Opportunity, Trends)
- Scenario Forecast (Optimistic, Likely, Conservative)
- Impact Analysis
- AI Impact
- Sustainability Impact
- Regulatory Impact
- Technology Impact
- Consumer / Buyer Analysis
- Purchase Drivers
- Adoption Barriers
- Buyer Journey
- Opportunity Map Analysis
- Product Life Cycle Analysis
- Supply Chain Analysis
- Investment Feasibility Matrix
- Value Chain Analysis
- PESTLE and Porter's Analysis
- Regulatory Landscape
- Regional Parent Market Outlook
- Production and Consumption Statistics
- Import and Export Statistics
- Global Market Analysis and Forecast, 2021 to 2036
- Historical Market Size Value (USD Billion) & Volume (Unit) Analysis, 2021 to 2025
- Current and Future Market Size Value (USD Billion) & Volume (Unit) Projections, 2026 to 2036
- Y-o-Y Growth Trend Analysis
- Absolute $ Opportunity Analysis
- Global Market Pricing Analysis, 2021 to 2036
- Global Market Analysis and Forecast, By Package Type, 2021 to 2036
- Introduction / Key Findings
- Historical Market Size Value (USD Billion) & Volume (Unit) Analysis By Package Type, 2021 to 2025
- Current and Future Market Size Value (USD Billion) & Volume (Unit) Analysis and Forecast By Package Type, 2026 to 2036
- LED Headlamp Kits
- Light Bars
- Signal Lamp Kits
- Accent Kits
- Wiring Modules
- LED Headlamp Kits
- Y-o-Y Growth Trend Analysis By Package Type, 2021 to 2025
- Absolute $ Opportunity Analysis By Package Type, 2026 to 2036
- Global Market Analysis and Forecast, By Vehicle Type, 2021 to 2036
- Introduction / Key Findings
- Historical Market Size Value (USD Billion) & Volume (Unit) Analysis By Vehicle Type, 2021 to 2025
- Current and Future Market Size Value (USD Billion) & Volume (Unit) Analysis and Forecast By Vehicle Type, 2026 to 2036
- Passenger Cars
- Pickup Trucks and SUVs
- Light Commercial
- Specialty Vehicles
- Two Wheelers
- Passenger Cars
- Y-o-Y Growth Trend Analysis By Vehicle Type, 2021 to 2025
- Absolute $ Opportunity Analysis By Vehicle Type, 2026 to 2036
- Global Market Analysis and Forecast, By Sales Channel, 2021 to 2036
- Introduction / Key Findings
- Historical Market Size Value (USD Billion) & Volume (Unit) Analysis By Sales Channel, 2021 to 2025
- Current and Future Market Size Value (USD Billion) & Volume (Unit) Analysis and Forecast By Sales Channel, 2026 to 2036
- E-commerce
- Specialty Retail
- Workshops
- Dealerships
- Events
- E-commerce
- Y-o-Y Growth Trend Analysis By Sales Channel, 2021 to 2025
- Absolute $ Opportunity Analysis By Sales Channel, 2026 to 2036
- Global Market Analysis and Forecast, By Installation Mode, 2021 to 2036
- Introduction / Key Findings
- Historical Market Size Value (USD Billion) & Volume (Unit) Analysis By Installation Mode, 2021 to 2025
- Current and Future Market Size Value (USD Billion) & Volume (Unit) Analysis and Forecast By Installation Mode, 2026 to 2036
- DIY Kits
- Workshop Fitment
- Dealer Fitment
- Fleet Fitment
- DIY Kits
- Y-o-Y Growth Trend Analysis By Installation Mode, 2021 to 2025
- Absolute $ Opportunity Analysis By Installation Mode, 2026 to 2036
- Global Market Analysis and Forecast, By Technology, 2021 to 2036
- Introduction / Key Findings
- Historical Market Size Value (USD Billion) & Volume (Unit) Analysis By Technology, 2021 to 2025
- Current and Future Market Size Value (USD Billion) & Volume (Unit) Analysis and Forecast By Technology, 2026 to 2036
- LED Retrofit
- Halogen Performance
- Xenon Replacement
- Sequential Signal
- Controller Modules
- LED Retrofit
- Y-o-Y Growth Trend Analysis By Technology, 2021 to 2025
- Absolute $ Opportunity Analysis By Technology, 2026 to 2036
- Global Market Analysis and Forecast, By Buyer Group
- Introduction / Key Findings
- Historical Market Size Value (USD Billion) & Volume (Unit) Analysis By Buyer Group, 2021 to 2025
- Current and Future Market Size Value (USD Billion) & Volume (Unit) Analysis and Forecast By Buyer Group, 2026 to 2036
- Enthusiast Owners
- Off-road Users
- Style Buyers
- Repair Workshops
- Small Fleets
- Enthusiast Owners
- Y-o-Y Growth Trend Analysis By Buyer Group, 2021 to 2025
- Absolute $ Opportunity Analysis By Buyer Group, 2026 to 2036
- Global Market Analysis and Forecast, By Region, 2021 to 2036
- Introduction
- Historical Market Size Value (USD Billion) & Volume (Unit) Analysis By Region, 2021 to 2025
- Current Market Size Value (USD Billion) & Volume (Unit) Analysis and Forecast By Region, 2026 to 2036
- North America
- Latin America
- Western Europe
- Eastern Europe
- East Asia
- South Asia and Pacific
- Middle East & Africa
- Market Attractiveness Analysis By Region
- North America Market Analysis and Forecast, By Country, 2021 to 2036
- Historical Market Size Value (USD Billion) & Volume (Unit) Trend Analysis By Market Taxonomy, 2021 to 2025
- Market Size Value (USD Billion) & Volume (Unit) Forecast By Market Taxonomy, 2026 to 2036
- By Country
- USA
- Canada
- Mexico
- By Package Type
- By Vehicle Type
- By Sales Channel
- By Installation Mode
- By Technology
- By Buyer Group
- By Country
- Market Attractiveness Analysis
- By Country
- By Package Type
- By Vehicle Type
- By Sales Channel
- By Installation Mode
- By Technology
- By Buyer Group
- Key Takeaways
- Latin America Market Analysis and Forecast, By Country
- Historical Market Size Value (USD Billion) & Volume (Unit) Trend Analysis By Market Taxonomy, 2021 to 2025
- Market Size Value (USD Billion) & Volume (Unit) Forecast By Market Taxonomy, 2026 to 2036
- By Country
- Brazil
- Chile
- Rest of Latin America
- By Package Type
- By Vehicle Type
- By Sales Channel
- By Installation Mode
- By Technology
- By Buyer Group
- By Country
- Market Attractiveness Analysis
- By Country
- By Package Type
- By Vehicle Type
- By Sales Channel
- By Installation Mode
- By Technology
- By Buyer Group
- Key Takeaways
- Western Europe Market Analysis and Forecast, By Country
- Historical Market Size Value (USD Billion) & Volume (Unit) Trend Analysis By Market Taxonomy, 2021 to 2025
- Market Size Value (USD Billion) & Volume (Unit) Forecast By Market Taxonomy, 2026 to 2036
- By Country
- Germany
- UK
- Italy
- Spain
- France
- Nordic
- BENELUX
- Rest of Western Europe
- By Package Type
- By Vehicle Type
- By Sales Channel
- By Installation Mode
- By Technology
- By Buyer Group
- By Country
- Market Attractiveness Analysis
- By Country
- By Package Type
- By Vehicle Type
- By Sales Channel
- By Installation Mode
- By Technology
- By Buyer Group
- Key Takeaways
- Eastern Europe Market Analysis and Forecast, By Country
- Historical Market Size Value (USD Billion) & Volume (Unit) Trend Analysis By Market Taxonomy, 2021 to 2025
- Market Size Value (USD Billion) & Volume (Unit) Forecast By Market Taxonomy, 2026 to 2036
- By Country
- Russia
- Poland
- Hungary
- Balkan & Baltic
- Rest of Eastern Europe
- By Package Type
- By Vehicle Type
- By Sales Channel
- By Installation Mode
- By Technology
- By Buyer Group
- By Country
- Market Attractiveness Analysis
- By Country
- By Package Type
- By Vehicle Type
- By Sales Channel
- By Installation Mode
- By Technology
- By Buyer Group
- Key Takeaways
- East Asia Market Analysis and Forecast, By Country
- Historical Market Size Value (USD Billion) & Volume (Unit) Trend Analysis By Market Taxonomy, 2021 to 2025
- Market Size Value (USD Billion) & Volume (Unit) Forecast By Market Taxonomy, 2026 to 2036
- By Country
- China
- Japan
- South Korea
- By Package Type
- By Vehicle Type
- By Sales Channel
- By Installation Mode
- By Technology
- By Buyer Group
- By Country
- Market Attractiveness Analysis
- By Country
- By Package Type
- By Vehicle Type
- By Sales Channel
- By Installation Mode
- By Technology
- By Buyer Group
- Key Takeaways
- South Asia and Pacific Market Analysis and Forecast, By Country
- Historical Market Size Value (USD Billion) & Volume (Unit) Trend Analysis By Market Taxonomy, 2021 to 2025
- Market Size Value (USD Billion) & Volume (Unit) Forecast By Market Taxonomy, 2026 to 2036
- By Country
- India
- ASEAN
- Australia & New Zealand
- Rest of South Asia and Pacific
- By Package Type
- By Vehicle Type
- By Sales Channel
- By Installation Mode
- By Technology
- By Buyer Group
- By Country
- Market Attractiveness Analysis
- By Country
- By Package Type
- By Vehicle Type
- By Sales Channel
- By Installation Mode
- By Technology
- By Buyer Group
- Key Takeaways
- Middle East & Africa Market Analysis and Forecast, By Country
- Historical Market Size Value (USD Billion) & Volume (Unit) Trend Analysis By Market Taxonomy, 2021 to 2025
- Market Size Value (USD Billion) & Volume (Unit) Forecast By Market Taxonomy, 2026 to 2036
- By Country
- Kingdom of Saudi Arabia
- Other GCC Countries
- Türkiye
- South Africa
- Other African Union
- Rest of Middle East & Africa
- By Package Type
- By Vehicle Type
- By Sales Channel
- By Installation Mode
- By Technology
- By Buyer Group
- By Country
- Market Attractiveness Analysis
- By Country
- By Package Type
- By Vehicle Type
- By Sales Channel
- By Installation Mode
- By Technology
- By Buyer Group
- Key Takeaways
- Key Countries Market Analysis
- USA
- Pricing Analysis
- Market Share Analysis, 2025
- By Package Type
- By Vehicle Type
- By Sales Channel
- By Installation Mode
- By Technology
- By Buyer Group
- Canada
- Pricing Analysis
- Market Share Analysis, 2025
- By Package Type
- By Vehicle Type
- By Sales Channel
- By Installation Mode
- By Technology
- By Buyer Group
- Mexico
- Pricing Analysis
- Market Share Analysis, 2025
- By Package Type
- By Vehicle Type
- By Sales Channel
- By Installation Mode
- By Technology
- By Buyer Group
- Brazil
- Pricing Analysis
- Market Share Analysis, 2025
- By Package Type
- By Vehicle Type
- By Sales Channel
- By Installation Mode
- By Technology
- By Buyer Group
- Chile
- Pricing Analysis
- Market Share Analysis, 2025
- By Package Type
- By Vehicle Type
- By Sales Channel
- By Installation Mode
- By Technology
- By Buyer Group
- Germany
- Pricing Analysis
- Market Share Analysis, 2025
- By Package Type
- By Vehicle Type
- By Sales Channel
- By Installation Mode
- By Technology
- By Buyer Group
- UK
- Pricing Analysis
- Market Share Analysis, 2025
- By Package Type
- By Vehicle Type
- By Sales Channel
- By Installation Mode
- By Technology
- By Buyer Group
- Italy
- Pricing Analysis
- Market Share Analysis, 2025
- By Package Type
- By Vehicle Type
- By Sales Channel
- By Installation Mode
- By Technology
- By Buyer Group
- Spain
- Pricing Analysis
- Market Share Analysis, 2025
- By Package Type
- By Vehicle Type
- By Sales Channel
- By Installation Mode
- By Technology
- By Buyer Group
- France
- Pricing Analysis
- Market Share Analysis, 2025
- By Package Type
- By Vehicle Type
- By Sales Channel
- By Installation Mode
- By Technology
- By Buyer Group
- India
- Pricing Analysis
- Market Share Analysis, 2025
- By Package Type
- By Vehicle Type
- By Sales Channel
- By Installation Mode
- By Technology
- By Buyer Group
- ASEAN
- Pricing Analysis
- Market Share Analysis, 2025
- By Package Type
- By Vehicle Type
- By Sales Channel
- By Installation Mode
- By Technology
- By Buyer Group
- Australia & New Zealand
- Pricing Analysis
- Market Share Analysis, 2025
- By Package Type
- By Vehicle Type
- By Sales Channel
- By Installation Mode
- By Technology
- By Buyer Group
- China
- Pricing Analysis
- Market Share Analysis, 2025
- By Package Type
- By Vehicle Type
- By Sales Channel
- By Installation Mode
- By Technology
- By Buyer Group
- Japan
- Pricing Analysis
- Market Share Analysis, 2025
- By Package Type
- By Vehicle Type
- By Sales Channel
- By Installation Mode
- By Technology
- By Buyer Group
- South Korea
- Pricing Analysis
- Market Share Analysis, 2025
- By Package Type
- By Vehicle Type
- By Sales Channel
- By Installation Mode
- By Technology
- By Buyer Group
- Russia
- Pricing Analysis
- Market Share Analysis, 2025
- By Package Type
- By Vehicle Type
- By Sales Channel
- By Installation Mode
- By Technology
- By Buyer Group
- Poland
- Pricing Analysis
- Market Share Analysis, 2025
- By Package Type
- By Vehicle Type
- By Sales Channel
- By Installation Mode
- By Technology
- By Buyer Group
- Hungary
- Pricing Analysis
- Market Share Analysis, 2025
- By Package Type
- By Vehicle Type
- By Sales Channel
- By Installation Mode
- By Technology
- By Buyer Group
- Kingdom of Saudi Arabia
- Pricing Analysis
- Market Share Analysis, 2025
- By Package Type
- By Vehicle Type
- By Sales Channel
- By Installation Mode
- By Technology
- By Buyer Group
- Türkiye
- Pricing Analysis
- Market Share Analysis, 2025
- By Package Type
- By Vehicle Type
- By Sales Channel
- By Installation Mode
- By Technology
- By Buyer Group
- South Africa
- Pricing Analysis
- Market Share Analysis, 2025
- By Package Type
- By Vehicle Type
- By Sales Channel
- By Installation Mode
- By Technology
- By Buyer Group
- USA
- Market Structure Analysis
- Competition Dashboard
- Competition Benchmarking
- Market Share Analysis of Top Players
- By Regional
- By Package Type
- By Vehicle Type
- By Sales Channel
- By Installation Mode
- By Technology
- By Buyer Group
- Emerging Startups
- Innovation Benchmarking
- Competition Analysis
- Competition Deep Dive
- ams OSRAM
- Overview
- Product Portfolio
- Profitability by Market Segments (Product/Region/Sales Channel)
- Sales Footprint
- Strategy Overview
- Marketing Strategy
- Product Strategy
- Channel Strategy
- Lumileds
- HELLA
- Valeo
- Diode Dynamics
- Morimoto
- Oracle Lighting
- ams OSRAM
- Case Studies
- Success Stories
- Recent Developments
- Competition Deep Dive
- Assumptions & Acronyms Used


