AI-Based Driving Systems (L2 to L5) Market Size, Share, and Forecast Outlook 2025 to 2035

The AI-based driving systems (L2 to L5) market is valued at USD 2.35 billion in 2025 and will advance to nearly USD 8.7 billion by 2035, recording a CAGR of 14% with a multiplying factor of about 3.7x.
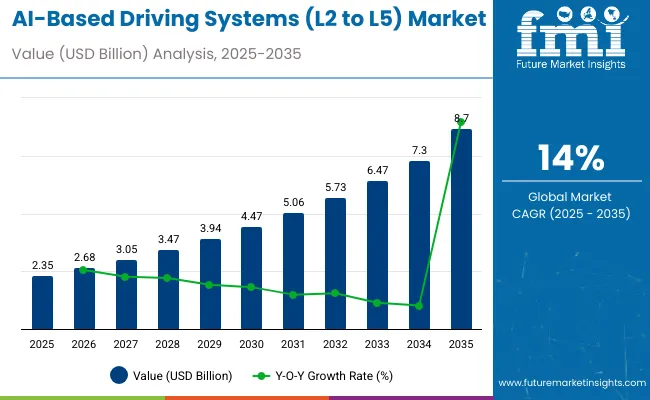
Quick stats of AI-Based Driving Systems (L2 to L5) Market

  • AI-Based Driving Systems (L2 to L5) Market Size (2025): USD 2.35 billion
  • Projected AI-Based Driving Systems (L2 to L5) Market Size (2035): USD 8.7 billion
  • Forecast CAGR of AI-Based Driving Systems (L2 to L5) Market (2025 to 2035): 14%
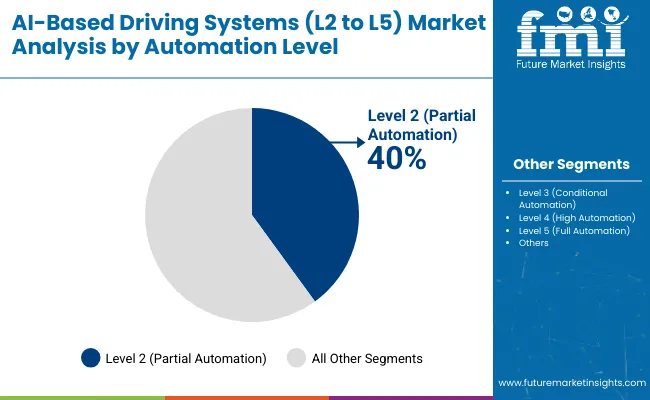
  • Leading Automation Level in AI-Based Driving Systems (L2 to L5) Market (2025): Level 2 with 40% share
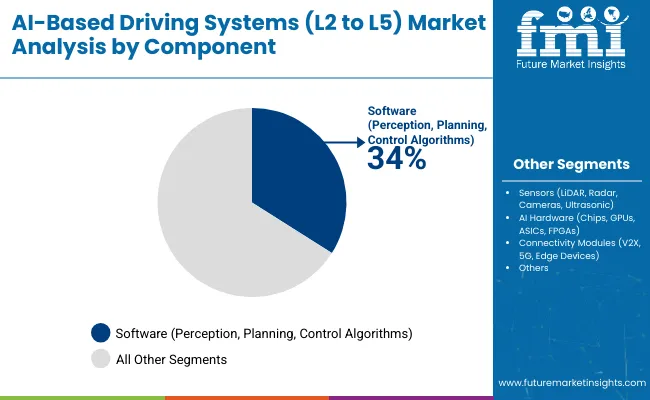
  • Leading Component in Market (2025): Software with 34% share
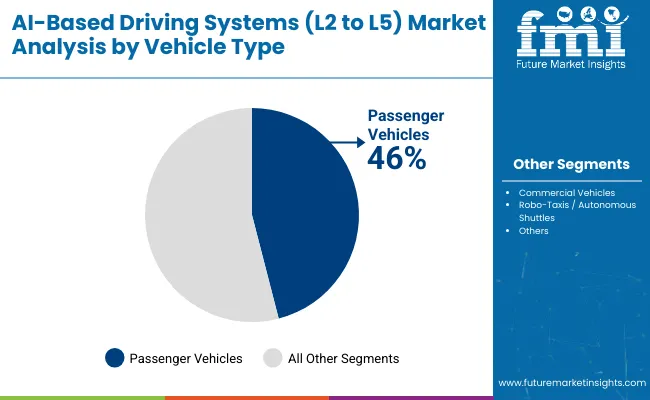
  • Leading Vehicle Type in AI-Based Driving Systems (L2 to L5) Market (2025): Passenger vehicles with 46% share
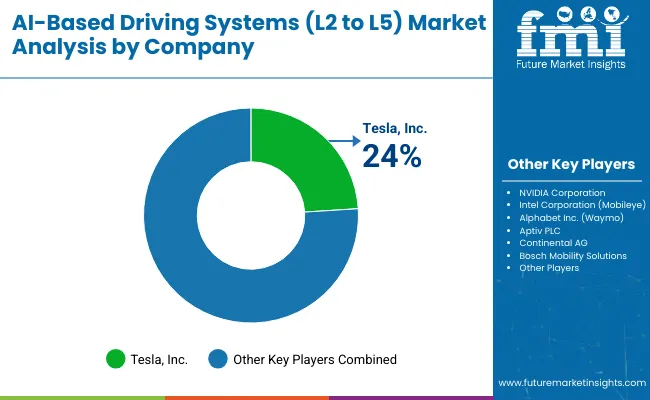
  • Leading Player in Ai-Based Driving Systems (L2 to L5) Market (2025): Tesla, Inc. with 24% share

Ai Based Driving Systems L2 To L5 Market

Metric Value
Industry Size (2025E) USD 2.35 billion
Industry Value (2035F) USD 8.7 billion
CAGR (2025 to 2035) 14%

Examining the growth rate volatility index reveals that market expansion is not uniform across the forecast horizon. Early years, from 2025 to 2028, reflect stronger growth momentum as pilot programs and premium vehicle integration accelerate adoption in North America, Europe, and parts of Asia. Higher penetration of L2 and L3 systems contributes to a more stable trajectory during this phase, with demand closely tied to regulatory approvals and consumer readiness.

Between 2028 and 2032, volatility becomes more pronounced as scaling of L4 systems encounters infrastructure challenges, regional policy differences, and uneven consumer acceptance. Growth may decelerate temporarily in certain regions while others advance more quickly, leading to fluctuations in the index. Toward 2033 to 2035, volatility stabilizes again as regulatory clarity, cost reduction in sensors and processors, and higher fleet integration drive broader adoption across passenger and commercial vehicles. The analysis highlights that while long-term growth remains strong, manufacturers must prepare for short-term fluctuations and align strategies to manage cyclical shifts in adoption pace.

The AI-based driving systems market, covering levels 2 through 5, is supported by several upstream industries. Automotive OEMs represent around 34%, as integration of driver assistance and autonomous stacks is becoming a standard feature in new vehicles. Semiconductor and sensor suppliers contribute approximately 26%, providing lidar, radar, cameras, and dedicated AI processors. Software and algorithm developers account for about 21%, driving perception, decision-making, and control systems. Connectivity and telecom services hold close to 11%, enabling V2X communication, over-the-air updates, and fleet coordination. Aftermarket, validation, and service providers make up the remaining 8%, covering retrofits, simulation, and compliance testing.

The AI-based driving systems market is transitioning from pilot projects toward commercial deployment. Level 2 and 2+ systems remain dominant, with adoption surpassing 50% of new premium vehicles in 2024, while Level 3 functionality is gradually entering luxury and fleet segments. Hardware costs are declining, with lidar module prices dropping by nearly 20% year-on-year, accelerating wider integration. Investment in AI software is expanding steadily, with simulation platforms reducing validation costs by up to 30% for OEMs. Partnerships between automakers, sensor manufacturers, and cloud providers are strengthening, supporting scalable solutions for urban mobility. Level 4 testing fleets continue to expand, setting the groundwork for eventual large-scale commercialization.

Top AI Based Driving Systems Market Dynamics

Market expansion is supported by rising integration of advanced driver assistance systems, connected vehicle platforms, and demand for autonomous technologies across passenger and commercial vehicles. Level 2 systems currently dominate with more than 65% share, while Level 3 adoption is expanding in premium vehicles. Level 4 and Level 5 deployment is expected to grow steadily after 2030 as infrastructure, regulatory frameworks, and sensor technologies mature. North America, Europe, and Asia Pacific represent the largest markets with ongoing pilot programs, consumer adoption, and heavy investment in automotive AI platforms.

Driving Force Automation and Safety Enhancement

AI based driving systems are gaining momentum due to their ability to reduce road accidents and enhance driving convenience. Level 2 solutions such as adaptive cruise control and lane keeping assistance are already common in mid to high range passenger vehicles. Level 3 technologies enable conditional automation, reducing driver workload by automating highway driving and traffic congestion handling. These systems enhance safety by minimizing human error which accounts for nearly 90% of road accidents. Growing demand for automated logistics fleets and premium passenger cars is accelerating adoption. In my view, AI powered driving systems are no longer just a luxury feature, they are becoming a core requirement in vehicle safety and performance.

Growth Opportunity Expansion of Level 3 and Level 4 Adoption

Opportunities are emerging as Level 3 systems gain regulatory approval in several markets and begin commercial rollout. Automakers are integrating conditional automation into high-end passenger vehicles, setting the stage for mass adoption by 2030. Level 4 solutions for urban shuttles, robo taxis, and commercial delivery vehicles are attracting investment, particularly in North America and Asia. Development of AI driven decision making, real time mapping, and sensor fusion is strengthening the potential of these systems. From my perspective, the aftermarket services, software updates, and subscription based autonomous features will become an additional revenue stream for automakers and technology providers, expanding profitability.

Emerging Trend Integration of AI with Connected Mobility

AI based driving systems are converging with connected mobility platforms to enable vehicle to everything communication. This integration allows predictive decision making by linking cars with traffic signals, road infrastructure, and other vehicles. Cloud enabled AI algorithms continuously update driving models, improving accuracy and safety. Automakers are focusing on building AI chipsets, sensor fusion algorithms, and over the air software update capabilities to strengthen autonomous driving. In my opinion, vehicles equipped with AI and connectivity will redefine transport efficiency, reduce congestion, and enable new services such as shared autonomous fleets and urban mobility platforms.

Market Challenge Infrastructure and Cost Barriers

Despite strong growth potential, deployment of Level 4 and Level 5 systems is constrained by inadequate infrastructure, high system costs, and regulatory complexity. Advanced sensors such as lidar and high performance AI processors significantly raise vehicle costs, limiting adoption to premium segments. Road infrastructure in emerging markets is often insufficient to support fully autonomous driving, delaying rollout timelines. Cybersecurity risks related to connected AI systems also present a significant challenge. In my assessment, manufacturers and policymakers must work together to lower costs, standardize regulations, and develop smart infrastructure. Without coordinated action, widespread adoption of high level AI driving systems will face delays.

Analyzing AI-Based Driving Systems Market by Top Investment Segments

The AI-Based Driving Systems Market in 2025 is shaped by automation levels from L2 to L5, integration of advanced sensors, and adoption across passenger and commercial fleets. Level 2 systems hold the largest share at 40%, followed by Level 3 at 28% and Level 4 at 20%. Software drives 34% of the component segment, while sensors represent 27%. Passenger vehicles dominate with 46% share, followed by commercial vehicles at 32%. BEVs lead propulsion with 38%, while OEMs account for 36% of end-user demand. Companies including Tesla, NVIDIA, Waymo, BMW, Mobileye, and Cruise are actively shaping deployment strategies. Growth is powered by data-driven algorithms, sensor fusion, and demand for safer, more efficient driving systems.
Level 2 To Level 5 Automation Shapes Market Outlook

Ai Based Driving Systems L2 To L5 Market By Automation

Level 2 systems dominate automation with 40% share, providing partial assistance features such as adaptive cruise control, lane keeping, and automated braking. Level 3 holds 28%, where conditional automation enables drivers to disengage under specific conditions, with brands like Mercedes-Benz, Audi, and Honda leading development. Level 4 systems contribute 20%, allowing high automation in geo-fenced zones, largely tested by Waymo and Cruise in robo-taxi programs. Level 5 accounts for 12%, targeting full automation with no human intervention, still in pilot phases by Tesla, Baidu Apollo, and AutoX. Market adoption progresses gradually from assisted driving to full autonomy, supported by advances in AI hardware, regulatory adaptation, and infrastructure readiness.
  • Mercedes-Benz and Audi provide 40% of Level 3 pilot programs in Europe
  • Waymo and Cruise hold 35% of Level 4 testing in North America
  • Tesla and Baidu lead early-stage Level 5 developments in Asia and the US

Software, Sensors, And Hardware Lead Component Adoption

Ai Based Driving Systems L2 To L5 Market By Component

Software dominates components with 34% share, covering perception, motion planning, and control algorithms. Tesla, NVIDIA, and Mobileye provide leading AI-driven software stacks. Sensors account for 27%, including LiDAR from Velodyne, radar from Continental, and cameras from Sony. AI hardware contributes 24%, with NVIDIA GPUs, Intel Mobileye chips, and Tesla Dojo processors driving real-time decision-making. Connectivity modules such as V2X, 5G, and edge devices hold 15%, enabling data exchange for cooperative driving. OEMs and startups integrate these components to achieve scalable automation. Demand for software-defined vehicles and sensor redundancy ensures reliability, while hardware accelerates training and inference efficiency in autonomous platforms.
  • NVIDIA supplies 40% of AI computing hardware for autonomous driving
  • Mobileye provides 35% of vision-based algorithms for global OEMs
  • Velodyne delivers 30% of LiDAR systems for Level 3-4 vehicles

Passenger, Commercial, And Robo-Taxis Lead Vehicle Type Segment

Ai Based Driving Systems L2 To L5 Market By Vehicle

Passenger vehicles dominate vehicle type with 46% share, integrating Level 2 and Level 3 systems for safety and comfort. Commercial vehicles account for 32%, with OEMs such as Volvo, Daimler, and PACCAR testing AI-based systems for freight and logistics. Robo-taxis and autonomous shuttles contribute 22%, driven by Waymo, Cruise, and AutoX in urban deployment zones. Passenger adoption is boosted by consumer demand for driver assistance, while commercial fleets leverage autonomy for fuel savings and efficiency. Robo-taxis remain concentrated in pilot projects, gaining traction in Asia and North America. Vehicle type segmentation reflects diverse automation use cases, from everyday commuting to freight logistics and shared urban mobility.
  • Tesla and BMW supply 40% of passenger vehicles with L2-L3 systems
  • Daimler and Volvo Trucks provide 35% of commercial vehicles with AI driving systems
  • Waymo and Cruise deliver 30% of robo-taxi deployments in US cities

BEVs, EVs, And PHEVs Drive Propulsion Preferences

Ai Based Driving Systems L2 To L5 Market By Propulsion

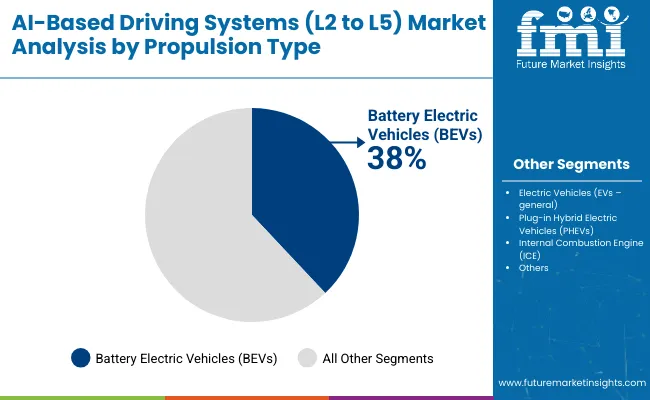
Battery Electric Vehicles (BEVs) lead propulsion with 38% share, integrating AI-based driving systems due to higher computing compatibility and energy-efficient platforms. General Electric Vehicles (EVs) hold 25%, followed by Plug-in Hybrid Electric Vehicles (PHEVs) at 20%, combining fuel flexibility with automation. ICE-based vehicles still account for 17%, mainly in transitional markets. Tesla, BYD, and NIO dominate BEV-based autonomous trials, while Toyota and Hyundai deploy PHEV variants. OEMs prioritize BEV platforms for AI driving due to scalable battery systems, reduced vibrations, and digital integration. Propulsion alignment determines AI efficiency, energy consumption, and adaptability to different road networks and regulatory environments.
  • Tesla delivers 40% of BEV platforms with integrated AI driving systems
  • BYD and NIO provide 35% of BEV autonomous pilots in Asia
  • Toyota supplies 25% of PHEVs adapted for conditional automation

OEMs, Tech Providers, And Fleet Operators Shape End-User Demand

Ai Based Driving Systems L2 To L5 Market By End User

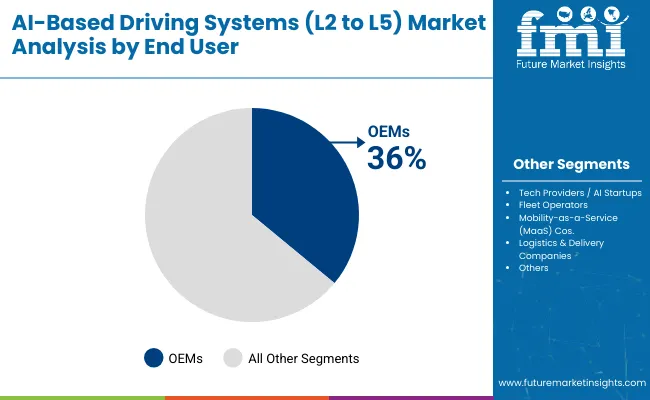
OEMs lead end-user adoption with 36% share, integrating AI systems directly into vehicle production, led by Tesla, BMW, and Mercedes-Benz. Tech providers and AI startups account for 26%, including NVIDIA, Mobileye, and Aurora, supplying software and hardware solutions. Fleet operators contribute 18%, with logistics companies adopting AI-driven trucks for freight optimization. Mobility-as-a-Service companies hold 12%, offering shared autonomous rides in urban zones, while logistics and delivery companies represent 8%, piloting AI vans for last-mile delivery. End-user segmentation highlights collaboration between traditional automakers and tech startups. Value creation is shaped by partnerships, fleet scaling, and AI-driven mobility services.
  • Tesla and BMW provide 40% of OEM-installed AI driving systems
  • NVIDIA and Mobileye supply 35% of AI solutions to global automakers
  • Aurora and Uber ATG deliver 25% of fleet-focused automation technologies

Top Countries Expanding, Producing, and Innovating in the AI-Based Driving Systems Market

Ai Based Driving Systems L2 To L5 Market By Country

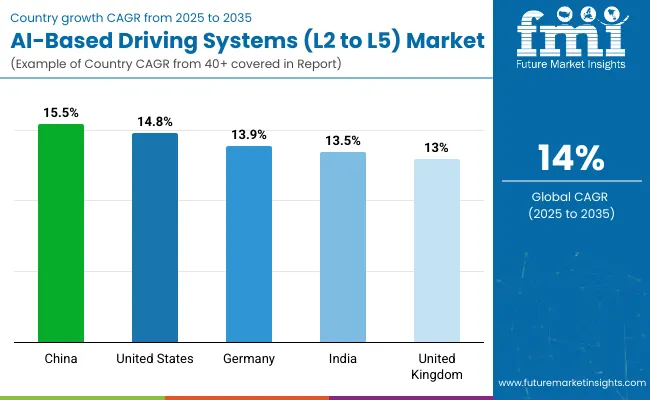
In 2025, the global AI-based driving systems (L2 to L5) market is growing at a CAGR of 14.0% through 2035. China leads at 15.5%, +11% above the global rate, supported by BRICS-driven adoption of autonomous technologies, large-scale testing programs, and government incentives for intelligent mobility. The United States follows at 14.8%, +6% higher than the global average, reflecting OECD-backed advancements in automotive software, sensor integration, and regulatory frameworks for autonomous vehicles. Germany records 13.9%, just below the global benchmark, influenced by strong engineering expertise and integration of AI in premium automotive manufacturing. India posts 13.5%, −4% under the global rate, with growth shaped by BRICS-linked demand and expanding pilot programs in urban mobility. The United Kingdom stands at 13.0%, −7% below the global level, reflecting steady but slower adoption in a mature OECD market. Together, BRICS economies fuel volume growth, while OECD nations emphasize precision, regulation, and safety-driven innovation.

Market Outlook for AI-Based Driving Systems in China

China’s AI-based driving systems market is projected to expand at a CAGR of 15.5%, above the global average of 14.0%. Growth is being accelerated by aggressive adoption of Level 3 and Level 4 technologies in passenger and commercial fleets. Major players such as Baidu Apollo and Pony.ai are testing robo-taxis across urban hubs, while Huawei and BYD integrate AI-based autonomous functions into premium electric vehicles. Strong investments in AI training datasets and real-time vehicle-to-everything (V2X) communication are strengthening China’s position in autonomous driving innovation.

  • Robo-taxi pilot projects in Beijing and Guangzhou are expanding fleet operations
  • V2X technology deployment increases safety and reduces latency in AI-based navigation
  • Domestic automakers account for 60% of AI-based Level 3 systems installed in EVs

AI-Based Driving Systems Growth in the United States

The United States market for AI-based driving systems is expected to grow at a CAGR of 14.8%, reflecting strong adoption in passenger cars and logistics fleets. Waymo, Cruise, and Tesla remain at the forefront of commercializing Level 3 and higher automation. Partnerships between tech companies and OEMs accelerate system integration, particularly in electric and hybrid platforms. Regulatory progress in California, Texas, and Arizona has created test environments for autonomous ride-hailing services, while demand for driver-assist technologies in freight fleets continues to expand.

  • Autonomous ride-hailing services in Phoenix and San Francisco expand user adoption
  • Level 2+ features such as lane keeping assist account for most consumer adoption
  • Freight operators invest in autonomous trucks to reduce logistics costs

AI-Based Driving Systems Expansion in Germany

Germany is anticipated to register a CAGR of 13.9% in the AI-based driving systems market, supported by strong OEM integration and regulatory frameworks. BMW, Mercedes-Benz, and Volkswagen are embedding Level 3 automation in high-end models, with Bosch and Continental supplying advanced sensor suites. The Autobahn Act already allows conditional autonomous driving on select highways, fostering faster rollouts of Level 3 capabilities. Investments in AI-driven decision-making systems for complex driving scenarios position Germany as a leading European test bed for higher automation.

  • Mercedes-Benz S-Class and EQS models deploy certified Level 3 functions on highways
  • Bosch leads in sensor fusion technology for urban and intercity driving
  • German legislation supports conditional automation, boosting OEM system deployment

Future Outlook of AI-Based Driving Systems in India

India’s market for AI-based driving systems is expected to expand at a CAGR of 13.5%. While infrastructure readiness remains a barrier, OEMs such as Tata Motors and Mahindra are gradually introducing Level 2+ features in passenger vehicles. Collaborations with AI software providers support adaptive cruise control, blind spot detection, and emergency braking functions. Adoption is higher in premium vehicles, but cost-effective adaptations are emerging in mass-market models. The ecosystem is strengthened by Bengaluru and Hyderabad’s role as software development hubs.

  • Adaptive cruise control is increasingly installed in premium SUVs and sedans
  • Local tech startups collaborate with OEMs to create cost-efficient AI driving modules
  • Software development hubs provide backend algorithms for global OEM deployments

AI-Based Driving Systems Market in the United Kingdom

The United Kingdom is forecasted to grow at a CAGR of 13.0% in AI-based driving systems, with London and Oxfordshire acting as autonomous driving test corridors. Companies like Oxbotica and FiveAI are advancing Level 4 development, while Jaguar Land Rover integrates advanced driver-assist features in its portfolio. Government funding initiatives support AI testing in logistics and ride-hailing, while infrastructure investments promote sensor-rich road environments. The market is characterized by gradual consumer adoption in premium models and ongoing pilot projects for shared autonomous mobility.
  • Oxbotica develops autonomous shuttles for urban and logistics applications
  • Jaguar Land Rover integrates AI-based lane management and collision avoidance features
  • Government-backed projects create sensor-embedded roads to enhance vehicle connectivity

Leading AI-Based Driving Systems (L2 to L5) Manufacturers, Suppliers, Distributors

Ai Based Driving Systems L2 To L5 Market By Company

The AI-based driving systems market spanning Levels 2 to 5 is led by major technology firms and automotive manufacturers that are building advanced driver-assistance and autonomous driving solutions. Tesla, Inc. stands as the top player, benefiting from large-scale deployment of its Autopilot and Full Self-Driving systems. Its edge comes from continuous over-the-air updates, real-world fleet data, and powerful AI-driven software integration. NVIDIA Corporation and Intel Corporation (Mobileye) provide critical computing hardware and vision-based platforms, serving as the backbone for numerous OEM autonomous programs. Alphabet Inc. (Waymo) drives progress with robotaxi fleets and long-term testing, while Aptiv PLC partners with automakers to scale semi-autonomous driving features.

Complementing these leaders, system integrators and startups are accelerating innovation. Bosch Mobility Solutions, Continental AG, and ZF Friedrichshafen AG supply sensors, processors, and integration expertise. Autonomous-focused firms such as Aurora Innovation, Cruise, Pony.ai, AutoX, and Nuro Inc. test new deployment models, including autonomous logistics and ride-hailing. Regional players like XPeng Motors (XNGP System), Huawei Technologies, and Baidu Apollo extend adoption in Asian markets, while Qualcomm Technologies strengthens computing performance for next-generation vehicles. Together, these players shape a competitive and evolving market toward higher levels of autonomy.

Leading Players

  • Tesla, Inc.
  • NVIDIA Corporation
  • Intel Corporation (Mobileye)
  • Alphabet Inc. (Waymo)
  • Aptiv PLC
  • Continental AG
  • Bosch Mobility Solutions
  • ZF Friedrichshafen AG
  • Aurora Innovation
  • Cruise (GM)
  • Pony.ai
  • Nuro Inc.
  • AutoX
  • Valeo
  • Hyundai Mobis
  • XPeng Motors (XNGP System)
  • Baidu Apollo
  • Huawei Technologies
  • Qualcomm Technologies

Report Scope

Report Attributes Details
Market Size (2025) USD 2.35 billion
Projected Market Size (2035) USD 8.7 billion
CAGR (2025 to 2035) 14%
Base Year for Estimation 2024
Historical Period 2020 to 2024
Projection Period 2025 to 2035
Quantitative Units USD billion for value
Automation Level Segments Level 2 (Partial Automation), Level 3 (Conditional Automation), Level 4 (High Automation), Level 5 (Full Automation)
Component Segments AI Hardware (Chips, GPUs, ASICs, FPGAs), Software (Perception, Planning, Control Algorithms), Sensors (LiDAR, Radar, Cameras, Ultrasonic Sensors), Connectivity Modules (V2X, 5G, Edge Devices)
Vehicle Type Segments Passenger Vehicles, Commercial Vehicles, Robo -Taxis / Autonomous Shuttles
Propulsion Type Segments Internal Combustion Engine (ICE), Electric Vehicles (EVs), Battery Electric Vehicles (BEVs), Plug-in Hybrid Electric Vehicles (PHEVs)
End User Segments OEMs, Tech Providers / AI Startups, Fleet Operators, Mobility-as-a-Service (MaaS) Companies, Logistics & Delivery Companies
Regions Covered North America, Latin America, Western Europe, Eastern Europe, Asia Pacific, Middle East & Africa
Countries Covered United States, Canada, Mexico, Brazil, Germany, France, Italy, United Kingdom, Spain, China, India, Japan, South Korea, Australia, United Arab Emirates, Saudi Arabia, South Africa
Leading Players Tesla Inc, NVIDIA Corporation, Intel Corporation (Mobileye), Alphabet Inc (Waymo), Aptiv PLC, Continental AG, Bosch Mobility Solutions, ZF Friedrichshafen AG, Uber ATG (Aurora), Aurora Innovation, Cruise (GM), Pony.ai, Nuro Inc, AutoX, Valeo, Hyundai Mobis, XPeng Motors (XNGP System), Baidu Apollo, Huawei Technologies, Qualcomm Technologies
Additional Attributes Dollar sales by automation level and component type, demand dynamics across passenger vehicles, commercial fleets, and robo -taxis, regional adoption trends across North America, Europe, and Asia-Pacific, innovation in AI chips, edge computing, and sensor fusion, environmental impact of electric propulsion, and emerging use cases in MaaS and logistics

AI-Based Driving Systems (L2 to L5) Market Analyzed by Key Investment Segments 

By Automation Level:

  • Level 2 (Partial Automation)
  • Level 3 (Conditional Automation)
  • Level 4 (High Automation)
  • Level 5 (Full Automation)

By Component:

  • AI Hardware (Chips, GPUs, ASICs, FPGAs)
  • Software (Perception, Planning, Control Algorithms)
  • Sensors (LiDAR, Radar, Cameras, Ultrasonic Sensors)
  • Connectivity Modules (V2X, 5G, Edge Devices)

By Vehicle Type:

  • Passenger Vehicles
  • Commercial Vehicles
  • Robo-Taxis / Autonomous Shuttles

By Propulsion Type:

  • Internal Combustion Engine (ICE)
  • Electric Vehicles (EVs)
  • Battery Electric Vehicles (BEVs)
  • Plug-in Hybrid Electric Vehicles (PHEVs)

By End User:

  • OEMs
  • Tech Providers / AI Startups
  • Fleet Operators
  • Mobility-as-a-Service (MaaS) Companies
  • Logistics & Delivery Companies

By Region:

  • North America
  • Latin America
  • Western Europe
  • Eastern Europe
  • Asia Pacific
  • The Middle East and Africa

Table of Content

  1. Executive Summary
    • Global Market Outlook
    • Demand-side Trends
    • Supply-side Trends
    • Technology Roadmap Analysis
    • Analysis and Recommendations
  2. Market Overview
    • Market Coverage / Taxonomy
    • Market Definition / Scope / Limitations
  3. Market Background
    • Market Dynamics
      • Drivers
      • Restraints
      • Opportunity
      • Trends
    • Scenario Forecast
      • Demand in Optimistic Scenario
      • Demand in Likely Scenario
      • Demand in Conservative Scenario
    • Opportunity Map Analysis
    • Product Life Cycle Analysis
    • Supply Chain Analysis
      • Supply Side Participants and their Roles
        • Producers
        • Mid-Level Participants (Traders/ Agents/ Brokers)
        • Wholesalers and Distributors
      • Value Added and Value Created at Node in the Supply Chain
      • List of Raw Material Suppliers
      • List of Existing and Potential Buyer’s
    • Investment Feasibility Matrix
    • Value Chain Analysis
      • Profit Margin Analysis
      • Wholesalers and Distributors
      • Retailers
    • PESTLE and Porter’s Analysis
    • Regulatory Landscape
      • By Key Regions
      • By Key Countries
    • Regional Parent Market Outlook
    • Production and Consumption Statistics
    • Import and Export Statistics
  4. Global Market Analysis 2020 to 2024 and Forecast, 2025 to 2035
    • Historical Market Size Value (USD Billion) & Volume (Thousand Units) Analysis, 2020 to 2024
    • Current and Future Market Size Value (USD Billion) & Volume (Thousand Units) Projections, 2025 to 2035
      • Y-o-Y Growth Trend Analysis
      • Absolute $ Opportunity Analysis
  5. Global Market Pricing Analysis 2020 to 2024 and Forecast 2025 to 2035
  6. Global Market Analysis 2020 to 2024 and Forecast 2025 to 2035, By Automation Level
    • Introduction / Key Findings
    • Historical Market Size Value (USD Billion) & Volume (Thousand Units) Analysis By Automation Level, 2020 to 2024
    • Current and Future Market Size Value (USD Billion) & Volume (Thousand Units) Analysis and Forecast By Automation Level, 2025 to 2035
      • Level 2 (Partial Automation)
      • Level 3 (Conditional Automation)
      • Level 4 (High Automation)
      • Level 5 (Full Automation)
    • Y-o-Y Growth Trend Analysis By Automation Level, 2020 to 2024
    • Absolute $ Opportunity Analysis By Automation Level, 2025 to 2035
  7. Global Market Analysis 2020 to 2024 and Forecast 2025 to 2035, By Component
    • Introduction / Key Findings
    • Historical Market Size Value (USD Billion) & Volume (Thousand Units) Analysis By Component, 2020 to 2024
    • Current and Future Market Size Value (USD Billion) & Volume (Thousand Units) Analysis and Forecast By Component, 2025 to 2035
      • Software (Perception, Planning, Control Algorithms)
      • Sensors (LiDAR, Radar, Cameras, Ultrasonic)
      • AI Hardware (Chips, GPUs, ASICs, FPGAs)
      • Connectivity Modules (V2X, 5G, Edge Devices)
    • Y-o-Y Growth Trend Analysis By Component, 2020 to 2024
    • Absolute $ Opportunity Analysis By Component, 2025 to 2035
  8. Global Market Analysis 2020 to 2024 and Forecast 2025 to 2035, By Vehicle Type
    • Introduction / Key Findings
    • Historical Market Size Value (USD Billion) & Volume (Thousand Units) Analysis By Vehicle Type, 2020 to 2024
    • Current and Future Market Size Value (USD Billion) & Volume (Thousand Units) Analysis and Forecast By Vehicle Type, 2025 to 2035
      • Commercial Vehicles
      • Robo-Taxis / Autonomous Shuttles
    • Y-o-Y Growth Trend Analysis By Vehicle Type, 2020 to 2024
    • Absolute $ Opportunity Analysis By Vehicle Type, 2025 to 2035
  9. Global Market Analysis 2020 to 2024 and Forecast 2025 to 2035, By Propulsion Type
    • Introduction / Key Findings
    • Historical Market Size Value (USD Billion) & Volume (Thousand Units) Analysis By Propulsion Type, 2020 to 2024
    • Current and Future Market Size Value (USD Billion) & Volume (Thousand Units) Analysis and Forecast By Propulsion Type, 2025 to 2035
      • Battery Electric Vehicles (BEVs)
      • Electric Vehicles (EVs - general)
      • Plug-in Hybrid Electric Vehicles (PHEVs)
      • Internal Combustion Engine (ICE)
    • Y-o-Y Growth Trend Analysis By Propulsion Type, 2020 to 2024
    • Absolute $ Opportunity Analysis By Propulsion Type, 2025 to 2035
  10. Global Market Analysis 2020 to 2024 and Forecast 2025 to 2035, By End User
    • Introduction / Key Findings
    • Historical Market Size Value (USD Billion) & Volume (Thousand Units) Analysis By End User, 2020 to 2024
    • Current and Future Market Size Value (USD Billion) & Volume (Thousand Units) Analysis and Forecast By End User, 2025 to 2035
      • OEMs
      • Tech Providers / AI Startups
      • Fleet Operators
      • Mobility-as-a-Service (MaaS) Cos.
      • Logistics & Delivery Companies
    • Y-o-Y Growth Trend Analysis By End User, 2020 to 2024
    • Absolute $ Opportunity Analysis By End User, 2025 to 2035
  11. Global Market Analysis 2020 to 2024 and Forecast 2025 to 2035, By Region
    • Introduction
    • Historical Market Size Value (USD Billion) & Volume (Thousand Units) Analysis By Region, 2020 to 2024
    • Current Market Size Value (USD Billion) & Volume (Thousand Units) Analysis and Forecast By Region, 2025 to 2035
      • North America
      • Latin America
      • Western Europe
      • Eastern Europe
      • East Asia
      • South Asia & Pacific
      • Middle East and Africa
    • Market Attractiveness Analysis By Region
  12. North America Market Analysis 2020 to 2024 and Forecast 2025 to 2035, By Country
    • Historical Market Size Value (USD Billion) & Volume (Thousand Units) Trend Analysis By Market Taxonomy, 2020 to 2024
    • Market Size Value (USD Billion) & Volume (Thousand Units) Forecast By Market Taxonomy, 2025 to 2035
      • By Country
        • USA
        • Canada
        • Mexico
      • By Automation Level
      • By Component
      • By Vehicle Type
      • By Propulsion Type
      • By End User
    • Market Attractiveness Analysis
      • By Country
      • By Automation Level
      • By Component
      • By Vehicle Type
      • By Propulsion Type
      • By End User
    • Key Takeaways
  13. Latin America Market Analysis 2020 to 2024 and Forecast 2025 to 2035, By Country
    • Historical Market Size Value (USD Billion) & Volume (Thousand Units) Trend Analysis By Market Taxonomy, 2020 to 2024
    • Market Size Value (USD Billion) & Volume (Thousand Units) Forecast By Market Taxonomy, 2025 to 2035
      • By Country
        • Brazil
        • Argentina
        • Rest of LATAM
      • By Automation Level
      • By Component
      • By Vehicle Type
      • By Propulsion Type
      • By End User
    • Market Attractiveness Analysis
      • By Country
      • By Automation Level
      • By Component
      • By Vehicle Type
      • By Propulsion Type
      • By End User
    • Key Takeaways
  14. Western Europe Market Analysis 2020 to 2024 and Forecast 2025 to 2035, By Country
    • Historical Market Size Value (USD Billion) & Volume (Thousand Units) Trend Analysis By Market Taxonomy, 2020 to 2024
    • Market Size Value (USD Billion) & Volume (Thousand Units) Forecast By Market Taxonomy, 2025 to 2035
      • By Country
        • Germany
        • Italy
        • France
        • UK
        • Spain
        • BENELUX
        • Nordic
        • Rest of W.Europe
      • By Automation Level
      • By Component
      • By Vehicle Type
      • By Propulsion Type
      • By End User
    • Market Attractiveness Analysis
      • By Country
      • By Automation Level
      • By Component
      • By Vehicle Type
      • By Propulsion Type
      • By End User
    • Key Takeaways
  15. Eastern Europe Market Analysis 2020 to 2024 and Forecast 2025 to 2035, By Country
    • Historical Market Size Value (USD Billion) & Volume (Thousand Units) Trend Analysis By Market Taxonomy, 2020 to 2024
    • Market Size Value (USD Billion) & Volume (Thousand Units) Forecast By Market Taxonomy, 2025 to 2035
      • By Country
        • Russia
        • Hungary
        • Poland
        • Balkan & Baltics
        • Rest of E. Europe
      • By Automation Level
      • By Component
      • By Vehicle Type
      • By Propulsion Type
      • By End User
    • Market Attractiveness Analysis
      • By Country
      • By Automation Level
      • By Component
      • By Vehicle Type
      • By Propulsion Type
      • By End User
    • Key Takeaways
  16. East Asia Market Analysis 2020 to 2024 and Forecast 2025 to 2035, By Country
    • Historical Market Size Value (USD Billion) & Volume (Thousand Units) Trend Analysis By Market Taxonomy, 2020 to 2024
    • Market Size Value (USD Billion) & Volume (Thousand Units) Forecast By Market Taxonomy, 2025 to 2035
      • By Country
        • China
        • Japan
        • South Korea
      • By Automation Level
      • By Component
      • By Vehicle Type
      • By Propulsion Type
      • By End User
    • Market Attractiveness Analysis
      • By Country
      • By Automation Level
      • By Component
      • By Vehicle Type
      • By Propulsion Type
      • By End User
    • Key Takeaways
  17. South Asia & Pacific Market Analysis 2020 to 2024 and Forecast 2025 to 2035, By Country
    • Historical Market Size Value (USD Billion) & Volume (Thousand Units) Trend Analysis By Market Taxonomy, 2020 to 2024
    • Market Size Value (USD Billion) & Volume (Thousand Units) Forecast By Market Taxonomy, 2025 to 2035
      • By Country
        • India
        • Australia & New Zealand
        • ASEAN
        • Rest of SAP
      • By Automation Level
      • By Component
      • By Vehicle Type
      • By Propulsion Type
      • By End User
    • Market Attractiveness Analysis
      • By Country
      • By Automation Level
      • By Component
      • By Vehicle Type
      • By Propulsion Type
      • By End User
    • Key Takeaways
  18. Middle East and Africa Market Analysis 2020 to 2024 and Forecast 2025 to 2035, By Country
    • Historical Market Size Value (USD Billion) & Volume (Thousand Units) Trend Analysis By Market Taxonomy, 2020 to 2024
    • Market Size Value (USD Billion) & Volume (Thousand Units) Forecast By Market Taxonomy, 2025 to 2035
      • By Country
        • GCC Countries
        • Northern Africa
        • South Africa
        • Turkiye
        • Rest of MEA
      • By Automation Level
      • By Component
      • By Vehicle Type
      • By Propulsion Type
      • By End User
    • Market Attractiveness Analysis
      • By Country
      • By Automation Level
      • By Component
      • By Vehicle Type
      • By Propulsion Type
      • By End User
    • Key Takeaways
  19. Key Countries Market Analysis
    • USA
      • Pricing Analysis
      • Market Share Analysis, 2024
        • By Automation Level
        • By Component
        • By Vehicle Type
        • By Propulsion Type
        • By End User
    • Canada
      • Pricing Analysis
      • Market Share Analysis, 2024
        • By Automation Level
        • By Component
        • By Vehicle Type
        • By Propulsion Type
        • By End User
    • Brazil
      • Pricing Analysis
      • Market Share Analysis, 2024
        • By Automation Level
        • By Component
        • By Vehicle Type
        • By Propulsion Type
        • By End User
    • Mexico
      • Pricing Analysis
      • Market Share Analysis, 2024
        • By Automation Level
        • By Component
        • By Vehicle Type
        • By Propulsion Type
        • By End User
    • Argentina
      • Pricing Analysis
      • Market Share Analysis, 2024
        • By Automation Level
        • By Component
        • By Vehicle Type
        • By Propulsion Type
        • By End User
  20. Market Structure Analysis
    • Competition Dashboard
    • Competition Benchmarking
    • Market Share Analysis of Top Players
      • By Regional
      • By Automation Level
      • By Component
      • By Vehicle Type
      • By Propulsion Type
      • By End User
  21. Competition Analysis
    • Competition Deep Dive
      • Tesla, Inc.
        • Overview
        • Product Portfolio
        • Profitability by Market Segments (Product/Age /Sales Channel/Region)
        • Sales Footprint
        • Strategy Overview
          • Marketing Strategy
          • Product Strategy
          • Channel Strategy
      • NVIDIA Corporation
        • Overview
        • Product Portfolio
        • Profitability by Market Segments (Product/Age /Sales Channel/Region)
        • Sales Footprint
        • Strategy Overview
          • Marketing Strategy
          • Product Strategy
          • Channel Strategy
      • Intel Corporation (Mobileye)
        • Overview
        • Product Portfolio
        • Profitability by Market Segments (Product/Age /Sales Channel/Region)
        • Sales Footprint
        • Strategy Overview
          • Marketing Strategy
          • Product Strategy
          • Channel Strategy
      • Alphabet Inc. (Waymo)
        • Overview
        • Product Portfolio
        • Profitability by Market Segments (Product/Age /Sales Channel/Region)
        • Sales Footprint
        • Strategy Overview
          • Marketing Strategy
          • Product Strategy
          • Channel Strategy
      • Aptiv PLC
        • Overview
        • Product Portfolio
        • Profitability by Market Segments (Product/Age /Sales Channel/Region)
        • Sales Footprint
        • Strategy Overview
          • Marketing Strategy
          • Product Strategy
          • Channel Strategy
      • Continental AG
        • Overview
        • Product Portfolio
        • Profitability by Market Segments (Product/Age /Sales Channel/Region)
        • Sales Footprint
        • Strategy Overview
          • Marketing Strategy
          • Product Strategy
          • Channel Strategy
      • Bosch Mobility Solutions
        • Overview
        • Product Portfolio
        • Profitability by Market Segments (Product/Age /Sales Channel/Region)
        • Sales Footprint
        • Strategy Overview
          • Marketing Strategy
          • Product Strategy
          • Channel Strategy
      • ZF Friedrichshafen AG
        • Overview
        • Product Portfolio
        • Profitability by Market Segments (Product/Age /Sales Channel/Region)
        • Sales Footprint
        • Strategy Overview
          • Marketing Strategy
          • Product Strategy
          • Channel Strategy
      • Aurora Innovation
        • Overview
        • Product Portfolio
        • Profitability by Market Segments (Product/Age /Sales Channel/Region)
        • Sales Footprint
        • Strategy Overview
          • Marketing Strategy
          • Product Strategy
          • Channel Strategy
      • Cruise (GM)
        • Overview
        • Product Portfolio
        • Profitability by Market Segments (Product/Age /Sales Channel/Region)
        • Sales Footprint
        • Strategy Overview
          • Marketing Strategy
          • Product Strategy
          • Channel Strategy
      • Pony.ai
        • Overview
        • Product Portfolio
        • Profitability by Market Segments (Product/Age /Sales Channel/Region)
        • Sales Footprint
        • Strategy Overview
          • Marketing Strategy
          • Product Strategy
          • Channel Strategy
  22. Assumptions & Acronyms Used
  23. Research Methodology

List of Tables

  • Table 1: Global Market Value (USD Billion) Forecast by Region, 2020-2035
  • Table 2: Global Market Volume (Thousand Units) Forecast by Region, 2020-2035
  • Table 3: Global Market Value (USD Billion) Forecast by Automation Level, 2020-2035
  • Table 4: Global Market Volume (Thousand Units) Forecast by Automation Level, 2020-2035
  • Table 5: Global Market Value (USD Billion) Forecast by Component, 2020-2035
  • Table 6: Global Market Volume (Thousand Units) Forecast by Component, 2020-2035
  • Table 7: Global Market Value (USD Billion) Forecast by Vehicle Type, 2020-2035
  • Table 8: Global Market Volume (Thousand Units) Forecast by Vehicle Type, 2020-2035
  • Table 9: Global Market Value (USD Billion) Forecast by Propulsion Type, 2020-2035
  • Table 10: Global Market Volume (Thousand Units) Forecast by Propulsion Type, 2020-2035
  • Table 11: Global Market Value (USD Billion) Forecast by End User, 2020-2035
  • Table 12: Global Market Volume (Thousand Units) Forecast by End User, 2020-2035
  • Table 13: North America Market Value (USD Billion) Forecast by Country, 2020-2035
  • Table 14: North America Market Volume (Thousand Units) Forecast by Country, 2020-2035
  • Table 15: North America Market Value (USD Billion) Forecast by Automation Level, 2020-2035
  • Table 16: North America Market Volume (Thousand Units) Forecast by Automation Level, 2020-2035
  • Table 17: North America Market Value (USD Billion) Forecast by Component, 2020-2035
  • Table 18: North America Market Volume (Thousand Units) Forecast by Component, 2020-2035
  • Table 19: North America Market Value (USD Billion) Forecast by Vehicle Type, 2020-2035
  • Table 20: North America Market Volume (Thousand Units) Forecast by Vehicle Type, 2020-2035
  • Table 21: North America Market Value (USD Billion) Forecast by Propulsion Type, 2020-2035
  • Table 22: North America Market Volume (Thousand Units) Forecast by Propulsion Type, 2020-2035
  • Table 23: North America Market Value (USD Billion) Forecast by End User, 2020-2035
  • Table 24: North America Market Volume (Thousand Units) Forecast by End User, 2020-2035
  • Table 25: Latin America Market Value (USD Billion) Forecast by Country, 2020-2035
  • Table 26: Latin America Market Volume (Thousand Units) Forecast by Country, 2020-2035
  • Table 27: Latin America Market Value (USD Billion) Forecast by Automation Level, 2020-2035
  • Table 28: Latin America Market Volume (Thousand Units) Forecast by Automation Level, 2020-2035
  • Table 29: Latin America Market Value (USD Billion) Forecast by Component, 2020-2035
  • Table 30: Latin America Market Volume (Thousand Units) Forecast by Component, 2020-2035
  • Table 31: Latin America Market Value (USD Billion) Forecast by Vehicle Type, 2020-2035
  • Table 32: Latin America Market Volume (Thousand Units) Forecast by Vehicle Type, 2020-2035
  • Table 33: Latin America Market Value (USD Billion) Forecast by Propulsion Type, 2020-2035
  • Table 34: Latin America Market Volume (Thousand Units) Forecast by Propulsion Type, 2020-2035
  • Table 35: Latin America Market Value (USD Billion) Forecast by End User, 2020-2035
  • Table 36: Latin America Market Volume (Thousand Units) Forecast by End User, 2020-2035
  • Table 37: Western Europe Market Value (USD Billion) Forecast by Country, 2020-2035
  • Table 38: Western Europe Market Volume (Thousand Units) Forecast by Country, 2020-2035
  • Table 39: Western Europe Market Value (USD Billion) Forecast by Automation Level, 2020-2035
  • Table 40: Western Europe Market Volume (Thousand Units) Forecast by Automation Level, 2020-2035
  • Table 41: Western Europe Market Value (USD Billion) Forecast by Component, 2020-2035
  • Table 42: Western Europe Market Volume (Thousand Units) Forecast by Component, 2020-2035
  • Table 43: Western Europe Market Value (USD Billion) Forecast by Vehicle Type, 2020-2035
  • Table 44: Western Europe Market Volume (Thousand Units) Forecast by Vehicle Type, 2020-2035
  • Table 45: Western Europe Market Value (USD Billion) Forecast by Propulsion Type, 2020-2035
  • Table 46: Western Europe Market Volume (Thousand Units) Forecast by Propulsion Type, 2020-2035
  • Table 47: Western Europe Market Value (USD Billion) Forecast by End User, 2020-2035
  • Table 48: Western Europe Market Volume (Thousand Units) Forecast by End User, 2020-2035
  • Table 49: Eastern Europe Market Value (USD Billion) Forecast by Country, 2020-2035
  • Table 50: Eastern Europe Market Volume (Thousand Units) Forecast by Country, 2020-2035
  • Table 51: Eastern Europe Market Value (USD Billion) Forecast by Automation Level, 2020-2035
  • Table 52: Eastern Europe Market Volume (Thousand Units) Forecast by Automation Level, 2020-2035
  • Table 53: Eastern Europe Market Value (USD Billion) Forecast by Component, 2020-2035
  • Table 54: Eastern Europe Market Volume (Thousand Units) Forecast by Component, 2020-2035
  • Table 55: Eastern Europe Market Value (USD Billion) Forecast by Vehicle Type, 2020-2035
  • Table 56: Eastern Europe Market Volume (Thousand Units) Forecast by Vehicle Type, 2020-2035
  • Table 57: Eastern Europe Market Value (USD Billion) Forecast by Propulsion Type, 2020-2035
  • Table 58: Eastern Europe Market Volume (Thousand Units) Forecast by Propulsion Type, 2020-2035
  • Table 59: Eastern Europe Market Value (USD Billion) Forecast by End User, 2020-2035
  • Table 60: Eastern Europe Market Volume (Thousand Units) Forecast by End User, 2020-2035
  • Table 61: East Asia Market Value (USD Billion) Forecast by Country, 2020-2035
  • Table 62: East Asia Market Volume (Thousand Units) Forecast by Country, 2020-2035
  • Table 63: East Asia Market Value (USD Billion) Forecast by Automation Level, 2020-2035
  • Table 64: East Asia Market Volume (Thousand Units) Forecast by Automation Level, 2020-2035
  • Table 65: East Asia Market Value (USD Billion) Forecast by Component, 2020-2035
  • Table 66: East Asia Market Volume (Thousand Units) Forecast by Component, 2020-2035
  • Table 67: East Asia Market Value (USD Billion) Forecast by Vehicle Type, 2020-2035
  • Table 68: East Asia Market Volume (Thousand Units) Forecast by Vehicle Type, 2020-2035
  • Table 69: East Asia Market Value (USD Billion) Forecast by Propulsion Type, 2020-2035
  • Table 70: East Asia Market Volume (Thousand Units) Forecast by Propulsion Type, 2020-2035
  • Table 71: East Asia Market Value (USD Billion) Forecast by End User, 2020-2035
  • Table 72: East Asia Market Volume (Thousand Units) Forecast by End User, 2020-2035
  • Table 73: South Asia & Pacific Market Value (USD Billion) Forecast by Country, 2020-2035
  • Table 74: South Asia & Pacific Market Volume (Thousand Units) Forecast by Country, 2020-2035
  • Table 75: South Asia & Pacific Market Value (USD Billion) Forecast by Automation Level, 2020-2035
  • Table 76: South Asia & Pacific Market Volume (Thousand Units) Forecast by Automation Level, 2020-2035
  • Table 77: South Asia & Pacific Market Value (USD Billion) Forecast by Component, 2020-2035
  • Table 78: South Asia & Pacific Market Volume (Thousand Units) Forecast by Component, 2020-2035
  • Table 79: South Asia & Pacific Market Value (USD Billion) Forecast by Vehicle Type, 2020-2035
  • Table 80: South Asia & Pacific Market Volume (Thousand Units) Forecast by Vehicle Type, 2020-2035
  • Table 81: South Asia & Pacific Market Value (USD Billion) Forecast by Propulsion Type, 2020-2035
  • Table 82: South Asia & Pacific Market Volume (Thousand Units) Forecast by Propulsion Type, 2020-2035
  • Table 83: South Asia & Pacific Market Value (USD Billion) Forecast by End User, 2020-2035
  • Table 84: South Asia & Pacific Market Volume (Thousand Units) Forecast by End User, 2020-2035
  • Table 85: Middle East and Africa Market Value (USD Billion) Forecast by Country, 2020-2035
  • Table 86: Middle East and Africa Market Volume (Thousand Units) Forecast by Country, 2020-2035
  • Table 87: Middle East and Africa Market Value (USD Billion) Forecast by Automation Level, 2020-2035
  • Table 88: Middle East and Africa Market Volume (Thousand Units) Forecast by Automation Level, 2020-2035
  • Table 89: Middle East and Africa Market Value (USD Billion) Forecast by Component, 2020-2035
  • Table 90: Middle East and Africa Market Volume (Thousand Units) Forecast by Component, 2020-2035
  • Table 91: Middle East and Africa Market Value (USD Billion) Forecast by Vehicle Type, 2020-2035
  • Table 92: Middle East and Africa Market Volume (Thousand Units) Forecast by Vehicle Type, 2020-2035
  • Table 93: Middle East and Africa Market Value (USD Billion) Forecast by Propulsion Type, 2020-2035
  • Table 94: Middle East and Africa Market Volume (Thousand Units) Forecast by Propulsion Type, 2020-2035
  • Table 95: Middle East and Africa Market Value (USD Billion) Forecast by End User, 2020-2035
  • Table 96: Middle East and Africa Market Volume (Thousand Units) Forecast by End User, 2020-2035

List of Figures

  • Figure 1: Global Market Volume (Thousand Units) Forecast 2020-2035
  • Figure 2: Global Market Pricing Analysis
  • Figure 3: Global Market Value (USD Billion) Forecast 2020-2035
  • Figure 4: Global Market Value Share and BPS Analysis by Automation Level, 2025 and 2035
  • Figure 5: Global Market Y-o-Y Growth Comparison by Automation Level, 2025-2035
  • Figure 6: Global Market Attractiveness Analysis by Automation Level
  • Figure 7: Global Market Value Share and BPS Analysis by Component, 2025 and 2035
  • Figure 8: Global Market Y-o-Y Growth Comparison by Component, 2025-2035
  • Figure 9: Global Market Attractiveness Analysis by Component
  • Figure 10: Global Market Value Share and BPS Analysis by Vehicle Type, 2025 and 2035
  • Figure 11: Global Market Y-o-Y Growth Comparison by Vehicle Type, 2025-2035
  • Figure 12: Global Market Attractiveness Analysis by Vehicle Type
  • Figure 13: Global Market Value Share and BPS Analysis by Propulsion Type, 2025 and 2035
  • Figure 14: Global Market Y-o-Y Growth Comparison by Propulsion Type, 2025-2035
  • Figure 15: Global Market Attractiveness Analysis by Propulsion Type
  • Figure 16: Global Market Value Share and BPS Analysis by End User, 2025 and 2035
  • Figure 17: Global Market Y-o-Y Growth Comparison by End User, 2025-2035
  • Figure 18: Global Market Attractiveness Analysis by End User
  • Figure 19: Global Market Value (USD Billion) Share and BPS Analysis by Region, 2025 and 2035
  • Figure 20: Global Market Y-o-Y Growth Comparison by Region, 2025-2035
  • Figure 21: Global Market Attractiveness Analysis by Region
  • Figure 22: North America Market Incremental $ Opportunity, 2025-2035
  • Figure 23: Latin America Market Incremental $ Opportunity, 2025-2035
  • Figure 24: Western Europe Market Incremental $ Opportunity, 2025-2035
  • Figure 25: Eastern Europe Market Incremental $ Opportunity, 2025-2035
  • Figure 26: East Asia Market Incremental $ Opportunity, 2025-2035
  • Figure 27: South Asia & Pacific Market Incremental $ Opportunity, 2025-2035
  • Figure 28: Middle East and Africa Market Incremental $ Opportunity, 2025-2035
  • Figure 29: North America Market Value Share and BPS Analysis by Country, 2025 and 2035
  • Figure 30: North America Market Value Share and BPS Analysis by Automation Level, 2025 and 2035
  • Figure 31: North America Market Y-o-Y Growth Comparison by Automation Level, 2025-2035
  • Figure 32: North America Market Attractiveness Analysis by Automation Level
  • Figure 33: North America Market Value Share and BPS Analysis by Component, 2025 and 2035
  • Figure 34: North America Market Y-o-Y Growth Comparison by Component, 2025-2035
  • Figure 35: North America Market Attractiveness Analysis by Component
  • Figure 36: North America Market Value Share and BPS Analysis by Vehicle Type, 2025 and 2035
  • Figure 37: North America Market Y-o-Y Growth Comparison by Vehicle Type, 2025-2035
  • Figure 38: North America Market Attractiveness Analysis by Vehicle Type
  • Figure 39: North America Market Value Share and BPS Analysis by Propulsion Type, 2025 and 2035
  • Figure 40: North America Market Y-o-Y Growth Comparison by Propulsion Type, 2025-2035
  • Figure 41: North America Market Attractiveness Analysis by Propulsion Type
  • Figure 42: North America Market Value Share and BPS Analysis by End User, 2025 and 2035
  • Figure 43: North America Market Y-o-Y Growth Comparison by End User, 2025-2035
  • Figure 44: North America Market Attractiveness Analysis by End User
  • Figure 45: Latin America Market Value Share and BPS Analysis by Country, 2025 and 2035
  • Figure 46: Latin America Market Value Share and BPS Analysis by Automation Level, 2025 and 2035
  • Figure 47: Latin America Market Y-o-Y Growth Comparison by Automation Level, 2025-2035
  • Figure 48: Latin America Market Attractiveness Analysis by Automation Level
  • Figure 49: Latin America Market Value Share and BPS Analysis by Component, 2025 and 2035
  • Figure 50: Latin America Market Y-o-Y Growth Comparison by Component, 2025-2035
  • Figure 51: Latin America Market Attractiveness Analysis by Component
  • Figure 52: Latin America Market Value Share and BPS Analysis by Vehicle Type, 2025 and 2035
  • Figure 53: Latin America Market Y-o-Y Growth Comparison by Vehicle Type, 2025-2035
  • Figure 54: Latin America Market Attractiveness Analysis by Vehicle Type
  • Figure 55: Latin America Market Value Share and BPS Analysis by Propulsion Type, 2025 and 2035
  • Figure 56: Latin America Market Y-o-Y Growth Comparison by Propulsion Type, 2025-2035
  • Figure 57: Latin America Market Attractiveness Analysis by Propulsion Type
  • Figure 58: Latin America Market Value Share and BPS Analysis by End User, 2025 and 2035
  • Figure 59: Latin America Market Y-o-Y Growth Comparison by End User, 2025-2035
  • Figure 60: Latin America Market Attractiveness Analysis by End User
  • Figure 61: Western Europe Market Value Share and BPS Analysis by Country, 2025 and 2035
  • Figure 62: Western Europe Market Value Share and BPS Analysis by Automation Level, 2025 and 2035
  • Figure 63: Western Europe Market Y-o-Y Growth Comparison by Automation Level, 2025-2035
  • Figure 64: Western Europe Market Attractiveness Analysis by Automation Level
  • Figure 65: Western Europe Market Value Share and BPS Analysis by Component, 2025 and 2035
  • Figure 66: Western Europe Market Y-o-Y Growth Comparison by Component, 2025-2035
  • Figure 67: Western Europe Market Attractiveness Analysis by Component
  • Figure 68: Western Europe Market Value Share and BPS Analysis by Vehicle Type, 2025 and 2035
  • Figure 69: Western Europe Market Y-o-Y Growth Comparison by Vehicle Type, 2025-2035
  • Figure 70: Western Europe Market Attractiveness Analysis by Vehicle Type
  • Figure 71: Western Europe Market Value Share and BPS Analysis by Propulsion Type, 2025 and 2035
  • Figure 72: Western Europe Market Y-o-Y Growth Comparison by Propulsion Type, 2025-2035
  • Figure 73: Western Europe Market Attractiveness Analysis by Propulsion Type
  • Figure 74: Western Europe Market Value Share and BPS Analysis by End User, 2025 and 2035
  • Figure 75: Western Europe Market Y-o-Y Growth Comparison by End User, 2025-2035
  • Figure 76: Western Europe Market Attractiveness Analysis by End User
  • Figure 77: Eastern Europe Market Value Share and BPS Analysis by Country, 2025 and 2035
  • Figure 78: Eastern Europe Market Value Share and BPS Analysis by Automation Level, 2025 and 2035
  • Figure 79: Eastern Europe Market Y-o-Y Growth Comparison by Automation Level, 2025-2035
  • Figure 80: Eastern Europe Market Attractiveness Analysis by Automation Level
  • Figure 81: Eastern Europe Market Value Share and BPS Analysis by Component, 2025 and 2035
  • Figure 82: Eastern Europe Market Y-o-Y Growth Comparison by Component, 2025-2035
  • Figure 83: Eastern Europe Market Attractiveness Analysis by Component
  • Figure 84: Eastern Europe Market Value Share and BPS Analysis by Vehicle Type, 2025 and 2035
  • Figure 85: Eastern Europe Market Y-o-Y Growth Comparison by Vehicle Type, 2025-2035
  • Figure 86: Eastern Europe Market Attractiveness Analysis by Vehicle Type
  • Figure 87: Eastern Europe Market Value Share and BPS Analysis by Propulsion Type, 2025 and 2035
  • Figure 88: Eastern Europe Market Y-o-Y Growth Comparison by Propulsion Type, 2025-2035
  • Figure 89: Eastern Europe Market Attractiveness Analysis by Propulsion Type
  • Figure 90: Eastern Europe Market Value Share and BPS Analysis by End User, 2025 and 2035
  • Figure 91: Eastern Europe Market Y-o-Y Growth Comparison by End User, 2025-2035
  • Figure 92: Eastern Europe Market Attractiveness Analysis by End User
  • Figure 93: East Asia Market Value Share and BPS Analysis by Country, 2025 and 2035
  • Figure 94: East Asia Market Value Share and BPS Analysis by Automation Level, 2025 and 2035
  • Figure 95: East Asia Market Y-o-Y Growth Comparison by Automation Level, 2025-2035
  • Figure 96: East Asia Market Attractiveness Analysis by Automation Level
  • Figure 97: East Asia Market Value Share and BPS Analysis by Component, 2025 and 2035
  • Figure 98: East Asia Market Y-o-Y Growth Comparison by Component, 2025-2035
  • Figure 99: East Asia Market Attractiveness Analysis by Component
  • Figure 100: East Asia Market Value Share and BPS Analysis by Vehicle Type, 2025 and 2035
  • Figure 101: East Asia Market Y-o-Y Growth Comparison by Vehicle Type, 2025-2035
  • Figure 102: East Asia Market Attractiveness Analysis by Vehicle Type
  • Figure 103: East Asia Market Value Share and BPS Analysis by Propulsion Type, 2025 and 2035
  • Figure 104: East Asia Market Y-o-Y Growth Comparison by Propulsion Type, 2025-2035
  • Figure 105: East Asia Market Attractiveness Analysis by Propulsion Type
  • Figure 106: East Asia Market Value Share and BPS Analysis by End User, 2025 and 2035
  • Figure 107: East Asia Market Y-o-Y Growth Comparison by End User, 2025-2035
  • Figure 108: East Asia Market Attractiveness Analysis by End User
  • Figure 109: South Asia & Pacific Market Value Share and BPS Analysis by Country, 2025 and 2035
  • Figure 110: South Asia & Pacific Market Value Share and BPS Analysis by Automation Level, 2025 and 2035
  • Figure 111: South Asia & Pacific Market Y-o-Y Growth Comparison by Automation Level, 2025-2035
  • Figure 112: South Asia & Pacific Market Attractiveness Analysis by Automation Level
  • Figure 113: South Asia & Pacific Market Value Share and BPS Analysis by Component, 2025 and 2035
  • Figure 114: South Asia & Pacific Market Y-o-Y Growth Comparison by Component, 2025-2035
  • Figure 115: South Asia & Pacific Market Attractiveness Analysis by Component
  • Figure 116: South Asia & Pacific Market Value Share and BPS Analysis by Vehicle Type, 2025 and 2035
  • Figure 117: South Asia & Pacific Market Y-o-Y Growth Comparison by Vehicle Type, 2025-2035
  • Figure 118: South Asia & Pacific Market Attractiveness Analysis by Vehicle Type
  • Figure 119: South Asia & Pacific Market Value Share and BPS Analysis by Propulsion Type, 2025 and 2035
  • Figure 120: South Asia & Pacific Market Y-o-Y Growth Comparison by Propulsion Type, 2025-2035
  • Figure 121: South Asia & Pacific Market Attractiveness Analysis by Propulsion Type
  • Figure 122: South Asia & Pacific Market Value Share and BPS Analysis by End User, 2025 and 2035
  • Figure 123: South Asia & Pacific Market Y-o-Y Growth Comparison by End User, 2025-2035
  • Figure 124: South Asia & Pacific Market Attractiveness Analysis by End User
  • Figure 125: Middle East and Africa Market Value Share and BPS Analysis by Country, 2025 and 2035
  • Figure 126: Middle East and Africa Market Value Share and BPS Analysis by Automation Level, 2025 and 2035
  • Figure 127: Middle East and Africa Market Y-o-Y Growth Comparison by Automation Level, 2025-2035
  • Figure 128: Middle East and Africa Market Attractiveness Analysis by Automation Level
  • Figure 129: Middle East and Africa Market Value Share and BPS Analysis by Component, 2025 and 2035
  • Figure 130: Middle East and Africa Market Y-o-Y Growth Comparison by Component, 2025-2035
  • Figure 131: Middle East and Africa Market Attractiveness Analysis by Component
  • Figure 132: Middle East and Africa Market Value Share and BPS Analysis by Vehicle Type, 2025 and 2035
  • Figure 133: Middle East and Africa Market Y-o-Y Growth Comparison by Vehicle Type, 2025-2035
  • Figure 134: Middle East and Africa Market Attractiveness Analysis by Vehicle Type
  • Figure 135: Middle East and Africa Market Value Share and BPS Analysis by Propulsion Type, 2025 and 2035
  • Figure 136: Middle East and Africa Market Y-o-Y Growth Comparison by Propulsion Type, 2025-2035
  • Figure 137: Middle East and Africa Market Attractiveness Analysis by Propulsion Type
  • Figure 138: Middle East and Africa Market Value Share and BPS Analysis by End User, 2025 and 2035
  • Figure 139: Middle East and Africa Market Y-o-Y Growth Comparison by End User, 2025-2035
  • Figure 140: Middle East and Africa Market Attractiveness Analysis by End User
  • Figure 141: Global Market - Tier Structure Analysis
  • Figure 142: Global Market - Company Share Analysis

Frequently Asked Questions

What is the market size of the AI-based driving systems (L2 to L5) market in 2025?

The market size is valued at USD 2.35 billion in 2025.

How much will the AI-based driving systems (L2 to L5) market reach by 2035?

It is projected to reach USD 8.7 billion by 2035.

What is the forecast CAGR for the AI-based driving systems (L2 to L5) market from 2025 to 2035?

The market is expected to grow at a CAGR of 14% during 2025-2035.

Which automation level holds the largest share in the market?

Level 2 (partial automation) holds the largest share with 40% in 2025.

Who is the leading player in the market?

Tesla, Inc. is the leading player with 24% share.

Explore Similar Insights

Future Market Insights

AI-Based Driving Systems (L2 to L5) Market