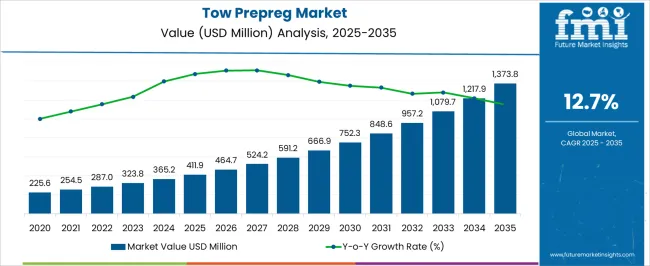
The Tow Prepreg Market is estimated to be valued at USD 411.9 million in 2025 and is projected to reach USD 1373.8 million by 2035, registering a compound annual growth rate (CAGR) of 12.7% over the forecast period.
| Metric | Value |
|---|---|
| Tow Prepreg Market Estimated Value in (2025 E) | USD 411.9 million |
| Tow Prepreg Market Forecast Value in (2035 F) | USD 1373.8 million |
| Forecast CAGR (2025 to 2035) | 12.7% |
The tow prepreg market is expanding steadily, fueled by rising demand in aerospace, automotive, and energy sectors where lightweight and high-strength composite materials are essential. Pre-impregnated fiber tows provide uniform resin distribution, improved structural performance, and reduced processing time, making them highly suitable for advanced engineering applications.
The market benefits from growing adoption in high-pressure tanks, wind turbine blades, and aerospace structures requiring durability and weight efficiency. Investments in renewable energy projects and hydrogen storage solutions have further boosted market demand.
The current landscape is characterized by expanding production capacity, material innovations, and improved cost-efficiency of prepregs. Future growth is expected to be reinforced by increasing penetration into automotive lightweighting and defense applications, supported by strong research initiatives in high-performance composites.
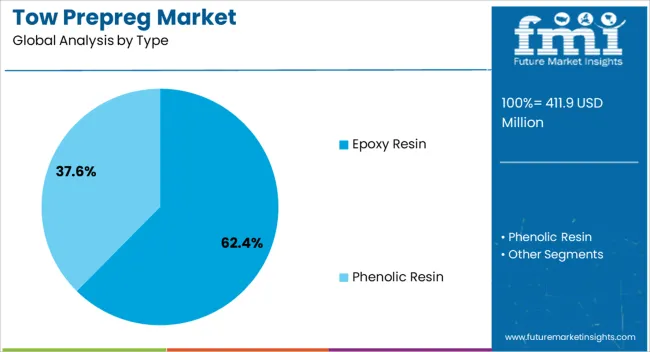
The epoxy resin segment dominates the type category in the tow prepreg market, holding approximately 62.40% share. Its prominence is driven by superior mechanical properties, high adhesion strength, and thermal resistance, making it the preferred choice for advanced composite applications.
The segment benefits from its compatibility with carbon fibers and its widespread use in aerospace and automotive structural components. Epoxy-based prepregs are also favored in pressure vessel manufacturing due to their resistance to environmental degradation and long-term stability.
Ongoing material innovations that enhance toughness and reduce curing times have further solidified the segment’s leadership. With expanding demand in high-performance industries, epoxy resin is expected to remain the leading resin system in the tow prepreg market.
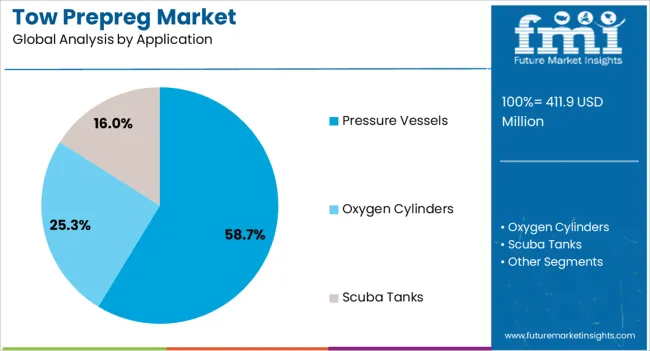
The pressure vessels segment leads the application category, accounting for approximately 58.70% share of the tow prepreg market. This dominance is supported by the growing need for lightweight, high-strength vessels used in aerospace, automotive fuel systems, and renewable energy storage solutions.
Tow prepregs provide the required durability and safety standards while reducing overall system weight, enabling efficiency in fuel and energy storage. The segment benefits significantly from the increasing deployment of hydrogen storage tanks and compressed natural gas systems in clean energy transportation.
As global initiatives toward decarbonization progress, demand for advanced pressure vessels is expected to intensify, reinforcing this segment’s strong share.
The scope for global tow prepreg market insights expanded at a 15.9% CAGR between 2020 and 2025. The market is anticipated to develop at a CAGR of 12.8% over the forecast period from 2025 to 2035.
| Historical CAGR (2020 to 2025) | 15.9% |
|---|---|
| Forecasted CAGR (2025 to 2035) | 12.8% |
Between 2020 and 2025, the global market experienced substantial growth, with insights expanding at an impressive CAGR of 15.9%. This period was marked by heightened demand for tow prepreg across various industries, driven by their lightweight and high-strength characteristics. The market witnessed a surge in applications, particularly in the aerospace and automotive sectors, contributing to its remarkable expansion.
Looking ahead, the forecast for the market from 2025 to 2035 indicates a continued positive trajectory, albeit at a slightly moderated pace. The anticipated CAGR during this forecast period is 12.8%, suggesting sustained growth and ongoing demand for tow prepreg.
The projection aligns with the persistent need for high-performance composite materials in industries seeking advanced solutions for lightweight and durable applications. The market outlook underscores its resilience and significance in the evolving landscape of materials used across various manufacturing sectors globally.
| Attributes | Details |
|---|---|
| Drivers |
|
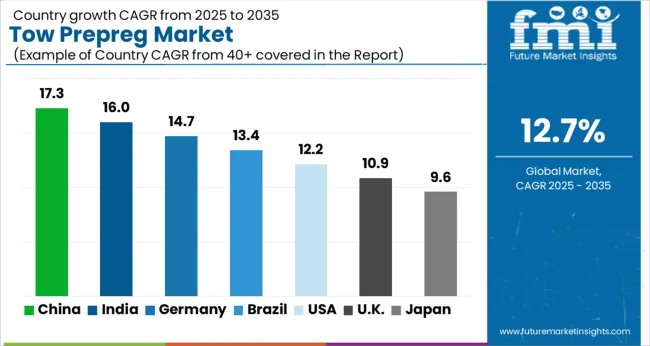
The table presents CAGRs for five key countries, the United States, Japan, China, the United Kingdom, and South Korea.
South Korea market stands out as dynamic and poised for substantial growth, projected to achieve a 15% CAGR by 2035. The commitment of the nation to innovation and diverse industry contributions underscores its thriving economic landscape and signifies significant advancements in its economic evolution.
In the United States, the market experiences significant utilization, driven by the aerospace and automotive industries. The lightweight and high-strength properties of tow prepreg make them integral in aircraft components and vehicle manufacturing.
With a strong emphasis on technological advancements and a demand for advanced composite materials, the United States market for tow prepreg is propelled by diverse industrial applications.
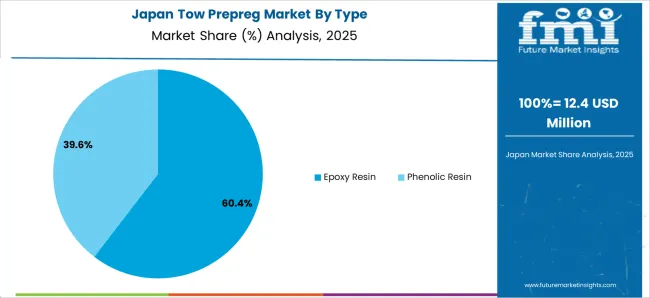
The advanced technological landscape and innovation-driven industries account for its extensive utilization of tow prepreg. The aerospace sector in Japan extensively incorporates tow prepreg due to their crucial role in achieving lightweight and high-performance components.
The automotive industry in Japan relies on these materials for manufacturing fuel-efficient vehicles, contributing to the robust growth of the market.
The market in China is prominently used in response to the booming aerospace and automotive sectors of the country. As China rapidly advances in technological capabilities, the demand for lightweight and durable materials, like tow prepreg, rises.
The market growth is further fueled by the emphasis of the nation on becoming a global leader in manufacturing, promoting the adoption of advanced composite materials.
The United Kingdom uses tow prepreg extensively, particularly in the aerospace and automotive industries. With a strong focus on innovation and high-performance materials, tow prepreg are crucial in manufacturing components that meet stringent industry standards.
The commitment of the country to sustainable and advanced manufacturing practices further contributes to the widespread adoption of tow prepreg.
South Korea stands out for its substantial use of tow prepreg, mainly driven by its thriving technology-driven industries and a burgeoning automotive sector. The lightweight nature of tow prepreg aligns with South Korea pursuit of fuel-efficient and high-performance vehicles.
The commitment to technological advancements and global competitiveness propels the demand for tow prepreg across various industrial applications.
The table below provides an overview of the tow prepreg landscape based on resin type and application. Epoxy resin is projected to lead the resin type of market at a 12.6% CAGR by 2035, while pressure vessels in the application category are likely to expand at a CAGR of 12.4% by 2035.
The prominence of epoxy resin in the market is primarily driven by its versatile characteristics, including strong adhesion, durability, and resistance. The robust growth projection for tow prepreg in pressure vessel applications is propelled by the increasing demand for lightweight yet robust materials in manufacturing.
| Category | CAGR by 2035 |
|---|---|
| Epoxy Resins | 12.6% |
| Pressure Vessels | 12.4% |
Epoxy resin emerges as a frontrunner in the resin type segment, with a projected CAGR of 12.6% by 2035. This highlights the dominance of epoxy resin in tow prepreg formulations, driven by its versatile properties, including strong adhesion, durability, and resistance.
In the application category, a notable growth projection is observed for pressure vessels, expected to expand at a CAGR of 12.4% by 2035. This underscores the increasing utilization of tow prepreg in manufacturing components like high-pressure vessels, reflecting the material suitability for applications demanding strength, lightweight characteristics, and resistance to high pressures.
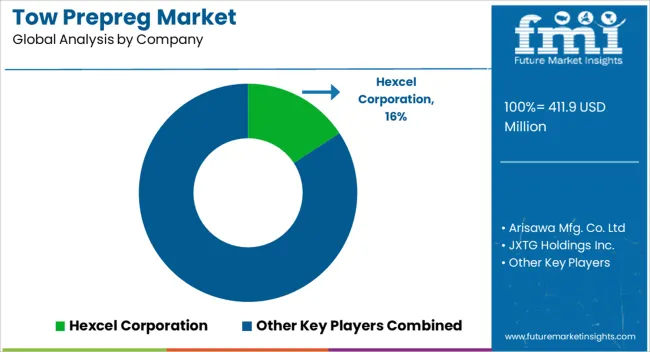
The tow prepreg market is characterized by robust competition, with key players vying for prominence in this dynamic industry. These industry leaders contribute significantly to market trends, influencing technological advancements and product innovations. Their established market presence and diverse product portfolios give them a competitive edge.
Emerging players and smaller companies actively participate in the market, contributing to a competitive and innovative environment. New entrants often focus on product differentiation and strategic collaborations to carve out their niche and gain traction in the market.
The competitive dynamic fosters a continuous push for research and development, with companies seeking to introduce cutting-edge tow prepreg solutions to meet the evolving demands of various industries.
Some of the recent developments are
| Attributes | Details |
|---|---|
| Estimated Market Size in 2025 | USD 365.2 million |
| Projected Market Valuation in 2035 | USD 1,220 million |
| CAGR Share from 2025 to 2035 | 12.8% |
| Forecast Period | 2025 to 2035 |
| Historical Data Available for | 2020 to 2025 |
| Market Analysis | Value in USD million |
| Key Regions Covered | North America; Latin America; Europe; East Asia; South Asia; Oceania; The Middle East and Africa |
| Key Market Segments Covered | By Resin Type, By Application, By Region |
| Key Countries Profiled | The United States, Canada, Brazil, Mexico, Argentina, Germany, Italy, The United Kingdom, France, Spain, Russia, BENELUX, China, Japan, South Korea, India, Thailand, Malaysia, Indonesia, Australia, New Zealand, GCC Countries |
| Key Companies Profiled | Arisawa Mfg. Co. Ltd; JXTG Holdings Inc.; Porcher Industries Designs; Red Composites Ltd; Hexcel Corporation; SGL Carbon SE; TCR Composites; Teijin Ltd; Vitech Composites; Others |
The global tow prepreg market is estimated to be valued at USD 411.9 million in 2025.
The market size for the tow prepreg market is projected to reach USD 1,373.8 million by 2035.
The tow prepreg market is expected to grow at a 12.7% CAGR between 2025 and 2035.
The key product types in tow prepreg market are epoxy resin and phenolic resin.
In terms of application, pressure vessels segment to command 58.7% share in the tow prepreg market in 2025.


Full Research Suite comprises of:
Market outlook & trends analysis
Interviews & case studies
Strategic recommendations
Vendor profiles & capabilities analysis
5-year forecasts
8 regions and 60+ country-level data splits
Market segment data splits
12 months of continuous data updates
DELIVERED AS:
PDF EXCEL ONLINE
Towing Software Market Size and Share Forecast Outlook 2025 to 2035
Tower Crane Rental Market Growth – Trends & Forecast 2025 to 2035
Tower Crane Market Growth - Trends & Forecast 2025 to 2035
Tower Mounted Amplifier Market by Type, by Technology, by End User & Region Forecast till 2035
Analyzing Tower Mounted Amplifier Market Share & Industry Leaders
UK Tower Mounted Amplifier Market Trends – Size, Share & Growth 2025-2035
USA Tower Mounted Amplifier Market Growth – Demand, Trends & Forecast 2025-2035
Hand Towel Automatic Folding Machine Market Size and Share Forecast Outlook 2025 to 2035
Beach Towels Market Analysis - Trends, Growth & Forecast 2025 to 2035
Japan Tower Mounted Amplifier Market Report – Demand, Trends & Industry Forecast 2025-2035
Safety Towing System Market Size and Share Forecast Outlook 2025 to 2035
Remote Towers Market Size and Share Forecast Outlook 2025 to 2035
Tissue Towel Market Analysis - Trends, Growth & Forecast 2025 to 2035
Telecom Tower Power System Market Size and Share Forecast Outlook 2025 to 2035
Cooling Tower Fans Market Size and Share Forecast Outlook 2025 to 2035
Telecom Tower Power System Market Analysis - Size, Share, and Forecast Outlook 2025 to 2035
Cooling Tower Market Size and Share Forecast Outlook 2025 to 2035
Control Towers Market Size and Share Forecast Outlook 2025 to 2035
Cooling Tower Rental Market Size, Growth, and Forecast 2025 to 2035
Germany Tower Mounted Amplifier Market Analysis - Growth, Applications & Outlook 2025 to 2035

Thank you!
You will receive an email from our Business Development Manager. Please be sure to check your SPAM/JUNK folder too.
Chat With
MaRIA