The Towing Software Market is estimated to be valued at USD 545.7 million in 2025 and is projected to reach USD 888.9 million by 2035, registering a compound annual growth rate (CAGR) of 5.0% over the forecast period.
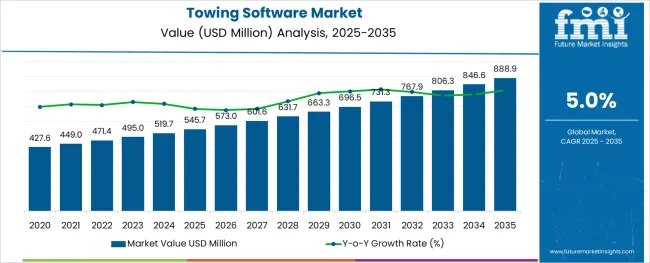
The towing software market is expanding rapidly, driven by the increasing digitization of fleet management and operational workflows in the towing industry. Industry insights have highlighted a shift toward cloud-based platforms that offer real-time data access, streamlined dispatching, and enhanced customer service capabilities.
Growing adoption of software solutions among small and medium-sized enterprises (SMEs) is fueling demand, as these businesses seek affordable and scalable tools to optimize operations and reduce response times. The need to comply with evolving regulatory requirements and improve transparency in service delivery has further accelerated market uptake.
Additionally, mobile integration and GPS tracking features are increasingly being incorporated to enhance operational efficiency. As fleet operators aim to improve customer satisfaction and manage costs more effectively, the market outlook remains positive. Segmental growth is expected to be led by cloud-based software types, with SME-focused applications driving the largest share.
The market is segmented by Type and Application and region. By Type, the market is divided into Cloud-based and Web-based. In terms of Application, the market is classified into For SME and For Large Enterprises. Regionally, the market is classified into North America, Latin America, Western Europe, Eastern Europe, Balkan & Baltic Countries, Russia & Belarus, Central Asia, East Asia, South Asia & Pacific, and the Middle East & Africa.
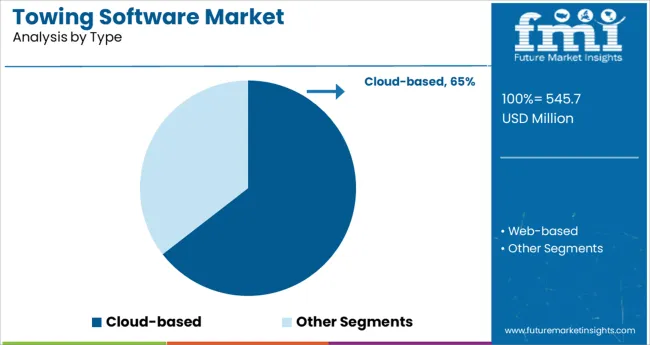
The Cloud-based segment is projected to account for 64.5% of the towing software market revenue in 2025, solidifying its position as the dominant type. This segment’s growth has been propelled by the flexibility and scalability that cloud platforms offer to towing operators.
Cloud-based software enables remote access, real-time updates, and seamless integration with mobile devices, which is essential for the dynamic nature of towing services. Additionally, reduced upfront investment costs and the subscription-based pricing model have made cloud solutions attractive for businesses of all sizes.
Enhanced data security and automatic software updates further contribute to the preference for cloud-based platforms. As digital transformation accelerates within the transportation sector, the Cloud-based segment is expected to maintain its leadership position.
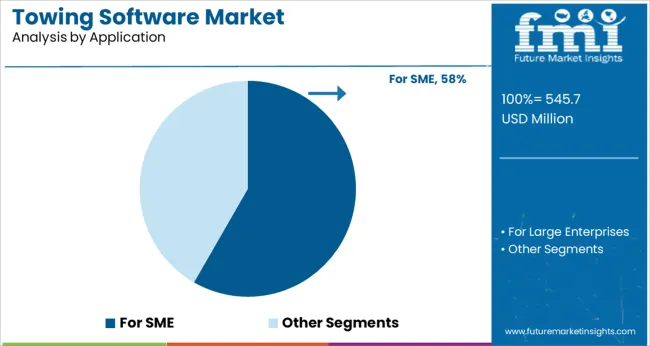
The SME application segment is expected to contribute 58.3% of the towing software market revenue in 2025, establishing itself as the leading application category. This growth is driven by small and medium-sized towing companies increasingly adopting software solutions to enhance operational control and customer management.
SMEs benefit from software that offers easy implementation, customizable features, and cost-effective pricing, which are critical factors for businesses with limited resources. Moreover, SMEs are leveraging towing software to optimize dispatch, billing, and compliance tasks, improving overall efficiency and profitability.
The rising number of SMEs entering the towing industry, combined with heightened competition, has encouraged greater software adoption. Given the sector's growth and the increasing importance of technology in business operations, the SME application segment is poised to remain dominant.
The global towing software market is experiencing moderate growth owing to the swelling demand for advanced towing solutions. Moreover, the upward trend of vehicle automation and the increasing number of vehicles in use are also contributing to the growth of this market.
The presence of a well-established automotive sector and the growing investment in transportation infrastructure are also encouraging the growth of this market. Besides, the growing implementation of tow truck software by large enterprises and SMEs globally is another key aspect driving the growth of this market.
Tech giants are compelled to digitally transform their business models and are capitalizing heavily on digital platforms to get value-producing opportunities and stay ahead of other players along with improving the consistency and quality of their services. From artificial intelligence, augmented reality, and virtual reality to the internet of things, the mounting number of internet-connected gadgets across the globe is contributing to the development of the global Towing Software market.
In the past two to three decades, the towing software market has witnessed a drastic revolution followed by several technological advances and innovations. With the arrival of new towing software in the market, the established players are facing cutting-edge competition from the newcomers.
To survive, prominent software brands like a beacon, trackers, and VTS systems are launching advanced features and are collaborating to expand their market grounds. Throughout the year, Telematics or integrated GPS has become the fastest-growing brand by offering intelligent dispatch and interactive drivers, along with real-time performance data.
The adoption of cloud-based towing management software like towbook for towing companies is facilitating dispatching, impounds, invoicing, and more. This software can now be accessed from anywhere through mobile phones and iPhones. Similar to tow book, other applications like Housecall Pro, mHelpDesk, jobber, and others are offering lucrative growth prospects for towing software across the globe.
Despite multiple applications in Large and SMEs, there comes along few market limitations which restrict the market expansion of Towing Software. Some of them include the dearth of skilled professionals and the absence of awareness about the towing software in the market.
Besides, the rising cases of cyber threats are one of the prominent restraining factors which increase privacy concerns among individuals. The high cost of towing software is also a significant factor that put forward challenges in the growth of the market.
Demand for Cloud-based Towing Software to Remain Prominent
According to Future Market Insights, the cloud-based towing software segment is estimated to be most sought after, expanding at a CAGR of 4.9% throughout the forecast period. Cloud-based software is an internet-based program. It’s an impressive substitute for the conventional way of installing and running applications on our servers or desktop computers.
Running programs in this manner proposes numerous discrete benefits, including the lower cost which eradicates the necessity of expensive hardware as the user already has everything they require- an internet-enabled system. This cloud-based software can be accessed from any location and from any device which facilitates automatic updating.
In a nutshell, cloud-based towing software is an IT resource that is offered over the Internet. These services can come in the form of public clouds, private clouds, and hybrid clouds, which integration of public and private clouds. Prominent cloud service providers are Google Cloud Platform, Amazon Web Services, Microsoft Azure, IBM Cloud, Oracle, and others.
VTS Cloud technology provides mobility, flexibility, simplicity, and security, at an affordable price. Web-based towing software redefined. To improve the market performance, the company has added some new features to VTS Classic such as Cloud Lite and Cloud Classic. While the Cloud Lite is suitable for small & medium enterprises, the Cloud Classic is regardless of size.
Towing Software to be Deployed Most across SMEs
By application, SMEs are prominent users of tow truck software. The software assists these businesses to supervise their fleet, dispatching drivers, and tracking vehicles in real time. Additionally, the software also offers information on fuel proficiency and vehicle diagnostics. This permits industrialists to make well-versed decisions about their operations. Besides, the usage of tow truck software can aid businesses to reduce fuel costs and maintenance expenses. Therefore, there is a mounting demand for tow truck software among SMEs globally.
According to the Future Market Insights report, the SME segment is likely to grow at a 6.4% CAGR. This growth is backed by rising government initiatives, including digital campaigns such as social media marketing, video marketing, and search engine marketing. For example, in May 2024, Singapore's Info-Communications Media Development Authority (IMDA) launched a public consultation process to form a policy framework to enable the deployment of 5G networks. These efforts are elevating the application of towing software in small & medium enterprises across the globe.
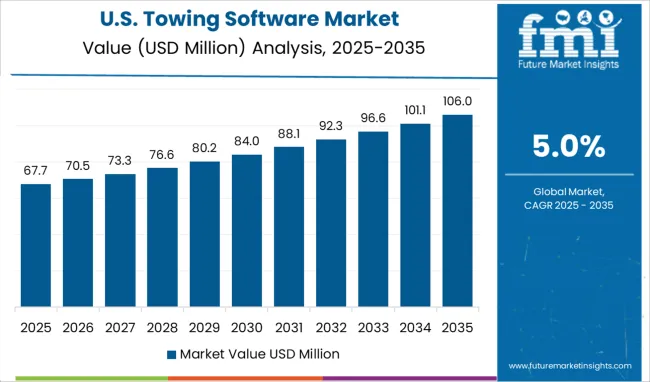
The USA held the largest share in 2024 and witnessed moderate growth during the historic outlook. A recently published report by Future Market Insights reveals that the USA towing software market is projected to surpass USD 888.9 Million by 2035, documenting a CAGR of 4.7%. The market growth is attributed to the soaring demand for cloud-based tow truck software and the upward trend in vehicle automation. Additionally, the country has a well-established automotive sector, which is further expanding the towing software market.
Factors such as an improvement in operational efficiency owing to remote data accessibility and enhanced communication with the usage of connected navigation technology are likely to augment the growth of the USA towing software market. Moreover, there has been amplified demand for roadside assistance, expected to offer affluent growth prospects to the USA towing software market.
In May 2025, Traxero North America announced combining the towing software providers under one company. This shift in the industry of integrated solutions will empower towing and roadside assistance businesses to save time and money.
The Chinese tow truck software market witnessed the fastest growth in recent years. The prominent drivers for this growth are the increasing number of vehicles in usage and the snowballing demand for sophisticated towing solutions. Additionally, the governing bodies are investing heftily in transportation infrastructure, which is postulating support to the towing software market.
As per the Future Market Insights report, China captures the majority share in the Asia Pacific towing software market, contributing nearly 33% to the market revenue. The Chinese market for towing software is forecasted to expand at a CAGR of 4.3% to exceed USD 888.9 Million by the end of 2035.
In July 2024, CGG Countries GeoSoftware and Amazon Web Services (AWS) extended their partnership in the global E&P industry to China (NWCD working for AWS China Ningxia region, Sinnet working for AWS China Beijing Region). GeoSoftware 11.0, CGG’s recently presented portfolio of reservoir characterization and petrophysical interpretation software solutions, is presently available in AWS China (Ningxia) region for the Chinese E&P industry.
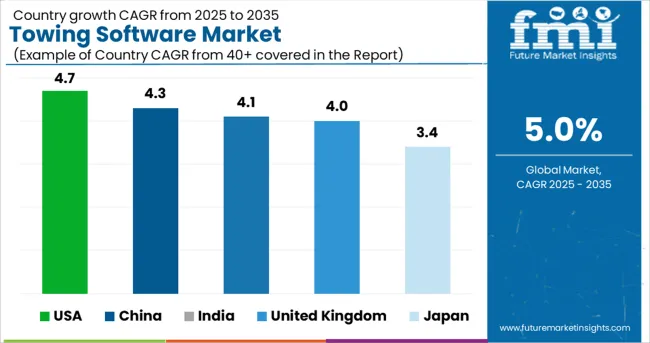
| Countries | Estimated CAGR |
|---|---|
| USA | 4.7% |
| United Kingdom | 4% |
| China | 4.3% |
| Japan | 3.4% |
| India | 4.1% |
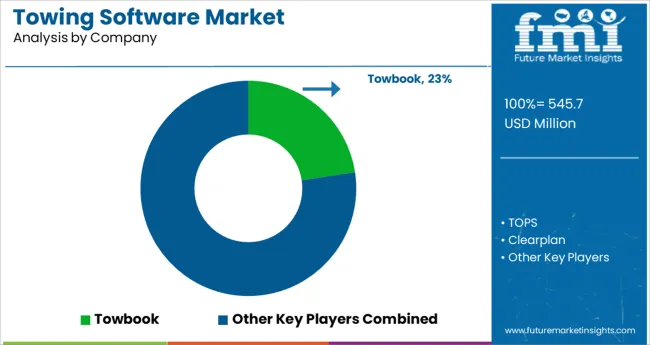
Key players in the global towing software market include TOPS, Clearplan, Dispatch Anywhere, ProTow, and Tow Administrator, among others. Some of the recent developments in the global towing software market are:
| Report Attribute | Details |
|---|---|
| Growth Rate | CAGR of 5% from 2025 to 2035 |
| Market Value in 2025 | USD 545.7 Million |
| Market Value in 2035 | USD 888.9 Million |
| Base Year for Estimation | 2024 |
| Forecast Period | 2025 to 2035 |
| Quantitative Units | Revenue in million and CAGR from 2025 to 2035 |
| Report Coverage | Revenue Forecast, Volume Forecast, Company Ranking, Competitive Landscape, Growth Factors, Trends, and Pricing Analysis |
| Segments Covered | Type, Application, Region |
| Regions Covered | North America; Latin America; Europe; Asia Pacific; The Middle East and Africa |
| Key Countries Profiled | USA, Canada, Brazil, Mexico, Germany, United Kingdom, France, Italy, Nordics, BENELUX, China, Japan, South Korea, GCC Countries, South Africa |
| Key Companies Profiled | TOPS; Clearplan; Dispatch Anywhere; ProTow; Tow Administrator; TowBook; DATOW; Roadside; TownManager; TowSoft; FleetPride Inc.; Force Technology |
| Customization | Available Upon Request |
The global towing software market is estimated to be valued at USD 545.7 million in 2025.
It is projected to reach USD 888.9 million by 2035.
The market is expected to grow at a 5.0% CAGR between 2025 and 2035.
The key product types are cloud-based and web-based.
for sme segment is expected to dominate with a 58.3% industry share in 2025.


Our Research Products

The "Full Research Suite" delivers actionable market intel, deep dives on markets or technologies, so clients act faster, cut risk, and unlock growth.

The Leaderboard benchmarks and ranks top vendors, classifying them as Established Leaders, Leading Challengers, or Disruptors & Challengers.

Locates where complements amplify value and substitutes erode it, forecasting net impact by horizon

We deliver granular, decision-grade intel: market sizing, 5-year forecasts, pricing, adoption, usage, revenue, and operational KPIs—plus competitor tracking, regulation, and value chains—across 60 countries broadly.

Spot the shifts before they hit your P&L. We track inflection points, adoption curves, pricing moves, and ecosystem plays to show where demand is heading, why it is changing, and what to do next across high-growth markets and disruptive tech

Real-time reads of user behavior. We track shifting priorities, perceptions of today’s and next-gen services, and provider experience, then pace how fast tech moves from trial to adoption, blending buyer, consumer, and channel inputs with social signals (#WhySwitch, #UX).

Partner with our analyst team to build a custom report designed around your business priorities. From analysing market trends to assessing competitors or crafting bespoke datasets, we tailor insights to your needs.
Supplier Intelligence
Discovery & Profiling
Capacity & Footprint
Performance & Risk
Compliance & Governance
Commercial Readiness
Who Supplies Whom
Scorecards & Shortlists
Playbooks & Docs
Category Intelligence
Definition & Scope
Demand & Use Cases
Cost Drivers
Market Structure
Supply Chain Map
Trade & Policy
Operating Norms
Deliverables
Buyer Intelligence
Account Basics
Spend & Scope
Procurement Model
Vendor Requirements
Terms & Policies
Entry Strategy
Pain Points & Triggers
Outputs
Pricing Analysis
Benchmarks
Trends
Should-Cost
Indexation
Landed Cost
Commercial Terms
Deliverables
Brand Analysis
Positioning & Value Prop
Share & Presence
Customer Evidence
Go-to-Market
Digital & Reputation
Compliance & Trust
KPIs & Gaps
Outputs
Full Research Suite comprises of:
Market outlook & trends analysis
Interviews & case studies
Strategic recommendations
Vendor profiles & capabilities analysis
5-year forecasts
8 regions and 60+ country-level data splits
Market segment data splits
12 months of continuous data updates
DELIVERED AS:
PDF EXCEL ONLINE
Software-Defined Wide Area Network Market Size and Share Forecast Outlook 2025 to 2035
Software Defined Vehicle Market Size and Share Forecast Outlook 2025 to 2035
Software Defined Networking (SDN) And Network Function Virtualization (NFV) Market Size and Share Forecast Outlook 2025 to 2035
Software Defined Perimeter (SDP) Market Size and Share Forecast Outlook 2025 to 2035
Software-Defined Wide Area Network SD-WAN Market Size and Share Forecast Outlook 2025 to 2035
Software Defined Radio (SDR) Market Size and Share Forecast Outlook 2025 to 2035
Software License Management (SLM) Market Size and Share Forecast Outlook 2025 to 2035
Software-Defined Networking SDN Market Size and Share Forecast Outlook 2025 to 2035
Software-Defined Anything (SDx) Market Size and Share Forecast Outlook 2025 to 2035
Software-Defined Data Center Market Size and Share Forecast Outlook 2025 to 2035
Software Containers Market Size and Share Forecast Outlook 2025 to 2035
Software Defined Application And Infrastructure Market Size and Share Forecast Outlook 2025 to 2035
Software Defined Networking Market Size and Share Forecast Outlook 2025 to 2035
Software-Defined Camera (SDC) Market Size and Share Forecast Outlook 2025 to 2035
Examining Market Share Trends in the Software Distribution Industry
Software Distribution Market Analysis by Deployment Type, by Organization Size and by Industry Vertical Through 2035
Software Defined Video Networking Market
UK Software Distribution Market Analysis – Size & Industry Trends 2025-2035
MES Software For Discrete Manufacturing Market Size and Share Forecast Outlook 2025 to 2035
RIP Software Market Size and Share Forecast Outlook 2025 to 2035

Thank you!
You will receive an email from our Business Development Manager. Please be sure to check your SPAM/JUNK folder too.
Chat With
MaRIA