

- Market Size (2026)
- USD 1.7 Bn
- Forecast (2036)
- USD 6.2 Bn
- CAGR (2026 to 2036)
- 13.6%
How big is AI-based Food Quality Inspection System Market in 2026?
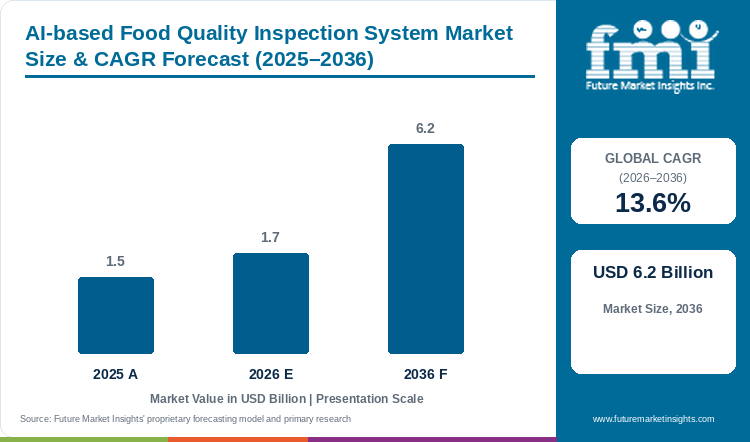
At USD 1.51 billion in 2025, the AI-based food quality inspection system market moves to USD 1.72 billion in 2026 and USD 6.16 billion by 2036. Revenue will compound at a 13.6% CAGR between 2026 and 2036, as processors replace rule-based cameras and manual pick tables with trained inspection models.
Demand for AI-based food quality inspection systems is rising as one missed foreign body can cost more than a full inspection upgrade. In March 2026, Ajinomoto Foods North America expanded a recall to 36,987,575 pounds of frozen fried rice, ramen and dumplings after consumers found glass, with carrots named as the likely source [1]. Labour is also tight, with half of Japanese firms across all industries short of full-time staff in April 2026 [2]. Due to this, processors are handing reject decisions to trained models, and TOMRA had sold more than 3,500 LUCAi deep learning lanes by 2025 [3]. FMI finds that orders for food sorting machines with built-in deep learning will replace much of the older rule-based fleet before 2036.
Key Market Trends & Insights
- By technology, machine vision with deep learning leads with 41.5% in 2026, as trained camera models are the simplest AI upgrade on existing belts and chutes.
- By application, sorting and grading accounts for 36% of sales in 2026, and Key Technology launched ADR X automatic defect removal for wet potato strips in February 2026 [4].
- By end use, fruits and vegetables stay in front at 28.5% in 2026, as each harvest brings bruising, colour and size changes that fixed rules miss.
- By component, hardware takes 54% of value in 2026, and software licences are gaining ground across X-ray lines. METTLER TOLEDO offers AI reject reduction across the X-ray range, including the X56 DXD+ launched in July 2026 [5].
Regional Highlights
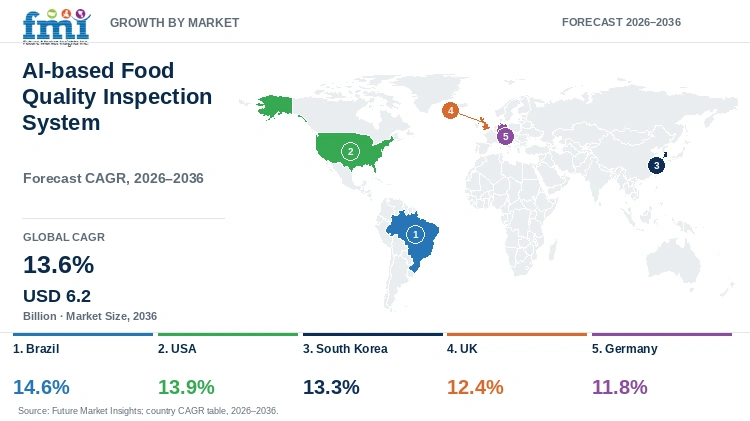
- Fastest-growing profiled country: Brazil, posting a 14.6% CAGR over 2026 to 2036 against the 13.6% global rate.
- By country: next come the USA at 13.9% and South Korea at 13.3%, with Germany lowest among profiled markets at 11.8% through 2036.
- Foreign buyer audits drive Brazil's lead, as the country exported a record 5.324 million tonnes of chicken in 2025, with Saudi Arabia and the UAE among the largest buyers [6].
Market Size & Forecast
Table 1: Market Size and Forecast for the AI-based Food Quality Inspection System Market (USD billion and percentage), 2025 to 2036
| Metric | Value |
|---|---|
| 2025 Market Size | USD 1.51 billion |
| Estimated Market Size in 2026 | USD 1.72 billion |
| Projected Market Size by 2036 | USD 6.16 billion |
| CAGR, 2026 to 2036 | 13.6% |
| Added Revenue, 2026 to 2036 | USD 4.44 billion |
| Market Expansion Multiple | 3.6x |
Sales of AI-based food quality inspection systems are led by upgrades on optical sorters and X-ray lines plants already own. Processors want fewer recalls and fewer manual pick tables without rebuilding a whole line. TOMRA's food unit took EUR 356 million of orders in 2025, up 12%, and closed the year with a EUR 136 million backlog [3]. Plants keeping lot records under the FDA traceability rule, with compliance proposed for July 20, 2028, are linking reject images to food traceability systems [7]. However, TOMRA's food order intake fell 22% to EUR 83 million over April to June 2026, as large packhouse projects moved slowly to firm orders [8]. Small upgrades are expected to carry volumes until capital budgets for full new lines recover.
Recall Exposure and Supplier Order Benchmarks
Demand for AI food inspection grows with the cost of a single missed defect. Unsafe food makes about 866 million people ill and kills about 1.52 million every year, with productivity and medical losses near USD 310 billion [9]. Owing to this, processors now treat food safety as a board-level business risk. U.S. contamination recalls reached 154 in 2024 against 87 in 2023, and the BrucePac recall alone covered more than 11.7 million pounds of ready-to-eat meat and poultry [10]. The Boar's Head Listeria outbreak left 61 people ill, 60 in hospital and 10 dead across 19 states [11]. U.S. food manufacturing employed 1,768.2 thousand workers in September 2026 [12]. Plants of this size need inspection capacity that grows without adding staff to every shift. The UK Food Standards Agency handled 2,073 food and feed incidents in 2025/26, 14% more than a year earlier [13]. Germany's federal portal listed 323 warnings in 2025, 291 of them for food, with Listeria the top cause at 43 [14]. South Korea's science and food safety ministries tested AI tools for imported food checks in May 2026 [15]. FMI notes that protein and ready-meal plants carry the highest recall exposure and will buy fastest, keeping inspection data as compliance records alongside reject counts.
Key trends in the AI-based food quality inspection system market point to trained models built into the machines themselves. In May 2025, Bühler launched the SORTEX AI700, a deep learning sorter trained on millions of labelled images [16]. Bühler's field analysis showed reject concentration improving by 5% to 10% [16]. Buyers get AI built in, with no separate software project added later. Orders ran ahead of shipments at TOMRA Food in 2025, as revenue rose 5% to EUR 328 million and order intake rose 12% to EUR 356 million [3]. The unit closed the year with a EUR 136 million backlog, up 26% [3]. First-half 2026 revenue grew 8% to EUR 178 million despite weaker North American sales, with full-year guidance of EUR 340 million to EUR 360 million [8]. Across all units, TOMRA reported 2025 group revenue of EUR 1,318 million [17]. Anritsu's quality assurance unit grew first-half revenue 12% to JPY 14.5 billion at a 10% operating margin [18]. The unit forecast JPY 30.0 billion for the full year, up from JPY 28.2 billion [18]. Cognex grew 2025 revenue 9% to USD 994.4 million [19]. Order intake at Bühler's broader Grains and Food business slipped 1.1% to CHF 2,147 million over the same year [20]. Small retrofits will carry volumes through 2027, and retraining will become a new revenue line as AI turns standard on new lines.
Table 2: Recall Exposure and Line Readiness Indicators for the AI-based Food Quality Inspection System Market (people, recall pounds and counts, workers, staffing shares, incidents, revenue and installed lanes), mixed reporting years from 2024 to 2026
| Indicator | Data Point | Why This Matters | Source |
|---|---|---|---|
| Foodborne illness burden, WHO | 866 million ill and 1.52 million deaths a year, USD 310 billion in losses | Inspection upgrades cut the cost of foodborne illness. | [9] |
| Ajinomoto Foods North America recall | 36,987,575 pounds, March 2026 | Processors order foreign-body checks to avoid recalls of this size. | [1] |
| U.S. contamination recalls | 154 in 2024 against 87 in 2023 | Company boards fund inline inspection as recall counts rise. | [10] |
| U.S. food manufacturing employment | 1,768.2 thousand workers, September 2026 (preliminary) | Automated checks let plants inspect more product without adding staff. | [12] |
| Japanese firms short of full-time staff | 50.6% of firms, April 2026 | Processors replace manual pick tables with automated rejection. | [2] |
| FDA Food Traceability Rule | Compliance date proposed for July 20, 2028 | Plants link inspection images to lot records. | [7] |
| UK food and feed incidents | 2,073 in 2025/26, up 14% | Retailers ask suppliers for more inspection records. | [13] |
| Germany food warnings | 323 notices in 2025, 291 for food, Listeria top cause at 43 | Recall publicity raises pressure on processors. | [14] |
| TOMRA Food results, 2025 | Revenue EUR 328 million, orders EUR 356 million, backlog EUR 136 million | Sorter orders run ahead of sales. | [3] |
| TOMRA LUCAi deep learning lanes | More than 3,500 sold by 2025 | Packers buy AI grading as a proven option on packing lines. | [3] |
Table 3: Supplier Revenue and Order Benchmarks for the AI-based Food Quality Inspection System Market (mixed currencies), 2025-2026, mixed periods
| Indicator | Reported value | Change or ratio | Source |
|---|---|---|---|
| AI-based food quality inspection system market, 2025 to 2026 | USD 1.51 billion to USD 1.72 billion | +13.9% | Future Market Insights |
| TOMRA Food revenue, 2025 | EUR 328 million | +5% | [3] |
| TOMRA Food order intake, 2025 | EUR 356 million | +12% | [3] |
| TOMRA Food backlog, end-2025 | EUR 136 million | +26% | [3] |
| TOMRA Food revenue, H1 2026 | EUR 178 million | +8% | [8] |
| TOMRA Food guidance, 2026 | EUR 340 million to EUR 360 million | Full-year range | [8] |
| Anritsu quality assurance unit, H1 FY2025 | JPY 14.5 billion | +12%, 10% operating margin | [18] |
| Anritsu quality assurance unit, FY2025 forecast | JPY 30.0 billion | Up from JPY 28.2 billion in FY2024 | [18] |
| Cognex revenue, 2025 | USD 994.4 million | +9% | [19] |
| Bühler Grains and Food order intake, 2025 | CHF 2,147 million | -1.1% | [20] |
Analyst Perspective
“Food plants will keep buying AI inspection that removes bad product without throwing away good product. Suppliers publishing false reject rates from real production runs and retraining models quickly for each new crop will take the larger share of line upgrades through 2036.”
- Nandini Roy Choudhury, Principal Consultant, Future Market Insights.
How is the AI-based food quality inspection system market segmented?
The AI-based food quality inspection system market is segmented by technology, application, end use, component and region. Machine vision with deep learning leads technology at 41.5% in 2026. Sorting and grading takes 36% of application revenue, fruits and vegetables hold 28.5% of end use, and hardware carries 54% of component value.
By technology: machine vision with deep learning, AI-enabled X-ray inspection, hyperspectral and multispectral imaging, near-infrared spectroscopy, and laser and fluorescence sensing.
By application: sorting and grading, foreign object detection, surface defect and contamination detection, packaging and label inspection, and fill level and seal integrity.
By end use: fruits and vegetables, meat, poultry and seafood, packaged and processed foods, nuts, grains and seeds, bakery and confectionery, and dairy.
By component: hardware, software and AI platforms, and services.
By region: North America, Latin America, Western Europe, Eastern Europe, East Asia, South Asia and Pacific, and Middle East and Africa.
Why is machine vision with deep learning the first choice by technology?
Machine vision with deep learning is projected to hold 41.5% of technology revenue in 2026, as trained models run on cameras already installed in plants.
Table 4: Technology Share for the AI-based Food Quality Inspection System Market (percentage share), 2026
| Technology | Share (2026) |
|---|---|
| Machine Vision with Deep Learning | 41.5% |
| Other Segments Combined | 58.5% |
| Total | 100% |
Table 5: Technology Leadership and Market Growth for the AI-based Food Quality Inspection System Market (segment and CAGR percentage), 2026 to 2036
| Metric | Value |
|---|---|
| Global CAGR (2026 to 2036) | 13.6% |
| Leading Segment | Machine Vision with Deep Learning |
According to FMI, machine vision with deep learning leads the technology category with a 41.5% revenue share in 2026. Sales of deep learning camera systems are rising as packers add trained models to existing sorters and see results within one season. In September 2025, TOMRA launched TOMRA 4C, an AI sorter for nuts and frozen vegetables stated to keep false rejects below 1% [3]. AI-enabled X-ray inspection ranks next and is gaining ground in packed goods. Hyperspectral, near-infrared and fluorescence sensing stay smaller, serving as tools for defects inside the product. Camera-based models are expected to stay the largest technology through 2036, as each installed lane lowers retraining cost.
- Machine vision with deep learning accounts for 41.5% in 2026, supported by upgrades on installed optical sorters.
- Buyers compare false reject rates measured on in-house product samples before approving a camera model upgrade.
What makes sorting and grading the main application?
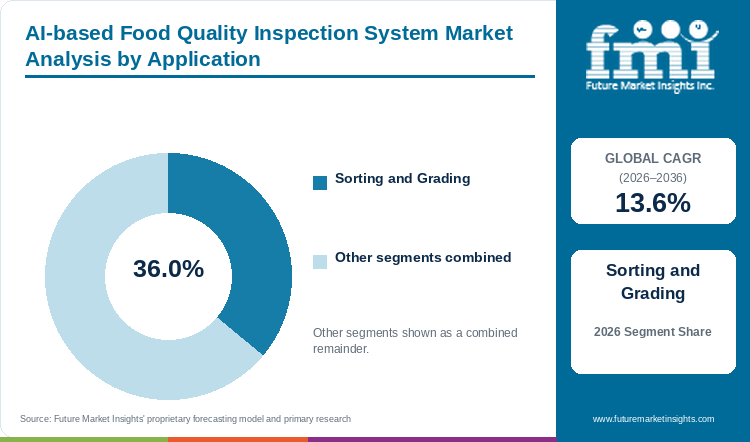
Sorting and grading is estimated to capture 36% of application revenue in 2026, driven by packhouses cutting out only the faulty part of each piece.
As per FMI, sorting and grading is the largest application, holding 36% of 2026 revenue, as packers lose money on every good piece sent to the reject stream. In February 2026, Key Technology reported that Bem Brasil, processing about 500,000 metric tons a year, had added an integrated Key line [4]. Plants buying new sorting and grading machines now expect deep learning as a standard option. Foreign object detection, surface defect, label and seal checks serve narrower inspection points and hold smaller shares. Foreign object detection is expected to gain share in protein and packed goods, and sorting and grading will keep more than a third of application revenue through 2036.
- Defect removal that trims only the faulty section of each piece brings sorting and grading to a 36% share in 2026.
- Potato and vegetable processors gain most from one line handling grading and defect removal, and Bem Brasil added an integrated Key line [4].
Why do fruits and vegetables top the end use category?
Fruits and vegetables are set to take 28.5% of end use revenue in 2026, owing to changes in produce quality from one harvest to the next.
FMI estimates that fruits and vegetables top the end use category with 28.5% of revenue in 2026, as fixed rules miss new bruising, colour and size patterns in each harvest. In March 2026, Key Technology introduced COMPASS for fresh and IQF corn, peas and green beans to remove foreign material and defects [4]. Meat, poultry and seafood plants form the second largest group at 23%, often pairing X-ray bone checks with new meat processing equipment. Packaged foods, nuts and grains, bakery and dairy follow with smaller shares of end use revenue. Produce lines will likely stay in front, and protein plants will narrow the gap as recall costs rise.
- Fruits and vegetables hold 28.5% in 2026, and protein plants are expected to narrow the gap as recall costs rise.
- Produce packers check that a supplier can retrain models quickly when a new variety or growing region enters the line.
Why does hardware still carry most component value?
Hardware is expected to account for 54% of component value in 2026, as every trained model still runs on cameras, X-ray sources and reject valves.
FMI data shows hardware carrying 54% of component value in 2026, as a trained model cannot work without cameras, detectors and fast reject valves. In July 2026, METTLER TOLEDO said the AI function for cutting unnecessary rejects is also available on other X-ray systems in the range [5]. Buyers of food processing equipment increasingly pay a licence for AI models on each line, raising the software share of each order. Software and services are expected to grow faster than hardware, taking hardware below half of component value by the mid-2030s.
- Hardware accounts for 54% in 2026, as cameras, X-ray detectors and reject systems are needed on every line.
- Software licences and model updates now add to each order, so plants budget for both alongside sensors when comparing quotes.
What are the drivers, restraints, and opportunities in the AI-based food quality inspection system market?
Key drivers of the AI-based food quality inspection system market include recall costs and short quality crews. Slow approval of large capital projects holds back full-line sales, and AI upgrades for installed sorters and X-ray machines open the largest new revenue pool.
- Driver: Adoption of AI-based food quality inspection systems is rising as processors need to catch more contaminants and defects with fewer quality staff per shift.
- Restraint: Key challenges include high upfront costs and slow approval of large capital projects, and each model needs testing on the plant's own product before sign-off.
- Opportunity: Revenue from AI-based food quality inspection systems will grow through retrofits, as a large base of installed sorters and X-ray machines can take a trained model.
Recall Costs Push Inline Checks
Contamination recalls are growing in number and size, and one missed foreign body can cost more than a full inspection upgrade. U.S. contamination recalls reached 154 in 2024, up from 87 in 2023, and the BrucePac recall alone covered more than 11.7 million pounds of ready-to-eat meat and poultry [10]. Quality managers now want X-ray and vision checks rejecting a faulty item before the case is sealed. Labour gaps add pressure, as plants struggle to staff manual pick tables. Orders for AI food safety tools are expected to rise fastest in protein and ready-meal plants with the highest recall exposure.
Large Project Approvals Slow Down
Large inspection projects need capital approval, line trials and model validation before a plant signs an order. TOMRA reported a 22% fall in food order intake to EUR 83 million over April to June 2026, as big packhouse projects moved slowly to firm orders [8]. Each model also needs testing on the plant's own product, adding time to every project. Tight capital budgets may hold back full-line sales until processors see payback from smaller upgrades.
Upgrades Reach Installed Lines
Most plants already run optical sorters, metal detectors or X-ray machines able to take a trained model. In July 2026, METTLER TOLEDO made the AI reject-reduction function available on other X-ray systems as well as the new X56 DXD+ [5]. Sesotec also promotes AI foreign body detection across a metal detection and X-ray range [21]. Upgrades cost less than new lines and fit the budgets of mid-sized plants. Adoption of AI in food quality control will spread through these upgrades, giving suppliers steady revenue from model updates, retraining and service contracts through 2036.
Which country CAGRs are profiled in the AI-based food quality inspection system market?
In FMI's assessment, Brazil heads the group of five profiled countries with a 14.6% CAGR over 2026 to 2036, and Germany is slowest at 11.8% through 2036. Sales in each country follow the pressure local buyers and regulators put on processors. Export audits push Brazilian poultry and fruit plants, and recall costs keep U.S. processors ordering. In South Korea, state smart factory money carries much of the spending. British buyers are mostly small firms watching budgets, and German plants respond to recall notices on the federal warning portal.
Table 6: Country CAGRs and Primary Growth Levers for the AI-based Food Quality Inspection System Market (CAGR percentage), 2026 to 2036
| Country | CAGR (2026-2036) | Primary Growth Lever |
|---|---|---|
| Brazil | 14.6% | Export audits in poultry and fruit packing |
| USA | 13.9% | Protection against large foreign-body recalls |
| South Korea | 13.3% | State-funded smart factory projects |
| UK | 12.4% | Low-cost upgrades for small food firms |
| Germany | 11.8% | AI retrofits on existing X-ray and vision lines |
Source: Future Market Insights
Brazil AI-based Food Quality Inspection System Market Outlook (2026-2036)
Brazilian poultry plants shipped a record 5.324 million tonnes of chicken abroad in 2025, with Saudi Arabia and the UAE among the largest buyers [6]. Foreign buyers audit these plants, so processors are replacing hand checks with cameras and X-ray machines logging every reject. Sales of AI-based food quality inspection systems in Brazil will expand at a 14.6% CAGR over 2026 to 2036, ahead of every other profiled country. Equipment budgets are tight, however, as chicken export revenue slipped 1.4% to USD 9.79 billion in 2025 even as volume rose [6]. Fruit packers offer the next opening, after Brazilian fruit export earnings hit a record USD 1.45 billion in 2025 with volume up 19.6% [22].
Key takeaway: Export plants facing foreign buyer audits will place most of Brazil's orders through 2036.
USA AI-based Food Quality Inspection System Market Outlook (2026-2036)
The USA market for AI-based food quality inspection systems carries a 13.9% CAGR through 2036, second in the group and above the 13.6% global rate. Demand for inline foreign-body checks is rising after Ajinomoto Foods North America widened a glass recall to 36,987,575 pounds of frozen fried rice, ramen and dumplings in March 2026 [1]. Large orders are less certain, as TOMRA warned that tariffs could hurt customer investment [8]. TOMRA's North American food revenue fell to EUR 28 million over April to June 2026 from EUR 38 million a year earlier [8]. The FDA traceability rule, with compliance proposed for July 20, 2028, gives plants a reason to store reject images as lot records [7].
Key takeaway: Recall risk keeps American processors buying, even as tariffs delay some large lines.
South Korea AI-based Food Quality Inspection System Market Outlook (2026-2036)
South Korea's SME, agriculture and food safety ministries launched the K-Food Smart Manufacturing Alliance with CJ CheilJedang and other food makers in June 2026 [23]. The alliance aims to build an AI-based model for production, quality and hygiene control [23]. Public money is also reaching smaller plants, as the Korea Agro-Fisheries and Food Trade Corporation offers up to KRW 200 million per company in 2026 [24]. The 2026 scheme covers about 10 smart factory projects across Korean food makers [24]. The science and food safety ministries tested AI tools for imported food checks under a KRW 2.55 billion project in May 2026 [15]. Adoption of AI food inspection in South Korea will advance at a 13.3% CAGR through 2036, a little under the global 13.6%. Each firm matches the subsidy one to one, which limits spending among small food makers [24].
Key takeaway: Government smart factory money offers Korean food makers the quickest route to AI inspection.
UK AI-based Food Quality Inspection System Market Outlook (2026-2036)
Small firms make up about 98% of the roughly 12,000 UK food and drink businesses, and few can fund a full new inspection line [25]. Demand for AI inspection across UK plants will rise at a 12.4% CAGR through 2036, as the Food Standards Agency handled 2,073 incidents in 2025/26, up 14% [13]. The Food and Drink Federation reports that each pound invested in the sector returns £9 in value, against £5 in other manufacturing [25]. Due to this, camera and software upgrades on existing lines are easier to approve in British plants.
Key takeaway: Affordable retrofits matter more than new lines for Britain's mostly small food firms.
Germany AI-based Food Quality Inspection System Market Outlook (2026-2036)
German food makers sold EUR 240.8 billion of goods in 2025, but sales showed no real growth after inflation and domestic sales fell 1.3% in real terms [26]. Flat sales and a large installed base of X-ray, metal detection and vision machines give Germany the lowest CAGR in the group, at 11.8% through 2036. Recalls stay in public view, as the federal warning portal listed 323 notices in 2025, 291 of them for food, with Listeria the most common cause [14]. Exports rose to 37.5% of German food industry sales in 2025 [26]. Exporting processors will add AI functions to installed machines, often from local suppliers such as Sesotec [21].
Key takeaway: German growth will come from AI upgrades on machines already running on the line.
Who are the notable companies in the AI-based food quality inspection system market?
TOMRA, Key Technology, Bühler, METTLER TOLEDO, Anritsu, Ishida, Sesotec, Cognex and JBT Marel are the key companies profiled in this market.
FMI observes that competition in AI food inspection splits between sorter makers rooted in produce and grain lines and inspection specialists rooted in packed goods. TOMRA, Key Technology and Bühler sell deep learning sorters, and METTLER TOLEDO, Anritsu, Ishida and Sesotec add AI to X-ray, metal detection and checkweighing. Cognex supplies machine vision platforms, and JBT Marel builds inspection into complete processing lines. Plant buyers now compare suppliers on false reject rates, retraining speed and service reach.
- Optical sorting and grading: TOMRA, Key Technology and Bühler sell deep learning sorters for produce, potato, nut and grain lines.
- Packaged-product inspection: METTLER TOLEDO, Anritsu, Ishida and Sesotec are adding AI to X-ray, metal detection and checkweighing.
- Vision and line integration: Cognex supplies vision platforms, and JBT Marel builds inspection into complete processing lines.
Competitive Benchmarking: AI-based Food Quality Inspection System Market
Table 7: Competitive Benchmarking for the AI-based Food Quality Inspection System Market (qualitative capability ratings), 2026
| Company | AI Models | Sensor Range | Line Service | Reach |
|---|---|---|---|---|
| TOMRA | High | High | High | High |
| Key Technology | Medium | High | High | Medium |
| Bühler | High | Medium | High | High |
| METTLER TOLEDO | Medium | High | High | High |
| Anritsu | Medium | High | Medium | Medium |
| Ishida | Medium | High | High | Medium |
| Sesotec | Medium | Medium | Medium | Medium |
| Cognex | High | Medium | Medium | High |
| JBT Marel | Low | Medium | High | High |
High means broad documented capability in food inspection, Medium means narrower or partial capability, and Low marks limited public documentation. Ratings draw on product and company records up to October 2026 and apply one scale to every profiled supplier.
Key Developments in the AI-based Food Quality Inspection System Market
- In October 2026, Key Technology added advanced backlight technology and three-way sorting to the belt-fed COMPASS optical sorter [4].
- In July 2026, METTLER TOLEDO introduced the X56 DXD+ dual energy photon-counting X-ray system, with an AI function cutting unnecessary rejects at up to 500 products per minute [5].
- In September 2025, TOMRA launched TOMRA 4C, an AI-powered sorter for nuts and frozen vegetables built on LUCAi deep learning [3].
- In May 2025, Bühler launched the SORTEX AI700, the group's first deep learning optical sorter, with gluten grain removal in oats as the first application [16].
Key Players in the AI-based Food Quality Inspection System Market
Optical Sorting and Grading
- TOMRA Systems ASA
- Key Technology, Inc.
- Bühler Group
Packaged-Product Inspection
- Mettler-Toledo International Inc.
- Anritsu Corporation
- Ishida Co., Ltd.
- Sesotec GmbH
Vision and Line Integration
- Cognex Corporation
- JBT Marel Corporation
AI-based Food Quality Inspection System Market - Report Scope
Table 8: Report Scope for the AI-based Food Quality Inspection System Market (coverage fields and definitions), 2026 to 2036
| Coverage field | Report scope |
|---|---|
| Market breakdown | Technology; application; end use; component; region |
| Quantitative units | USD billion |
| Market definition | Revenue from food processing and packing inspection systems applying trained AI or deep learning models to camera, X-ray, spectral or other sensor data. Coverage includes detecting, grading or rejecting food items, plus related software licences and services. Conventional inspection equipment without AI functions and laboratory testing services are excluded. |
| Regions covered | North America; Latin America; Western Europe; Eastern Europe; East Asia; South Asia and Pacific; Middle East and Africa |
| Countries covered | Brazil; USA; South Korea; UK; Germany |
| Key companies profiled | TOMRA, Key Technology, Bühler, METTLER TOLEDO, Anritsu, Ishida, Sesotec, Cognex, JBT Marel |
| Forecast period | 2026 to 2036 |
| Approach | Combined bottom-up and top-down sizing matches supplier inspection revenue with installed sorting and X-ray lines and the share of new lines sold with AI. Food processing output and recall and labour data by country complete the model. |
AI-based Food Quality Inspection System Market - Research Methodology
Table 9: Research Methodology for the AI-based Food Quality Inspection System Market (research methods and approach), 2026 edition
| Method | Approach |
|---|---|
| Primary Research | Interviews were held with inspection equipment makers, vision software suppliers, system integrators, plant quality managers and food safety auditors. Topics included purchase triggers, false reject targets, model validation and pricing. |
| Desk Research | Sources include supplier annual and quarterly reports, product releases, regulator recall and incident records, labour statistics and food industry association publications. |
| Market Sizing and Forecasting | Installed sorting and X-ray lines, new line additions and the share of lines sold with AI are assessed by technology, application and end use. Software and service revenue and country processing output are added to the estimate. |
| Data Validation | Estimates are cross-checked against supplier segment revenue, order trends and country statistics. Conventional inspection equipment without AI and laboratory testing are kept out to avoid double counting. |
AI-based Food Quality Inspection System Market by Segments
AI-based Food Quality Inspection System Market segmented by Technology:
- Machine Vision with Deep Learning
- AI-enabled X-ray Inspection
- Hyperspectral and Multispectral Imaging
- Near-Infrared Spectroscopy
- Laser and Fluorescence Sensing
AI-based Food Quality Inspection System Market segmented by Application:
- Sorting and Grading
- Foreign Object Detection
- Surface Defect and Contamination Detection
- Packaging and Label Inspection
- Fill Level and Seal Integrity
AI-based Food Quality Inspection System Market segmented by End Use:
- Fruits and Vegetables
- Meat, Poultry and Seafood
- Packaged and Processed Foods
- Nuts, Grains and Seeds
- Bakery and Confectionery
- Dairy
AI-based Food Quality Inspection System Market segmented by Component:
- Hardware
- Software and AI Platforms
- Services
AI-based Food Quality Inspection System Market by Region
- North America
- United States
- Canada
- Latin America
- Brazil
- Mexico
- Argentina
- Chile
- Western Europe
- Germany
- France
- United Kingdom
- Italy
- Spain
- Benelux
- Nordics
- Eastern Europe
- Poland
- Czech Republic
- Romania
- Hungary
- East Asia
- Japan
- South Korea
- South Asia and Pacific
- ASEAN
- Australia and New Zealand
- Middle East and Africa
- GCC Countries
- South Africa
- Türkiye
- Israel
Research Sources and Bibliography
- [1] FOX 5 New York. (2026, March 3). Millions of pounds of frozen food products recalled due to possible glass contamination.https://www.fox5ny.com/news/millions-pounds-frozen-food-products-recalled-due-possible-glass-contamination
- [2] TechNews (reporting Teikoku Databank survey). (2026, May 20). Half of Japanese firms face shortage of full-time workers in April.https://cdn.technews.tw/2026/05/20/half-of-japanese-firms-face-shortage-of-full-time-workers/
- [3] TOMRA Systems ASA. (2026). TOMRA Annual Report 2025.https://www.tomra.com/-/media/project/tomra/tomra/investor-relations/annual-reports/2025/tomra-annual-report-2025.pdf
- [4] Key Technology, Inc. (2026, October). News (COMPASS, ADR X and Bem Brasil releases, 2025-2026).https://www.key.net/en/about-us/news
- [5] Food Online (METTLER TOLEDO press release). (2026, July 16). Mettler-Toledo Introduces X56 DXD+ Dual Energy Photon-Counting X-Ray System With AI Capabilities.https://www.foodonline.com/doc/mettler-toledo-introduces-x-dxd-dual-energy-photon-counting-x-ray-system-with-ai-capabilities-0001
- [6] The Poultry Site. (2026, January 7). Brazil chicken exports hit record in 2025 - ABPA.https://www.thepoultrysite.com/news/2026/01/brazil-chicken-exports-hit-record-in-2025-abpa
- [7] U.S. Food and Drug Administration. (2025, August 7). FSMA Final Rule on Requirements for Additional Traceability Records for Certain Foods.https://fda.gov/food/food-safety-modernization-act-fsma/fsma-final-rule-requirements-additional-traceability-records-certain-foods
- [8] TOMRA Systems ASA. (2026, July 17). TOMRA Second Quarter 2026 Report.https://www.tomra.com/-/media/project/tomra/tomra/investor-relations/quarterly-results-files/2026/2q/2026-q2_quarterly-report_tomra.pdf
- [9] World Health Organization. (2026, June 4). Food safety (fact sheet).https://www.who.int/news-room/fact-sheets/detail/food-safety
- [10] Pork Business (Farm Journal). (2025, January 3). Food Recalls Reached Five-Year High in 2024.https://www.porkbusiness.com/news/industry/food-recalls-reached-five-year-high-2024
- [11] U.S. Centers for Disease Control and Prevention. (2024). Listeria Outbreak Linked to Meats Sliced at Delis.https://www.cdc.gov/listeria/outbreaks/delimeats-7-24/index.html
- [12] U.S. Bureau of Labor Statistics. (2026, October). Industries at a Glance, Food Manufacturing (NAICS 311).https://www.bls.gov/iag/tgs/iag311.htm
- [13] Food Standards Agency. (2026, June 2). Incidents and Resilience Annual Report 2025/26 (FSA 26/06/07).https://www.food.gov.uk/board-papers/incidents-resilience-annual-report-202526
- [14] Bundesamt für Verbraucherschutz und Lebensmittelsicherheit (via idw). (2026, February 12). Lebensmittelwarnungen 2025, annual recall statistics.https://idw-online.de/de/news865934
- [15] Digital Today. (2026, May 27). MSIT and MFDS demonstrate AI imported food inspection solution.https://www.digitaltoday.co.kr/vn/view/70852/msit-mfds-demo-ai-imported-food-inspection-solution-speed-public-ax
- [16] Bühler Group. (2025, May 15). Deep learning powers Bühler's new SORTEX AI700.https://www.buhlergroup.com/global/en/media/media-releases/sortex-ai700.html
- [17] TOMRA Systems ASA. (2026, February 13). TOMRA: Strong finish to 2025 with record quarter in Collection and solid quarter in Recycling and Food.https://news.cision.com/tomra-systems-asa/r/tomra-strong-finish-to-2025-with-record-quarter-in-collection-and-solid-quarter-in-recycling-and-foo,c4307254
- [18] Anritsu Corporation. (2025, October 30). Financial Results for the Second Quarter of the Fiscal Year Ending March 31, 2026.https://dl.cdn-anritsu.com/en-en/about-anritsu/ir/financial-materials/fy2025/251030-03e.pdf
- [19] Cognex Corporation. (2026, February 11). Cognex Reports Fourth Quarter 2025 Results.https://s2.q4cdn.com/773500753/files/doc_earnings/2025/q4/earnings-result/cognex-press-release-q4-25.pdf
- [20] Bühler Management AG. (2026, February 16). Bühler strengthens its market position.https://webdisclosure.com/press-release/buhler-management-ag-etr-buhler-strengthens-its-market-position-6dRD9oIe2lZ
- [21] Sesotec GmbH. (2026, October (accessed)). Sesotec home page, food inspection and AI.https://www.sesotec.com/en
- [22] FreshPlaza (reporting Abrafrutas data). (2026, January 14). Brazilian fruit exports reach US$1.45 billion in 2025.https://www.freshplaza.com/europe/article/9801163/brazilian-fruit-exports-reach-us-1-45-billion-in-2025/
- [23] Wowtale. (2026, June 11). South Korea Launches K-Food Smart Manufacturing Alliance to Drive AI-Powered Global Competitiveness.https://en.wowtale.net/2026/06/11/234229/
- [24] Asia Economy. (2026, February 9). aT Invites Companies to Join K-Food Smart Factory Construction Project, Up to 200 Million Won Per Company.https://view.asiae.co.kr/en/article/2026020915113981790
- [25] Food and Drink Federation with Newton. (2025, November). Future Factory II, From Insight to Implementation.https://www.fdf.org.uk/globalassets/our-focus/powering-productivity/fdf-task-force-ii-nov-25.pdf
- [26] LebensmittelPraxis (reporting BVE and ANG data). (2026, July 9). Bilanz für 2025: Deutsche Ernährungsindustrie ohne reales Wachstum.https://lebensmittelpraxis.de/industrie-aktuell/49257-bilanz-fuer-2025-deutsche-ernaehrungsindustrie-ohne-reales-wachstum.html
- [27] Ishida Europe. (2026, October (accessed)). Ishida Europe home page, inspection systems.https://www.ishidaeurope.com/
Readers can use this bibliography as a guide to the main sources behind the analysis. The full report carries every reference with detailed citations.
This Report Answers
- What value does the AI-based food quality inspection system market hold in 2026?
- What value will AI-based food quality inspection systems reach by 2036, and at what CAGR?
- Which technology holds the largest share of AI food inspection revenue?
- Why do sorting and grading lines and fruit and vegetable packers buy the most AI inspection systems?
- Which profiled countries record the fastest growth, and what drives them?
- Who are the leading sorting, X-ray and vision suppliers in the market?
Frequently Asked Questions
How large is the AI-based food quality inspection system market expected in 2026?
FMI estimates the market at USD 1.72 billion in 2026, up from USD 1.51 billion in 2025. Sales will reach USD 6.16 billion by 2036 as processors add trained models to sorting and X-ray lines.
What CAGR is projected for the AI-based food quality inspection system market through 2036?
The market will expand at a 13.6% CAGR from 2026 to 2036, according to FMI. Recall costs, thin quality crews and traceability record-keeping will remain the main reasons for this growth.
Which technology holds a notable market share in 2026?
Machine vision with deep learning will hold 41.5% of technology revenue in 2026. Plants will keep adding trained camera models to installed sorters and seeing results within one season.
Which application leads AI food inspection purchases in 2026?
Sorting and grading will account for 36% of application revenue in 2026. Packhouses will lose less good product as models cut out only the faulty part.
Which country has a notable expansion outlook through 2036?
Brazil will grow at a 14.6% CAGR from 2026 to 2036, the fastest of the five profiled countries. Export plants facing foreign buyer audits will keep adding cameras and X-ray machines logging every reject.
Who are the key companies in the AI-based food quality inspection system market?
Key companies include TOMRA, Key Technology, Bühler, METTLER TOLEDO, Anritsu, Ishida, Sesotec, Cognex and JBT Marel. Rivalry among this group will turn on false reject rates, sensor range, line integration and service reach.
Preview the report firsthand - request a free sample
Get SampleGet the brochure for pricing and purchase details.
Get PDFTable of Content
- Key Takeaways
- Market Size and CAGR
- Top Growth Driver
- Fastest Growing Segment
- Leading Region
- Key Companies
- Emerging Opportunities
- Executive Summary
- Global Market Outlook
- Demand-side Trends
- Supply-side Trends
- Technology Roadmap Analysis
- Analysis and Recommendations
- Analyst Perspective (What is happening? Why now? What should investors know?)
- Key Questions Answered
- How large is the market?
- What is the CAGR?
- What are key trends?
- Which region dominates?
- Who are the leaders?
- Market Overview
- Market Coverage / Taxonomy
- Market Definition / Scope / Limitations
- Research Methodology
- Chapter Orientation
- Analytical Lens and Working Hypotheses
- Market Structure, Signals, and Trend Drivers
- Benchmarking and Cross-market Comparability
- Market Sizing, Forecasting, and Opportunity Mapping
- Research Design and Evidence Framework
- Desk Research Programme (Secondary Evidence)
- Expert Input and Fieldwork (Primary Evidence)
- Tooling, Models, and Reference Databases
- Data Engineering and Model Build
- Quality Assurance and Audit Trail
- Market Background
- Market Dynamics (Drivers, Restraints, Opportunity, Trends)
- Scenario Forecast (Optimistic, Likely, Conservative)
- Impact Analysis
- AI Impact
- Sustainability Impact
- Regulatory Impact
- Technology Impact
- Consumer / Buyer Analysis
- Purchase Drivers
- Adoption Barriers
- Buyer Journey
- Opportunity Map Analysis
- Product Life Cycle Analysis
- Supply Chain Analysis
- Investment Feasibility Matrix
- Value Chain Analysis
- PESTLE and Porter's Analysis
- Regulatory Landscape
- Regional Parent Market Outlook
- Production and Consumption Statistics
- Import and Export Statistics
- Global Market Analysis and Forecast, 2021 to 2036
- Historical Market Size Value (USD Billion) Analysis, 2021 to 2025
- Current and Future Market Size Value (USD Billion) Projections, 2026 to 2036
- Y-o-Y Growth Trend Analysis
- Absolute $ Opportunity Analysis
- Global Market Pricing Analysis, 2021 to 2036
- Global Market Analysis and Forecast, By Technology, 2021 to 2036
- Introduction / Key Findings
- Historical Market Size Value (USD Billion) Analysis By Technology, 2021 to 2025
- Current and Future Market Size Value (USD Billion) Analysis and Forecast By Technology, 2026 to 2036
- Machine Vision with Deep Learning
- AI-enabled X-ray Inspection
- Hyperspectral and Multispectral Imaging
- Near-Infrared Spectroscopy
- Laser and Fluorescence Sensing
- Y-o-Y Growth Trend Analysis By Technology, 2021 to 2025
- Absolute $ Opportunity Analysis By Technology, 2026 to 2036
- Global Market Analysis and Forecast, By Application, 2021 to 2036
- Introduction / Key Findings
- Historical Market Size Value (USD Billion) Analysis By Application, 2021 to 2025
- Current and Future Market Size Value (USD Billion) Analysis and Forecast By Application, 2026 to 2036
- Sorting and Grading
- Foreign Object Detection
- Surface Defect and Contamination Detection
- Packaging and Label Inspection
- Fill Level and Seal Integrity
- Y-o-Y Growth Trend Analysis By Application, 2021 to 2025
- Absolute $ Opportunity Analysis By Application, 2026 to 2036
- Global Market Analysis and Forecast, By End Use, 2021 to 2036
- Introduction / Key Findings
- Historical Market Size Value (USD Billion) Analysis By End Use, 2021 to 2025
- Current and Future Market Size Value (USD Billion) Analysis and Forecast By End Use, 2026 to 2036
- Fruits and Vegetables
- Meat, Poultry and Seafood
- Packaged and Processed Foods
- Nuts, Grains and Seeds
- Bakery and Confectionery
- Dairy
- Y-o-Y Growth Trend Analysis By End Use, 2021 to 2025
- Absolute $ Opportunity Analysis By End Use, 2026 to 2036
- Global Market Analysis and Forecast, By Component, 2021 to 2036
- Introduction / Key Findings
- Historical Market Size Value (USD Billion) Analysis By Component, 2021 to 2025
- Current and Future Market Size Value (USD Billion) Analysis and Forecast By Component, 2026 to 2036
- Hardware
- Software and AI Platforms
- Services
- Y-o-Y Growth Trend Analysis By Component, 2021 to 2025
- Absolute $ Opportunity Analysis By Component, 2026 to 2036
- Global Market Analysis and Forecast, By Region, 2021 to 2036
- Introduction
- Historical Market Size Value (USD Billion) Analysis By Region, 2021 to 2025
- Current Market Size Value (USD Billion) Analysis and Forecast By Region, 2026 to 2036
- North America
- Latin America
- Western Europe
- Eastern Europe
- East Asia
- South Asia and Pacific
- Middle East and Africa
- Market Attractiveness Analysis By Region
- North America Market Analysis and Forecast, By Country, 2021 to 2036
- Historical Market Size Value (USD Billion) Trend Analysis By Market Taxonomy, 2021 to 2025
- Market Size Value (USD Billion) Forecast By Market Taxonomy, 2026 to 2036
- By Country
- United States
- Canada
- By Technology
- By Application
- By End Use
- By Component
- By Country
- Market Attractiveness Analysis
- By Country
- By Technology
- By Application
- By End Use
- By Component
- Key Takeaways
- Latin America Market Analysis and Forecast, By Country
- Historical Market Size Value (USD Billion) Trend Analysis By Market Taxonomy, 2021 to 2025
- Market Size Value (USD Billion) Forecast By Market Taxonomy, 2026 to 2036
- By Country
- Brazil
- Mexico
- Argentina
- Chile
- By Technology
- By Application
- By End Use
- By Component
- By Country
- Market Attractiveness Analysis
- By Country
- By Technology
- By Application
- By End Use
- By Component
- Key Takeaways
- Western Europe Market Analysis and Forecast, By Country
- Historical Market Size Value (USD Billion) Trend Analysis By Market Taxonomy, 2021 to 2025
- Market Size Value (USD Billion) Forecast By Market Taxonomy, 2026 to 2036
- By Country
- Germany
- France
- United Kingdom
- Italy
- Spain
- Benelux
- Nordics
- By Technology
- By Application
- By End Use
- By Component
- By Country
- Market Attractiveness Analysis
- By Country
- By Technology
- By Application
- By End Use
- By Component
- Key Takeaways
- Eastern Europe Market Analysis and Forecast, By Country
- Historical Market Size Value (USD Billion) Trend Analysis By Market Taxonomy, 2021 to 2025
- Market Size Value (USD Billion) Forecast By Market Taxonomy, 2026 to 2036
- By Country
- Poland
- Czech Republic
- Romania
- Hungary
- By Technology
- By Application
- By End Use
- By Component
- By Country
- Market Attractiveness Analysis
- By Country
- By Technology
- By Application
- By End Use
- By Component
- Key Takeaways
- East Asia Market Analysis and Forecast, By Country
- Historical Market Size Value (USD Billion) Trend Analysis By Market Taxonomy, 2021 to 2025
- Market Size Value (USD Billion) Forecast By Market Taxonomy, 2026 to 2036
- By Country
- Japan
- South Korea
- By Technology
- By Application
- By End Use
- By Component
- By Country
- Market Attractiveness Analysis
- By Country
- By Technology
- By Application
- By End Use
- By Component
- Key Takeaways
- South Asia and Pacific Market Analysis and Forecast, By Country
- Historical Market Size Value (USD Billion) Trend Analysis By Market Taxonomy, 2021 to 2025
- Market Size Value (USD Billion) Forecast By Market Taxonomy, 2026 to 2036
- By Country
- ASEAN
- Australia and New Zealand
- By Technology
- By Application
- By End Use
- By Component
- By Country
- Market Attractiveness Analysis
- By Country
- By Technology
- By Application
- By End Use
- By Component
- Key Takeaways
- Middle East and Africa Market Analysis and Forecast, By Country
- Historical Market Size Value (USD Billion) Trend Analysis By Market Taxonomy, 2021 to 2025
- Market Size Value (USD Billion) Forecast By Market Taxonomy, 2026 to 2036
- By Country
- GCC Countries
- South Africa
- Türkiye
- Israel
- By Technology
- By Application
- By End Use
- By Component
- By Country
- Market Attractiveness Analysis
- By Country
- By Technology
- By Application
- By End Use
- By Component
- Key Takeaways
- Key Countries Market Analysis
- United States
- Pricing Analysis
- Market Share Analysis, 2025
- By Technology
- By Application
- By End Use
- By Component
- Canada
- Pricing Analysis
- Market Share Analysis, 2025
- By Technology
- By Application
- By End Use
- By Component
- Mexico
- Pricing Analysis
- Market Share Analysis, 2025
- By Technology
- By Application
- By End Use
- By Component
- Brazil
- Pricing Analysis
- Market Share Analysis, 2025
- By Technology
- By Application
- By End Use
- By Component
- Chile
- Pricing Analysis
- Market Share Analysis, 2025
- By Technology
- By Application
- By End Use
- By Component
- Germany
- Pricing Analysis
- Market Share Analysis, 2025
- By Technology
- By Application
- By End Use
- By Component
- United Kingdom
- Pricing Analysis
- Market Share Analysis, 2025
- By Technology
- By Application
- By End Use
- By Component
- Italy
- Pricing Analysis
- Market Share Analysis, 2025
- By Technology
- By Application
- By End Use
- By Component
- Spain
- Pricing Analysis
- Market Share Analysis, 2025
- By Technology
- By Application
- By End Use
- By Component
- France
- Pricing Analysis
- Market Share Analysis, 2025
- By Technology
- By Application
- By End Use
- By Component
- ASEAN
- Pricing Analysis
- Market Share Analysis, 2025
- By Technology
- By Application
- By End Use
- By Component
- Australia and New Zealand
- Pricing Analysis
- Market Share Analysis, 2025
- By Technology
- By Application
- By End Use
- By Component
- Japan
- Pricing Analysis
- Market Share Analysis, 2025
- By Technology
- By Application
- By End Use
- By Component
- South Korea
- Pricing Analysis
- Market Share Analysis, 2025
- By Technology
- By Application
- By End Use
- By Component
- Poland
- Pricing Analysis
- Market Share Analysis, 2025
- By Technology
- By Application
- By End Use
- By Component
- Hungary
- Pricing Analysis
- Market Share Analysis, 2025
- By Technology
- By Application
- By End Use
- By Component
- Türkiye
- Pricing Analysis
- Market Share Analysis, 2025
- By Technology
- By Application
- By End Use
- By Component
- South Africa
- Pricing Analysis
- Market Share Analysis, 2025
- By Technology
- By Application
- By End Use
- By Component
- United States
- Market Structure Analysis
- Competition Dashboard
- Competition Benchmarking
- Market Share Analysis of Top Players
- By Regional
- By Technology
- By Application
- By End Use
- By Component
- Emerging Startups
- Innovation Benchmarking
- Competition Analysis
- Competition Deep Dive
- TOMRA
- Overview
- Product Portfolio
- Profitability by Market Segments
- Sales Footprint
- Strategy Overview
- Marketing Strategy
- Product Strategy
- Channel Strategy
- Key Technology
- Bühler
- METTLER TOLEDO
- Anritsu
- Ishida
- Sesotec
- Cognex
- JBT Marel
- TOMRA Systems ASA
- Bühler Group
- Mettler-Toledo International Inc.
- Anritsu Corporation
- Ishida Co., Ltd.
- Sesotec GmbH
- Cognex Corporation
- JBT Marel Corporation
- TOMRA
- Case Studies
- Success Stories
- Recent Developments
- Competition Deep Dive
- Assumptions & Acronyms Used


