The food metal detector market is estimated to be valued at USD 5776.7 million in 2025 and is projected to reach USD 8885.5 million by 2035, registering a compound annual growth rate (CAGR) of 4.4% over the forecast period.
Food processing environments present unique operational challenges through product variability, packaging materials, and environmental conditions that affect detection sensitivity and false rejection rates. Wet processing applications involve equipment exposed to moisture, cleaning chemicals, and temperature fluctuations that require specialized enclosures and corrosion-resistant components.
Dry processing lines accommodate different product densities, particle sizes, and flow characteristics that influence conveyor design, aperture dimensions, and detection coil configurations. Production managers balance detection sensitivity requirements against throughput considerations, recognizing that overly sensitive settings increase product rejection rates while inadequate sensitivity creates liability exposure.
Regulatory compliance drives equipment selection through HACCP implementation requirements, FDA inspection protocols, and international food safety standards that specify detection capabilities and documentation procedures. Quality assurance departments maintain calibration records, performance verification data, and corrective action documentation that demonstrate ongoing system effectiveness.
Third-party auditing organizations evaluate metal detection programs during facility certifications, creating demand for equipment that provides audit trail capabilities and validation protocols. Insurance providers often require metal detection systems as risk mitigation measures, influencing purchasing decisions beyond basic regulatory compliance.
Technology advancement focuses on digital signal processing, artificial intelligence algorithms, and multi-frequency detection capabilities that improve contamination identification while reducing false rejection incidents. Software integration enables remote monitoring, production data collection, and trend analysis that support continuous improvement initiatives and regulatory compliance documentation. Connectivity features allow integration with plant management systems, quality databases, and traceability programs that track product history and inspection results.
International markets reflect varying food safety regulations, enforcement practices, and economic development levels that influence equipment adoption rates and specification requirements. Developing regions often implement basic detection systems as manufacturing capabilities expand, while established markets emphasize advanced features and automation integration. Export market opportunities concentrate in regions experiencing food processing industry growth and regulatory modernization initiatives.
Training requirements extend beyond equipment operation to include food safety principles, contamination source identification, and emergency response procedures that prepare personnel to effectively utilize detection equipment within broader food safety programs. Educational programs address operator certification, management oversight responsibilities, and technical support capabilities that ensure proper system utilization and maintenance.
Cost considerations involve initial equipment investment, installation expenses, ongoing calibration costs, and potential production losses from false rejections that must be evaluated against liability risks and brand protection benefits that metal detection systems provide within comprehensive food safety strategies.
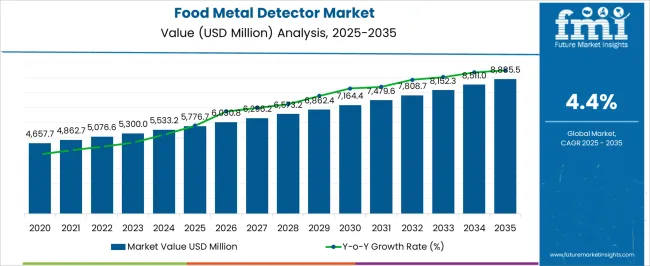
| Metric | Value |
|---|---|
| Food Metal Detector Market Estimated Value in (2025 E) | USD 5776.7 million |
| Food Metal Detector Market Forecast Value in (2035 F) | USD 8885.5 million |
| Forecast CAGR (2025 to 2035) | 4.4% |
The food metal detector market is expanding steadily due to stringent food safety regulations, rising consumer demand for quality assurance, and the growing complexity of global food supply chains. Food processors are increasingly adopting advanced detection systems to prevent contamination, protect brand reputation, and comply with international safety standards.
The rise in processed food consumption, coupled with automation in production lines, has further accelerated the deployment of metal detectors across diverse food categories. Continuous innovation in sensitivity levels, rejection mechanisms, and integration with automated packaging systems is enhancing operational efficiency and minimizing recalls.
With heightened regulatory oversight and consumer focus on safety and transparency, the outlook for this market remains robust, underpinned by technological advancements and rising adoption across bakery, meat, dairy, and other food segments.
The market is segmented by Product, Application, and Automation and region. By Product, the market is divided into Bakery Food Metal Detector, Sea Food Conveyor Metal Detector, Sea Foods Metal Detectors, Snack Foods Metal Detectors, Frozen Food Metal Detector, Bakery Metal Detector, Vinsyst Rice Metal Detector, Food And Meat Metal Detector, Food Metal Detector Conveyor, Food Grain Metal Detector, Spice Metal Detector, Sugar Bag Metal Detector, Snacks Metal Detectors, Candy Metal Detector, and Others. In terms of Application, the market is classified into Meat and Sausage Products, Bread and Baked Goods, Cheese and Dairy Products, Canned, Frozen and Convenience Food, Grain Mill Products, Nuts, Dried Vegetables, and Dried Fruit, Staple Foodstuffs and Seasonings, Snacks, Biscuits and Crackers, Confectionery, and Others. Based on Automation, the market is segmented into Automatic and Semi-Automatic. Regionally, the market is classified into North America, Latin America, Western Europe, Eastern Europe, Balkan & Baltic Countries, Russia & Belarus, Central Asia, East Asia, South Asia & Pacific, and the Middle East & Africa.
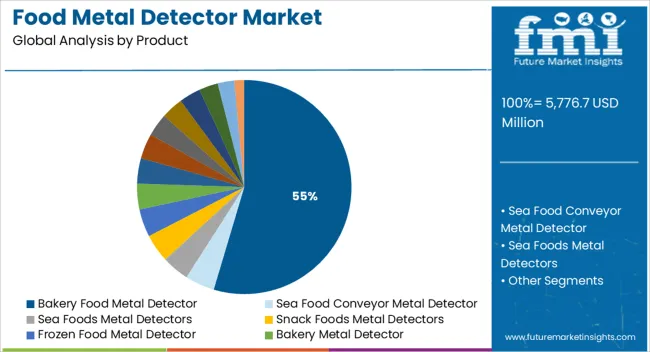
The bakery food metal detector segment is projected to contribute 54.60% of total market revenue by 2025 within the product category, making it the most prominent segment. Growth in this category is attributed to the rising demand for packaged bakery goods and the need to ensure contamination free production.
Enhanced sensitivity to detect ferrous and non ferrous metals in bakery products has reinforced the reliance on these systems. Their ability to integrate seamlessly with high speed bakery production lines has also been a major driver of adoption.
As manufacturers prioritize brand protection and compliance with safety standards, bakery food metal detectors have emerged as the leading product type in this market.
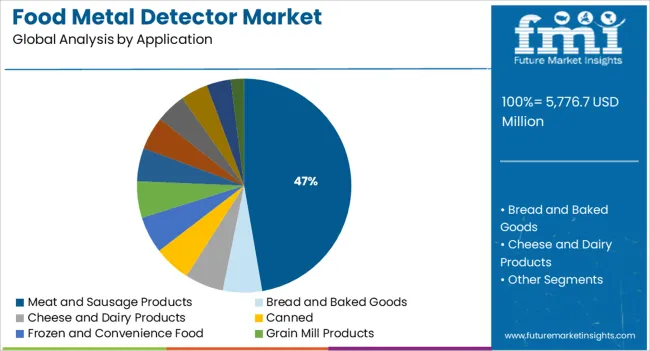
The meat and sausage products segment is expected to hold 47.30% of total market revenue by 2025 within the application category, positioning it as the leading segment. This dominance is driven by the high risk of contamination during meat processing and the need to safeguard product integrity.
Strict regulatory guidelines for meat safety, coupled with rising exports, have accelerated the integration of advanced metal detection systems in meat facilities. The ability of detectors to identify even minute fragments of metal in meat and sausage products has enhanced operational reliability.
Consumer emphasis on traceability and quality assurance continues to fuel demand, establishing this segment as a key contributor to market growth.
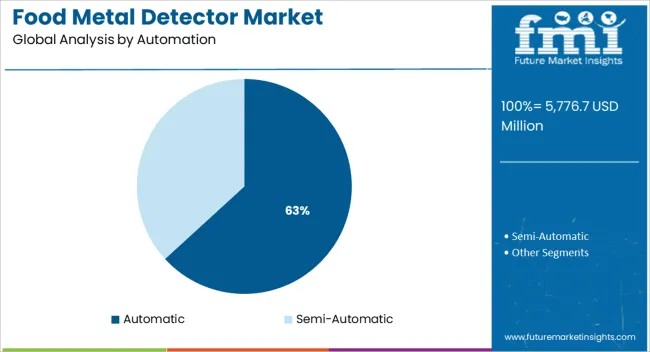
The automatic segment is anticipated to account for 63.20% of total market revenue by 2025 within the automation category, making it the largest contributor. This growth is supported by the increasing push toward production line automation and the need for high throughput efficiency.
Automatic systems reduce manual intervention, ensure consistent detection accuracy, and improve overall process efficiency. Their compatibility with large scale production facilities has made them the preferred choice among food manufacturers.
As industry players prioritize speed, precision, and compliance with stringent safety standards, the automatic segment is expected to remain the leading contributor in the automation category.
A number of influential factors have been identified that are expected to drive the global food metal detector market forward during the projection period (2025 to 2035). Besides the proliferating aspects prevailing in the market, the analysts at FMI have also analyzed the restraining elements, lucrative opportunities, and upcoming threats that can somehow impact market dynamics.
The drivers, restraints, opportunities, and threats (DROTs) identified are as follows:
DRIVERS
RESTRAINTS
OPPORTUNITIES
THREATS
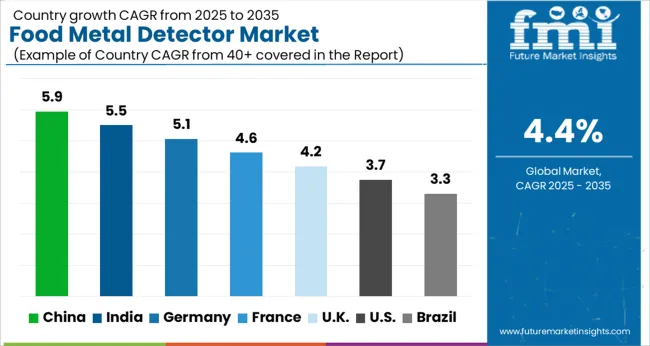
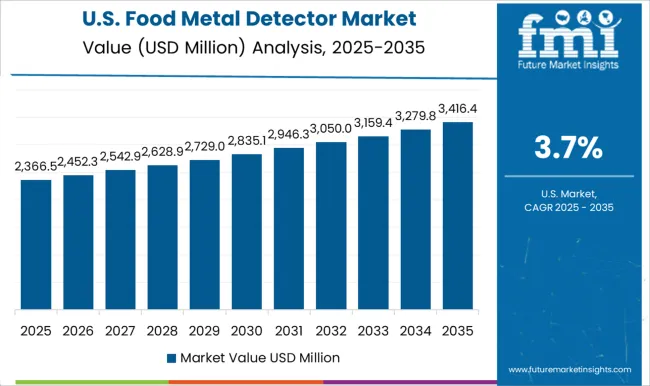
Growing Focus Towards Improving Food Safety Pushing Demand in the USA
As per FMI, the USA holds around 68% share of the North American food metal detector market and it is expected to grow at a steady pace during the forecast period. Growth in the USA food metal detector market is driven by rising food safety concerns, the availability of advanced inspection technologies, and the presence of stringent food safety regulations.
In recent years, there has been a sharp rise in foodborne diseases across the USA due to the increasing consumption of processed foods. According to the Centers for Disease Control and Prevention (CDC), around 1 in 6 Americans, or 48 million people get sick while 3,000 die of foodborne diseases each year. This has compelled food manufacturers to use inspection solutions like food metal detectors, which in turn is triggering market expansion in the country.
Increasing Incidence of Foodborne Diseases Driving Market in India
With increasing government initiatives to tackle the growing burden of foodborne diseases, sales of food metal detectors across India are projected to grow at a significant pace during the projection period (2025 to 2035).
Today, most food processing companies across India employ food metal detectors to improve product safety and comply with government regulations. Thus, the rapid expansion of food processing companies will eventually boost the food metal detector market in India during the next ten years.
Similarly, the rising number of start-ups offering food metal detectors at much lower prices and increasing consumer awareness about food safety will aid in the expansion of the Indian food metal detector market.
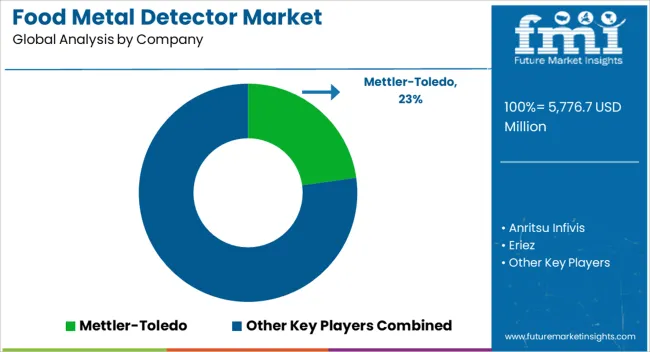
The food metal detector market is defined by leading manufacturers providing advanced inspection and contamination detection technologies that ensure product safety and regulatory compliance. Mettler-Toledo International Inc. and Anritsu Infivis Co. Ltd. lead the global market with precision metal detection systems that integrate with conveyor, packaging, and weighing lines for high-speed inspection. Thermo Fisher Scientific Inc. and Ishida Co. Ltd. provide high-sensitivity detectors used across bakery, meat, dairy, and ready-meal production, combining automation and data integration for traceability.
Eriez Manufacturing Co., CEIA S.p.A., and Sesotec GmbH offer rugged, customizable detectors with multi-frequency technology to identify ferrous and non-ferrous contaminants in harsh processing environments. Minebea Intec GmbH, Loma Systems Ltd., and Bizerba GmbH & Co. KG deliver compact, hygienic designs suitable for integration with weighing, labeling, and x-ray inspection systems. WIPOTEC-OCS GmbH and Mesutronic GmbH specialize in precision inspection for high-throughput packaging lines, focusing on minimal false rejects and real-time monitoring.
Fortress Technology Inc., Nikka Densok Co. Ltd., and Multivac Group emphasize smart connectivity and modular designs for easy maintenance. Shanghai Techik Instrument Co. Ltd., Gaojing Technology Co. Ltd., Easyweigh Tech Co. Ltd., and Qingdao Baijing Instrument Co. Ltd. expand the Asian market through cost-effective, high-accuracy detectors. Market growth centers on automation, HACCP compliance, and enhanced detection reliability.
| Attribute | Details |
|---|---|
| Estimated Market Size (2025) | USD 5776.7 million |
| Projected Market Size (2035) | USD 8885.5 million |
| Anticipated Growth Rate (2025 to 2035) | 4.4% CAGR |
| Forecast Period | 2025 to 2035 |
| Historical Data Available for | 2020 to 2025 |
| Market Analysis | USD Million for Value and Units for Volume |
| Key Regions Covered | North America; Latin America; Europe; Asia Pacific; Oceania; Middle East & Africa (MEA) |
| Key Countries Covered | USA, Canada, Mexico, Germany, UK, France, Italy, Spain, China, Japan, India, South Korea, Australia, Brazil, Argentina, South Africa, UAE |
| Key Segments Covered | Product Type, Automation, Application, Region |
| Key Companies Profiled | Mettler-Toledo International Inc., Anritsu Infivis Co. Ltd., Eriez Manufacturing Co., CEIA S.p.A., Sesotec GmbH, Minebea Intec GmbH, Nissin Electronics Co. Ltd., Multivac Group, Loma Systems Ltd., Thermo Fisher Scientific Inc., Bizerba GmbH & Co. KG, Ishida Co. Ltd., WIPOTEC-OCS GmbH, Mesutronic GmbH, Fortress Technology Inc., Nikka Densok Co. Ltd., Shanghai Techik Instrument Co. Ltd., Gaojing Technology Co. Ltd., Easyweigh Tech Co. Ltd., and Qingdao Baijing Instrument Co. Ltd. |
| Report Coverage | Market Forecast, Company Share Analysis, Competitive Landscape, DROT Analysis, Market Dynamics and Challenges, and Strategic Growth Initiatives |
The global food metal detector market is estimated to be valued at USD 5,776.7 million in 2025.
The market size for the food metal detector market is projected to reach USD 8,885.5 million by 2035.
The food metal detector market is expected to grow at a 4.4% CAGR between 2025 and 2035.
The key product types in food metal detector market are bakery food metal detector, sea food conveyor metal detector, sea foods metal detectors, snack foods metal detectors, frozen food metal detector, bakery metal detector, vinsyst rice metal detector, food and meat metal detector, food metal detector conveyor, food grain metal detector, spice metal detector, sugar bag metal detector, snacks metal detectors, candy metal detector and others.
In terms of application, meat and sausage products segment to command 47.3% share in the food metal detector market in 2025.


Full Research Suite comprises of:
Market outlook & trends analysis
Interviews & case studies
Strategic recommendations
Vendor profiles & capabilities analysis
5-year forecasts
8 regions and 60+ country-level data splits
Market segment data splits
12 months of continuous data updates
DELIVERED AS:
PDF EXCEL ONLINE
Food & Beverage OEE Software Market Size and Share Forecast Outlook 2025 to 2035
Food Grade Crosslinked Polyvinylpolypyrrolidone (PVPP) Market Size and Share Forecast Outlook 2025 to 2035
Food Grade Cassia Gum Powder Market Size and Share Forecast Outlook 2025 to 2035
Food Grade Dry Film Lubricant Market Size and Share Forecast Outlook 2025 to 2035
Foodservice Equipment Market Analysis - Size, Share, and Forecast Outlook 2025 to 2035
Food Basket Market Forecast and Outlook 2025 to 2035
Food Grade Tremella Polysaccharide Market Size and Share Forecast Outlook 2025 to 2035
Food Sorting Machine Market Size and Share Forecast Outlook 2025 to 2035
Foodservice Paper Bag Market Size and Share Forecast Outlook 2025 to 2035
Food Stabilizers Market Size and Share Forecast Outlook 2025 to 2035
Food Packaging Film Market Size and Share Forecast Outlook 2025 to 2035
Food Certification Market Size and Share Forecast Outlook 2025 to 2035
Food Tray Market Size and Share Forecast Outlook 2025 to 2035
Food & Beverage Industrial Disinfection and Cleaning Market Size and Share Forecast Outlook 2025 to 2035
Food Technology Market Size and Share Forecast Outlook 2025 to 2035
Food Tourism Sector Market Size and Share Forecast Outlook 2025 to 2035
Food Processing Boiler Market Size and Share Forecast Outlook 2025 to 2035
Food Packaging Machines Market Size and Share Forecast Outlook 2025 to 2035
Food Minerals Market Size and Share Forecast Outlook 2025 to 2035
Food And Beverage Chemicals Market Size and Share Forecast Outlook 2025 to 2035

Thank you!
You will receive an email from our Business Development Manager. Please be sure to check your SPAM/JUNK folder too.
Chat With
MaRIA