AI Makeup Market Size and Share Forecast Outlook 2025 to 2035

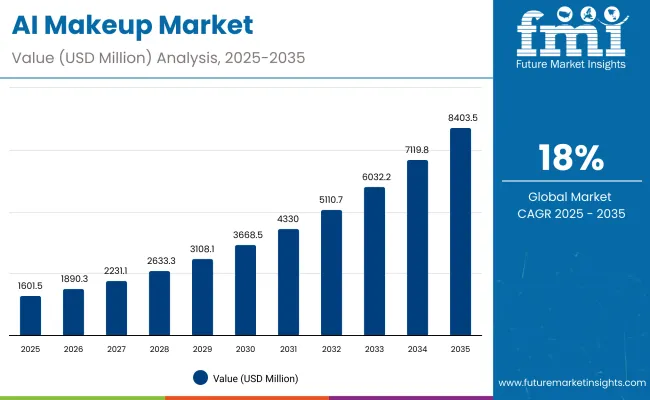
The AI Makeup Market is expected to record a valuation of USD 1,601.5 Million in 2025 and USD 8,403.5 Million in 2035, with an increase of USD 6,802.0 Million, which equals a growth of 425% over the decade. The overall expansion represents a CAGR of 18.0% and a 5.25X increase in market size.
Quick Stats for AI Makeup Market

  • AI Makeup Market Value (2025): USD 1,601.5 Million
  • AI Makeup Market Forecast Value (2035): USD 8,403.5 Million
  • AI Makeup Market Forecast CAGR: 18.0%
  • Leading Segment in AI Makeup Market in 2025: Consumer-Facing Applications (45%)
  • Key Growth Regions in the AI Makeup Market: North America, Asia-Pacific, Europe
  • Top Key Players in AI Makeup Market: Perfect Corp., ModiFace (L’Oréal), YouCam Makeup, Revieve, Meitu Inc., Banuba, Ulta Beauty, Sephora, Taaz Inc., Poplar Studio

Ai Makeup Market

AI Makeup Market Key Takeaways

Metric Value
Market Estimated Value in (2025E) USD 1,601.5 Million
Market Forecast Value in (2035F) USD 8,403.5 Million
Forecast CAGR (2025 to 2035) 18.0%

During the first five-year period from 2025 to 2030, the market increases from USD 1,601.5 Million to USD 3,668.5 Million, adding USD 2,067.0 Million, which accounts for 30.4% of the total decade growth. This phase records steady adoption in mobile-based virtual try-on (VTO), consumer-facing AR filters, and personalized recommendation engines, driven by the need for interactive beauty experiences. Virtual Try-On Simulation dominates this period as it caters to over 40% of applications requiring real-time engagement and accuracy.

The second half from 2030 to 2035 contributes USD 4,735.0 Million, equal to 69.6% of total growth, as the market jumps from USD 3,668.5 Million to USD 8,403.5 Million. This acceleration is powered by widespread deployment of AI-driven personalization, brand-owned AI platforms, and in-store AR/AI kiosks integrated with e-commerce. Mobile applications and AR-based technologies together capture a larger share above 70% by the end of the decade. Software-led SaaS licensing and cloud-based analytics add recurring revenue, increasing the software share beyond 42% in total value.

From 2020 to 2024, the AI Makeup Market grew steadily from experimental pilots into mainstream adoption, driven by mobile AR filters, influencer-led campaigns, and initial virtual try-on solutions. During this period, the competitive landscape was dominated by AI tech vendors and camera app platforms, controlling nearly 60% of revenue, with leaders such as Perfect Corp., ModiFace, and YouCam shaping precision AR and AI tools for consumers and retailers. Competitive differentiation relied on realism, ease of integration, and user engagement metrics, while direct monetization models were limited. Service-based and SaaS platforms had minimal traction, contributing less than 15% of the total market value.

Demand for AI Makeup will expand to USD 1,601.5 Million in 2025, and the revenue mix will shift as SaaS licensing and brand-owned AI platforms grow to over 42% share. Traditional leaders face rising competition from digital-first startups offering AI-powered skin analysis, personalized beauty recommendations, and subscription-based AR experiences. Major players are pivoting to hybrid models, integrating cloud analytics, omnichannel retail workflows, and AR/VR-based immersive shopping to retain relevance. Emerging entrants specializing in AI personalization, AR commerce, and social-media-native platforms are gaining share. The competitive advantage is moving away from standalone apps to ecosystem strength, scalability, and recurring revenue streams.

Why the AI Makeup Market is growing?

The AI Makeup Market is expanding as beauty brands move beyond static online catalogs to interactive, try-before-you-buy experiences. Virtual try-on tools, powered by AR and computer vision, allow customers to test products instantly across mobile apps, e-commerce sites, and social platforms. This not only reduces product return rates but also increases consumer confidence and average basket size, making AI-powered beauty solutions an essential revenue driver for retailers and cosmetic manufacturers alike.

Growth is also driven by the integration of AI personalization engines that analyze skin tone, facial features, and past purchasing behavior to provide hyper-targeted product recommendations. Unlike generic marketing, these algorithms create a unique consumer profile, enabling brands to launch tailored campaigns and limited-edition products. This level of precision drives higher engagement, loyalty, and cross-selling opportunities, making personalization a competitive differentiator that accelerates adoption of AI technologies across both consumer-facing and B2B segments in the beauty ecosystem.

Segmental Analysis

The AI Makeup Market is segmented by offering, functionality, end user, deployment, product type, company type, business model, consumer type, technology, and region. Offerings include platforms, consumer apps, embedded retail tools, and AI development solutions, while functionalities span virtual try-ons, skin tone analysis, recommendation engines, personalization, and in-store AR tools. End users range from consumers and retailers to manufacturers and tech providers, adopting through mobile apps, web platforms, kiosks, or APIs. Product categories cover face, eye, lip, nail, hair, and skincare, supported by AI vendors, beauty retailers, and social platforms. Business models involve SaaS, white-label, D2C apps, and brand-owned AI tools, catering to Gen Z, influencers, professionals, and new users. Core technologies include AR, computer vision, ML, and NLP, with North America and Asia-Pacific leading regional growth.
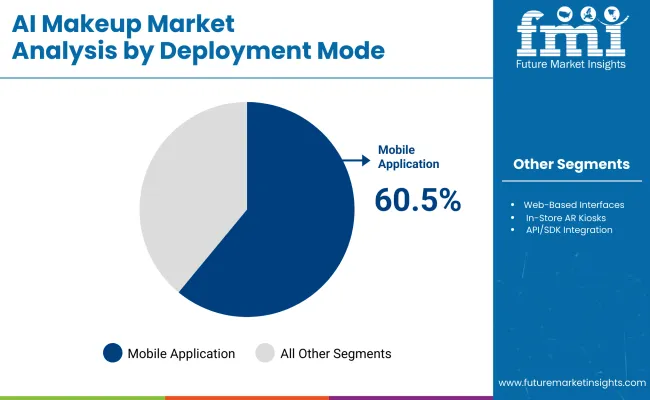
Insights into the Deployment Segment with Mobile Applications Leading in Market Share

Ai Makeup Market By Deployment

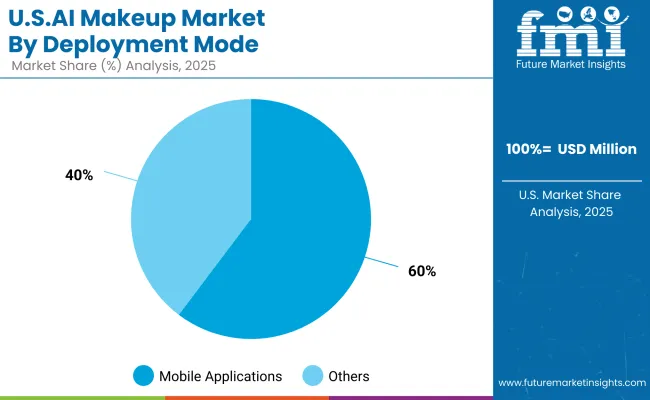
Deployment Mode Value Share% 2025
Mobile Applications 60.5%
Others 39.5%

The mobile applications segment is projected to contribute 60.5% of the AI Makeup Market revenue in 2025, making it the dominant deployment category. This leadership is fueled by the widespread adoption of AR-powered try-on apps and integration of AI tools within e-commerce platforms and social media channels. Mobile-first strategies are resonating with Gen Z and millennial consumers who prefer real-time, on-the-go personalization.

Growth is further supported by the rising penetration of beauty apps in China and the USA, along with the use of AI-driven recommendations within retail shopping experiences. As AR and AI technologies mature, mobile platforms are increasingly serving as the primary channel for virtual makeup, skincare diagnostics, and tailored beauty solutions, cementing their role as the backbone of AI beauty adoption.
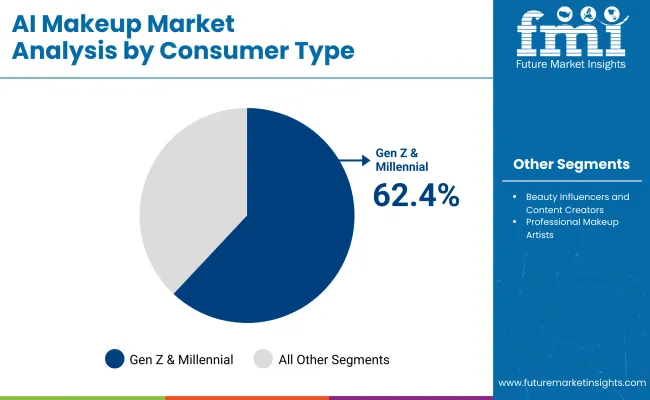
Insights into the Consumer Segment with Gen Z & Millennials Dominating the Demand

Ai Makeup Market By Consumer

Consumer Type Value Share% 2025
Gen Z & Millennials 62.4%
Others 37.6%

The Gen Z & Millennial segment is forecasted to hold 62.4% of the AI Makeup Market share in 2025, driven by their digital-first beauty behaviors and reliance on AI-powered try-on tools. This group actively engages with social media filters, AR applications, and personalized AI beauty recommendations, making them the largest adopters of virtual makeup solutions.

Their preference for personalized, on-demand experiences is accelerating the integration of AI into beauty platforms, especially within mobile-first ecosystems like TikTok, Instagram, and Tmall apps. The segment’s dominance is further strengthened by high smartphone penetration, openness to tech-driven experimentation, and sustainability-driven shopping choices. As brands continue to target these demographics with immersive AI experiences, Gen Z & Millennials are expected to remain the core growth driver of the AI Makeup Market.
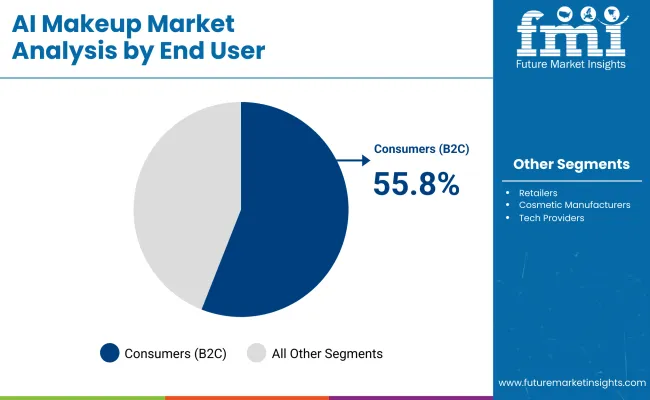
Insights into the End-User Segment with Consumers (B2C) Leading Adoption

Ai Makeup Market By End User

End User Value Share% 2025
Consumers (B2C) 55.8%
Others 44.2%

The laser triangulation technology segment is projected to account for 55.8% of the AI Makeup Market revenue in The consumer (B2C) segment is projected to account for 55.8% of the AI Makeup Market revenue in 2025, positioning it as the leading end-user group. This dominance is fueled by the rising use of AI-driven virtual try-on applications, personalized shade-matching tools, and AR-enabled shopping experiences. Consumers increasingly demand customized beauty solutions, where AI algorithms analyze facial features, skin tone, and texture to recommend tailored products.

This segment’s growth is further amplified by mobile-first adoption, integration of AI tools on e-commerce and social media platforms, and the popularity of immersive beauty apps that merge convenience with engagement. As personalization and digital interactivity become central to consumer decision-making, the B2C segment is expected to retain its leadership throughout the forecast period.

What are the Drivers, Restraints, and Key Trends of the AI Makeup Market?

Personalization Through AI Algorithms

The AI makeup market is primarily fueled by the growing demand for hyper-personalized beauty experiences. Advanced algorithms can analyze facial features, skin tone, undertones, and even lifestyle habits to provide precise makeup recommendations tailored to each individual. This level of personalization increases consumer trust, reduces product mismatches, and enhances satisfaction, driving repeat purchases. It also allows brands to differentiate themselves by offering unique experiences that cannot be achieved through traditional retail interactions, making AI-powered tools a core driver of growth in the beauty industry.

Integration with E-commerce & Social Media

The rapid expansion of online beauty retail is further accelerated by AI-powered virtual try-on solutions embedded in e-commerce platforms and social media. Consumers can instantly experiment with different shades and looks through AR filters on platforms like Instagram, TikTok, and online brand stores, making the shopping experience engaging and interactive. This real-time product visualization not only improves conversion rates but also reduces product return rates. For beauty brands, this integration bridges the gap between physical and digital retail, fueling adoption of AI makeup solutions globally.

Data Privacy Concerns in Facial Recognition

Despite its benefits, one of the major restraints in the AI makeup market is the heightened concern over data privacy and security. AI makeup applications often rely on facial recognition and image-based scanning, raising fears about how biometric data is collected, stored, and used. With increasing global scrutiny through regulations such as GDPR in Europe or China’s strict data protection laws, companies face challenges in ensuring compliance. Consumer hesitation to share sensitive personal information remains a significant barrier that could slow adoption, particularly in regions with strong data protection frameworks.

Rise of AI-Enabled Sustainable Beauty

A defining trend shaping the AI makeup market is the convergence of personalization with sustainability. AI technologies are increasingly being leveraged to help consumers choose the right product on the first try, reducing the need for excessive physical sampling and minimizing waste in packaging and returns. Some platforms even simulate eco-friendly product packaging in AR experiences, enhancing consumer awareness about sustainability. This resonates strongly with Gen Z and millennial consumers who prioritize ethical and sustainable consumption. The trend is encouraging brands to align AI-powered beauty solutions with eco-conscious strategies, strengthening their appeal in a competitive market.
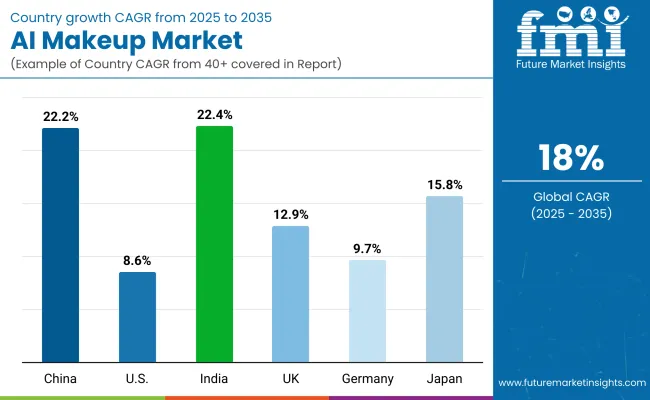
Analysis of AI Makeup Market By Key Countries

Ai Makeup Market By Country

Countries CAGR (2025 to 2035)
China 22.2%
USA 8.6%
India 22.4%
UK 12.9%
Germany 9.7%
Japan 15.8%

The global AI Makeup Market reveals significant regional variations in adoption, shaped by digital beauty penetration, consumer tech adoption, and brand-led innovation. Asia-Pacific leads the growth curve, with China at 22.2% CAGR and India at 22.4% CAGR, supported by the popularity of mobile-first beauty apps, rapid e-commerce expansion, and strong engagement of Gen Z and millennial consumers. China’s beauty-tech ecosystem is driven by domestic giants integrating AI makeup into super-apps, while India’s surge reflects affordable smartphone access, influencer-led adoption, and growing demand for personalized beauty experiences.

Europe maintains a strong presence, with the UK at 12.9% CAGR and Germany at 9.7% CAGR, propelled by premium beauty brands embedding AI-driven try-on features to comply with sustainability goals and reduce physical testers. Consumer focus on ethical beauty and digital-first retail channels drives regional adoption. Japan, with a 15.8% CAGR, highlights the region’s tech-forward consumer base and integration of AI beauty tools into daily self-care routines, supported by collaborations between cosmetics giants and technology firms.

In contrast, North America shows steady but moderate expansion, with the USA at 8.6% CAGR, reflecting a relatively mature beauty retail ecosystem. Growth here is fueled more by AR/VR-based beauty consultations, AI-powered dermatology integrations, and hybrid in-store-online experiences rather than sheer consumer adoption.
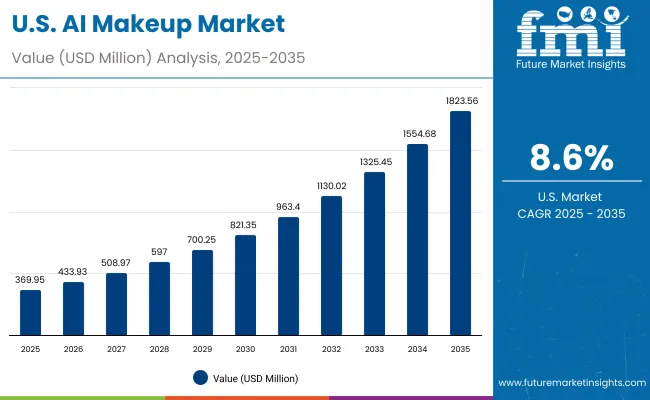
Sales Outlook for AI Makeup in the United States

Ai Makeup Market Usa

Year USA AI Makeup Market (USD Million)
2025 369.95
2026 433.93
2027 508.97
2028 597.00
2029 700.25
2030 821.35
2031 963.40
2032 1,130.02
2033 1,325.45
2034 1,554.68
2035 1,823.56

The USA AI Makeup Market is expected to expand at a strong CAGR of 8.6% (2025-2035), supported by high digital adoption among beauty consumers and increasing integration of AI-driven try-on tools by leading cosmetics brands. Mobile-first experiences and AR-powered virtual try-ons are becoming mainstream in both e-commerce and physical retail, enabling brands to reduce product returns and drive customer engagement. Growth is further strengthened by partnerships between tech providers and beauty brands offering cloud-based personalization, virtual skin analysis, and AI-driven product recommendations.

  • Virtual try-ons in e-commerce are a major driver, reducing return rates and boosting consumer confidence.
  • AI-powered skin diagnostics are seeing fast adoption in dermatology-linked beauty platforms.
  • Hybrid retail strategies with AR mirrors and AI apps are enhancing in-store engagement and upselling.

Growth and Expansion Outlook for AI Makeup Market in the United Kingdom

The AI Makeup Market in the United Kingdom is projected to expand at a CAGR of 12.9%, fueled by strong adoption of virtual try-on tools in beauty retail and luxury cosmetics. Premium department stores and e-commerce platforms are integrating AI-powered recommendation engines to elevate customer experiences. Heritage beauty brands are collaborating with tech startups to develop AR-enabled makeup mirrors and skin analysis solutions, catering to Gen Z and millennial shoppers who value personalization. Government support for digital innovation in retail and partnerships with universities in AI research further accelerate market penetration.

  • Luxury retailers are deploying AR mirrors to enhance in-store beauty experiences.
  • Beauty brands are using AI analytics to recommend shade-matched products.
  • Tech-beauty collaborations are expanding personalized skincare and makeup solutions.

Growth and Expansion Outlook for AI Makeup Market in India

India is expected to be one of the fastest-growing markets, expanding at a CAGR of 22.4% through 2035. Rising smartphone penetration and social commerce platforms are boosting awareness of AI-driven beauty solutions. Affordable AI makeup apps are attracting younger consumers in tier-2 and tier-3 cities, while established cosmetic players are rolling out localized AR-based shade-matching tools. EdTech and vocational institutes are introducing AI-powered beauty courses, training professionals in digital makeup consultancy. Public-private initiatives are encouraging homegrown AI startups to develop indigenous solutions that address diverse Indian skin tones and regional beauty preferences.

  • AI beauty apps are expanding reach in smaller cities with cost-effective solutions.
  • Cosmetics brands are offering localized AR tools tailored for Indian consumers.
  • Training programs are building a new workforce skilled in AI-powered beauty.

Sales Outlook for AI Makeup in China

The AI Makeup Market in China is forecast to grow at a CAGR of 22.2%, the highest globally. Rapid adoption is supported by a booming e-commerce sector, government-driven digital retail programs, and tech giants integrating AI into beauty platforms. Livestreaming commerce is a major growth driver, where AI filters and AR-based try-ons enhance customer engagement. Affordable AI solutions from domestic players are democratizing access to smart beauty tools across both luxury and mass-market segments. Beauty-tech collaborations are further fueled by the country’s strong AI R&D ecosystem.

  • Livestream shopping platforms are accelerating AI makeup adoption at scale.
  • Domestic tech-beauty firms are offering cost-effective AR solutions.
  • Government digital retail policies are fostering AI integration in cosmetics.

In-depth Analysis of AI Makeup in Germany

Market Share 2025
China 23.1%
USA 12.6%
India 7.6%
UK 17.2%
Germany 9.7%
Japan 6.0%
Market Share 2035
China 21.7%
USA 14.1%
India 10.3%
UK 15.8%
Germany 7.7%
Japan 6.5%

The AI Makeup Market in Germany is projected to grow at a CAGR of 9.7%, supported by its strong cosmetics retail presence and digital adoption among Gen Z and millennials. Beauty retailers are integrating AI try-on mirrors in stores to enhance personalized shopping experiences. German skincare brands are also embedding AI-driven shade-matching and ingredient recommendations into e-commerce platforms. Regulatory emphasis on sustainability and cruelty-free testing aligns with AI systems that simulate results digitally, reducing the need for physical product trials.
  • Beauty retailers using AI try-on mirrors for in-store personalization.
  • E-commerce platforms offering AI-driven shade & product recommendations.
  • Digital tools supporting sustainability by reducing physical sampling.

Growth Outlook for AI Makeup in the USA

Ai Makeup Market Usa 2

USA By Deployment Mode Value Share% 2025
Mobile Applications 60.3%
Others 39.7%

The AI Makeup Market in the USA is set to expand at a CAGR of 12.6%, driven by the dominance of mobile-first shopping behaviors. Major players like Sephora and Ulta are enhancing their apps with AI virtual try-ons, AR shade matching, and skin analysis tools. Social media platforms such as TikTok and Instagram are integrating AI-powered filters that influence product discovery and brand engagement. Premium beauty brands are leveraging personalized recommendations and subscription models powered by AI analytics.
  • Mobile apps lead due to on-the-go virtual try-on demand.
  • AI tools integrated into social media for discovery & engagement.
  • Subscription beauty boxes using AI analytics for personalization.

Opportunity Analysis of AI Makeup in China

Ai Makeup Market China

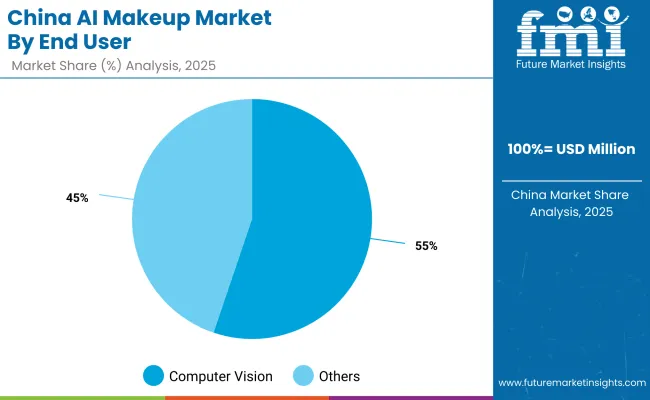
China By End User Value Share% 2025
Computer Vision 55.2%
Others 44.8%

The AI Makeup Market in China is growing rapidly, expected to lead globally by 2035. With 55.2% share in e-commerce and social platforms, adoption is being accelerated by super-app ecosystems like Alibaba, JD.com, and Douyin. Chinese beauty consumers are highly responsive to AI live-streaming sales, virtual makeup influencers, and AR try-on tools. Local beauty-tech startups are launching low-cost AI solutions integrated with mini-programs on WeChat. This environment positions China as the fastest-scaling AI makeup hub, supported by government-driven digital retail policies.
  • Social platforms dominate with AI-powered live commerce & influencers.
  • WeChat & Douyin driving virtual try-on + product recommendation engines.
  • Local startups fueling affordable AI adoption at scale.

Competitive Landscape of AI Makeup Market

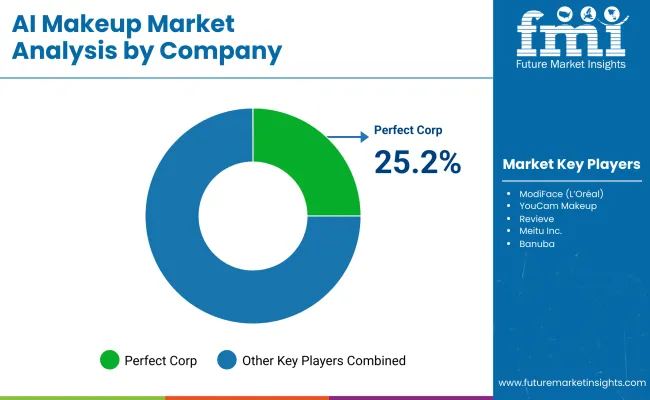
Ai Makeup Market By Company

The AI Makeup Market is moderately fragmented, with global beauty-tech leaders, mid-sized innovators, and niche-focused startups competing across retail, e-commerce, and social commerce applications. Perfect Corp dominates with its YouCam Makeup platform, holding 25.2% market share, owing to strong partnerships with global cosmetic brands and deep integration of AI shade-matching, AR try-on, and skin analysis tools across both online and offline channels.

Mid-sized innovators such as ModiFace (L’Oréal-owned), Revieve, and Banuba are driving growth through B2B SaaS beauty-tech platforms, offering white-label AR try-on solutions for retailers and direct-to-consumer brands. These players emphasize cloud-based personalization engines and AI-driven skin diagnostics, making them critical enablers for digital transformation in beauty retail.

Specialized startups like Youthforia AI, Haut.AI, and MirrorMe focus on hyper-personalized makeup recommendations, sustainability-driven AI solutions, and niche AR applications for smaller brands and indie retailers. Their strength lies in agility, fast deployment, and regional customization, making them highly adaptable to emerging beauty trends and consumer demands.

Competitive differentiation is shifting from basic AR try-ons toward integrated beauty ecosystems that combine predictive AI for skin health, AR/VR-based immersive retail, metaverse beauty avatars, and subscription-based AI beauty services. This signals a strong move toward holistic, data-driven consumer experiences rather than standalone virtual try-on tools.

Key Developments in AI Makeup Market

  • 2024: Perfect Corp expanded its partnership network with global retailers like Sephora and Estée Lauder, integrating AI-powered skin tone analysis and personalized foundation shade-matching into e-commerce platforms for seamless consumer experiences.
  • 2025: L’Oréal’s ModiFace introduced an advanced AI-driven real-time makeup simulation engine, enabling ultra-accurate AR try-ons across social media apps and live-stream shopping platforms, enhancing consumer engagement and conversion rates.

Scope of the Report

Item Value
Quantitative Units USD 1,601.5 Million
Type of Offering Platform-as-a-Service (PaaS), Consumer-Facing Applications, Embedded Retail Technology, AI-Based Product Development Tools
Functionality / Use Case Virtual Try-On Simulation, Skin Tone and Face Shape Analysis, Makeup Recommendation Engine, Makeup Filter and Enhancement Tools, Personalization Algorithms, Retail Integration Tools
End User Consumers (B2C), Retailers (B2B2C), Cosmetic Manufacturers, Tech Providers
Deployment Mode Mobile Applications, Web-Based Interfaces, In-Store AR Kiosks, API/SDK Integration
Product Type Face Products, Eye Products, Lip Products, Nail Products, Hair Simulation, Skincare/Base Products
Company Type AI Tech Vendors, Beauty Retailers, Social Media & Camera Apps, E-commerce Platforms
Business Model SaaS Licensing, White-label Apps, Direct-to-Consumer Apps, Brand-Owned AI Solutions
Consumer Type Gen Z and Millennials, Beauty Influencers and Content Creators, Professional Makeup Artists, First-Time Makeup Users
Technology Type: Augmented Reality (AR), Facial Recognition and Landmark Detection, Machine Learning Algorithms, Computer Vision, Natural Language Processing (NLP), Big Data Personalization Engines
Regions Covered North America, Europe, Asia-Pacific, Latin America, Middle East & Africa
Country Covered United States, Canada, Germany, France, United Kingdom, China, Japan, India, Brazil, South Africa
Key Companies Profiled Perfect Corp., ModiFace (L’Oréal), YouCam Makeup, Revieve, Meitu Inc., Banuba, Ulta Beauty, Sephora, Taaz Inc., Poplar Studio
Additional Attributes Dollar sales by product category and deployment mode, adoption trends in AR-powered virtual try-on and personalized makeup recommendations, rising demand for mobile and in-store AI beauty applications, sector-specific growth across retail, e-commerce, and professional salons, software and subscription-based revenue segmentation, integration with AR/VR and social commerce platforms, regional trends influenced by beauty-tech adoption and digital consumer engagement, and innovations in computer vision, facial recognition, and machine learning-driven personalization engines.

Key Segments

By Type of Offering:

  • Platform-as-a-Service (PaaS)
  • Consumer-Facing Applications
  • Embedded Retail Technology
  • AI-Based Product Development Tools

By Functionality:

  • Virtual Try-On Simulation
  • Skin Tone and Face Shape Analysis
  • Makeup Recommendation Engine
  • Makeup Filter and Enhancement Tools
  • Personalization Algorithms
  • Retail Integration Tools

By End User:

  • Consumers (B2C)
  • Retailers (B2B2C)
  • Cosmetic Manufacturers
  • Tech Providers

By Deployment Mode:

  • Mobile Applications
  • Web-Based Interfaces
  • In-Store AR Kiosks
  • API/SDK Integration

By Product Type:

  • Face Products
  • Eye Products
  • Lip Products
  • Nail Products
  • Hair Simulation
  • Skincare/Base Products

By Company Type:

  • AI Tech Vendors
  • Beauty Retailers
  • Social Media & Camera Apps
  • E-commerce Platforms

By Consumer Type:

  • Gen Z and Millennials
  • Beauty Influencers and Content Creators
  • Professional Makeup Artists
  • First-Time Makeup Users

By Region:

  • North America
  • Latin America
  • Europe
  • East Asia
  • South Asia & Pacific
  • Middle East and Africa

Frequently Asked Questions

How big is the AI Makeup Market in 2025?

The global AI Makeup Market is estimated to be valued at USD 1,601.5 Million in 2025, driven by strong adoption of mobile applications and AR-powered try-on solutions.

What will be the size of the AI Makeup Market in 2035?

The AI Makeup Market is projected to reach USD 8,403.5 Million by 2035, supported by continued integration into e-commerce, retail platforms, and personalized beauty services.

How much will be the AI Makeup Market growth between 2025 and 2035?

The AI Makeup Market is expected to grow at a 18.0% CAGR between 2025 and 2035, fueled by demand for hyper-personalized beauty experiences, AR/VR innovations, and machine learning–driven product recommendations.

What are the key product types in the AI Makeup Market?

The key product types in the AI Makeup Market are face products, eye products, lip products, nail products, hair simulation, and skincare/base products.

Which deployment segment will contribute a significant share in the AI Makeup Market in 2025?

In terms of deployment, the mobile applications segment is expected to command a significant share of the AI Makeup Market in 2025, owing to widespread use among Gen Z and Millennials through social media and beauty retail platforms.

Table of Content

  1. Executive Summary
    • Global Market Outlook
    • Demand-side Trends
    • Supply-side Trends
    • Technology Roadmap Analysis
    • Analysis and Recommendations
  2. Market Overview
    • Market Coverage / Taxonomy
    • Market Definition / Scope / Limitations
  3. Market Background
    • Market Dynamics
      • Drivers
      • Restraints
      • Opportunity
      • Trends
    • Scenario Forecast
      • Demand in Optimistic Scenario
      • Demand in Likely Scenario
      • Demand in Conservative Scenario
    • Opportunity Map Analysis
    • Product Life Cycle Analysis
    • Supply Chain Analysis
      • Supply Side Participants and their Roles
        • Producers
        • Mid-Level Participants (Traders/ Agents/ Brokers)
        • Wholesalers and Distributors
      • Value Added and Value Created at Node in the Supply Chain
      • List of Raw Material Suppliers
      • List of Existing and Potential Buyer’s
    • Investment Feasibility Matrix
    • Value Chain Analysis
      • Profit Margin Analysis
      • Wholesalers and Distributors
      • Retailers
    • PESTLE and Porter’s Analysis
    • Regulatory Landscape
      • By Key Regions
      • By Key Countries
    • Regional Parent Market Outlook
    • Production and Consumption Statistics
    • Import and Export Statistics
  4. Global Market Analysis 2020 to 2024 and Forecast, 2025 to 2035
    • Historical Market Size Value (USD Million) & Volume (Units) Analysis, 2020 to 2024
    • Current and Future Market Size Value (USD Million) & Volume (Units) Projections, 2025 to 2035
      • Y-o-Y Growth Trend Analysis
      • Absolute $ Opportunity Analysis
  5. Global Market Analysis 2020 to 2024 and Forecast 2025 to 2035, By Type of Offering
    • Introduction / Key Findings
    • Historical Market Size Value (USD Million) & Volume (Units) Analysis By Type of Offering, 2020 to 2024
    • Current and Future Market Size Value (USD Million) & Volume (Units) Analysis and Forecast By Type of Offering, 2025 to 2035
      • Platform-as-a-Service (PaaS)
      • Consumer-Facing Applications
      • Embedded Retail Technology
      • AI-Based Product Development Tools
    • Y-o-Y Growth Trend Analysis By Type of Offering, 2020 to 2024
    • Absolute $ Opportunity Analysis By Type of Offering, 2025 to 2035
  6. Global Market Analysis 2020 to 2024 and Forecast 2025 to 2035, By Functionality
    • Introduction / Key Findings
    • Historical Market Size Value (USD Million) & Volume (Units) Analysis By Functionality, 2020 to 2024
    • Current and Future Market Size Value (USD Million) & Volume (Units) Analysis and Forecast By Functionality, 2025 to 2035
      • Virtual Try-On Simulation
      • Skin Tone and Face Shape Analysis
      • Makeup Recommendation Engine
      • Makeup Filter and Enhancement Tools
      • Personalization Algorithms
      • Retail Integration Tools
    • Y-o-Y Growth Trend Analysis By Functionality, 2020 to 2024
    • Absolute $ Opportunity Analysis By Functionality, 2025 to 2035
  7. Global Market Analysis 2020 to 2024 and Forecast 2025 to 2035, By End User
    • Introduction / Key Findings
    • Historical Market Size Value (USD Million) & Volume (Units) Analysis By End User, 2020 to 2024
    • Current and Future Market Size Value (USD Million) & Volume (Units) Analysis and Forecast By End User, 2025 to 2035
      • Consumers (B2C)
      • Retailers (B2B2C)
      • Cosmetic Manufacturers
      • Tech Providers
    • Y-o-Y Growth Trend Analysis By End User, 2020 to 2024
    • Absolute $ Opportunity Analysis By End User, 2025 to 2035
  8. Global Market Analysis 2020 to 2024 and Forecast 2025 to 2035, By Deployment Mode
    • Introduction / Key Findings
    • Historical Market Size Value (USD Million) & Volume (Units) Analysis By Deployment Mode, 2020 to 2024
    • Current and Future Market Size Value (USD Million) & Volume (Units) Analysis and Forecast By Deployment Mode, 2025 to 2035
      • Mobile Applications
      • Web-Based Interfaces
      • In-Store AR Kiosks
      • API/SDK Integration
    • Y-o-Y Growth Trend Analysis By Deployment Mode, 2020 to 2024
    • Absolute $ Opportunity Analysis By Deployment Mode, 2025 to 2035
  9. Global Market Analysis 2020 to 2024 and Forecast 2025 to 2035, By Product Type
    • Introduction / Key Findings
    • Historical Market Size Value (USD Million) & Volume (Units) Analysis By Product Type, 2020 to 2024
    • Current and Future Market Size Value (USD Million) & Volume (Units) Analysis and Forecast By Product Type, 2025 to 2035
      • Face Products
      • Eye Products
      • Lip Products
      • Nail Products
      • Hair Simulation
      • Skincare/Base Products
    • Y-o-Y Growth Trend Analysis By Product Type, 2020 to 2024
    • Absolute $ Opportunity Analysis By Product Type, 2025 to 2035
  10. Global Market Analysis 2020 to 2024 and Forecast 2025 to 2035, By Company Type
    • Introduction / Key Findings
    • Historical Market Size Value (USD Million) & Volume (Units) Analysis By Company Type, 2020 to 2024
    • Current and Future Market Size Value (USD Million) & Volume (Units) Analysis and Forecast By Company Type, 2025 to 2035
      • AI Tech Vendors
      • Beauty Retailers
      • Social Media & Camera Apps
      • E-commerce Platforms
    • Y-o-Y Growth Trend Analysis By Company Type, 2020 to 2024
    • Absolute $ Opportunity Analysis By Company Type, 2025 to 2035
  11. Global Market Analysis 2020 to 2024 and Forecast 2025 to 2035, By Consumer Type
    • Introduction / Key Findings
    • Historical Market Size Value (USD Million) & Volume (Units) Analysis By Consumer Type, 2020 to 2024
    • Current and Future Market Size Value (USD Million) & Volume (Units) Analysis and Forecast By Consumer Type, 2025 to 2035
      • Gen Z and Millennials
      • Beauty Influencers and Content Creators
      • Professional Makeup Artists
      • First-Time Makeup Users
    • Y-o-Y Growth Trend Analysis By Consumer Type, 2020 to 2024
    • Absolute $ Opportunity Analysis By Consumer Type, 2025 to 2035
  12. Global Market Analysis 2020 to 2024 and Forecast 2025 to 2035, By Region
    • Introduction
    • Historical Market Size Value (USD Million) & Volume (Units) Analysis By Region, 2020 to 2024
    • Current Market Size Value (USD Million) & Volume (Units) Analysis and Forecast By Region, 2025 to 2035
      • North America
      • Latin America
      • Europe
      • East Asia
      • South Asia & Pacific
      • Middle East and Africa
    • Market Attractiveness Analysis By Region
  13. North America Market Analysis 2020 to 2024 and Forecast 2025 to 2035, By Country
    • Historical Market Size Value (USD Million) & Volume (Units) Trend Analysis By Market Taxonomy, 2020 to 2024
    • Market Size Value (USD Million) & Volume (Units) Forecast By Market Taxonomy, 2025 to 2035
      • By Country
        • USA
        • Canada
      • By Type of Offering
      • By Functionality
      • By End User
      • By Deployment Mode
      • By Product Type
      • By Company Type
      • By Consumer Type
    • Market Attractiveness Analysis
      • By Country
      • By Type of Offering
      • By Functionality
      • By End User
      • By Deployment Mode
      • By Product Type
      • By Company Type
      • By Consumer Type
    • Key Takeaways
  14. Latin America Market Analysis 2020 to 2024 and Forecast 2025 to 2035, By Country
    • Historical Market Size Value (USD Million) & Volume (Units) Trend Analysis By Market Taxonomy, 2020 to 2024
    • Market Size Value (USD Million) & Volume (Units) Forecast By Market Taxonomy, 2025 to 2035
      • By Country
        • Brazil
        • Mexico
        • Colombia
        • Rest of Latin America
      • By Type of Offering
      • By Functionality
      • By End User
      • By Deployment Mode
      • By Product Type
      • By Company Type
      • By Consumer Type
    • Market Attractiveness Analysis
      • By Country
      • By Type of Offering
      • By Functionality
      • By End User
      • By Deployment Mode
      • By Product Type
      • By Company Type
      • By Consumer Type
    • Key Takeaways
  15. Europe Market Analysis 2020 to 2024 and Forecast 2025 to 2035, By Country
    • Historical Market Size Value (USD Million) & Volume (Units) Trend Analysis By Market Taxonomy, 2020 to 2024
    • Market Size Value (USD Million) & Volume (Units) Forecast By Market Taxonomy, 2025 to 2035
      • By Country
        • Germany
        • UK
        • France
        • Italy
        • Spain
        • Belgium
        • Netherlands
        • Nordic
        • Switzerland
        • Russia
        • Poland
        • Rest of Europe
      • By Type of Offering
      • By Functionality
      • By End User
      • By Deployment Mode
      • By Product Type
      • By Company Type
      • By Consumer Type
    • Market Attractiveness Analysis
      • By Country
      • By Type of Offering
      • By Functionality
      • By End User
      • By Deployment Mode
      • By Product Type
      • By Company Type
      • By Consumer Type
    • Key Takeaways
  16. East Asia Market Analysis 2020 to 2024 and Forecast 2025 to 2035, By Country
    • Historical Market Size Value (USD Million) & Volume (Units) Trend Analysis By Market Taxonomy, 2020 to 2024
    • Market Size Value (USD Million) & Volume (Units) Forecast By Market Taxonomy, 2025 to 2035
      • By Country
        • China
        • Japan
        • South Korea
      • By Type of Offering
      • By Functionality
      • By End User
      • By Deployment Mode
      • By Product Type
      • By Company Type
      • By Consumer Type
    • Market Attractiveness Analysis
      • By Country
      • By Type of Offering
      • By Functionality
      • By End User
      • By Deployment Mode
      • By Product Type
      • By Company Type
      • By Consumer Type
    • Key Takeaways
  17. South Asia & Pacific Market Analysis 2020 to 2024 and Forecast 2025 to 2035, By Country
    • Historical Market Size Value (USD Million) & Volume (Units) Trend Analysis By Market Taxonomy, 2020 to 2024
    • Market Size Value (USD Million) & Volume (Units) Forecast By Market Taxonomy, 2025 to 2035
      • By Country
        • India
        • Thailand
        • Malaysia
        • Indonesia
        • Singapore
        • Vietnam
        • Australia
        • New Zealand
        • Rest of South Asia
      • By Type of Offering
      • By Functionality
      • By End User
      • By Deployment Mode
      • By Product Type
      • By Company Type
      • By Consumer Type
    • Market Attractiveness Analysis
      • By Country
      • By Type of Offering
      • By Functionality
      • By End User
      • By Deployment Mode
      • By Product Type
      • By Company Type
      • By Consumer Type
    • Key Takeaways
  18. Middle East and Africa Market Analysis 2020 to 2024 and Forecast 2025 to 2035, By Country
    • Historical Market Size Value (USD Million) & Volume (Units) Trend Analysis By Market Taxonomy, 2020 to 2024
    • Market Size Value (USD Million) & Volume (Units) Forecast By Market Taxonomy, 2025 to 2035
      • By Country
        • Turkey
        • UAE
        • Saudi Arabia
        • Israel
        • Other GCC Countries
        • North Africa
        • South Africa
      • By Type of Offering
      • By Functionality
      • By End User
      • By Deployment Mode
      • By Product Type
      • By Company Type
      • By Consumer Type
    • Market Attractiveness Analysis
      • By Country
      • By Type of Offering
      • By Functionality
      • By End User
      • By Deployment Mode
      • By Product Type
      • By Company Type
      • By Consumer Type
    • Key Takeaways
  19. Key Countries Market Analysis
    • USA
      • Pricing Analysis
      • Market Share Analysis, 2024
        • By Type of Offering
        • By Functionality
        • By End User
        • By Deployment Mode
        • By Product Type
        • By Company Type
        • By Consumer Type
    • Canada
      • Pricing Analysis
      • Market Share Analysis, 2024
        • By Type of Offering
        • By Functionality
        • By End User
        • By Deployment Mode
        • By Product Type
        • By Company Type
        • By Consumer Type
    • Brazil
      • Pricing Analysis
      • Market Share Analysis, 2024
        • By Type of Offering
        • By Functionality
        • By End User
        • By Deployment Mode
        • By Product Type
        • By Company Type
        • By Consumer Type
    • Mexico
      • Pricing Analysis
      • Market Share Analysis, 2024
        • By Type of Offering
        • By Functionality
        • By End User
        • By Deployment Mode
        • By Product Type
        • By Company Type
        • By Consumer Type
    • Colombia
      • Pricing Analysis
      • Market Share Analysis, 2024
        • By Type of Offering
        • By Functionality
        • By End User
        • By Deployment Mode
        • By Product Type
        • By Company Type
        • By Consumer Type
    • Germany
      • Pricing Analysis
      • Market Share Analysis, 2024
        • By Type of Offering
        • By Functionality
        • By End User
        • By Deployment Mode
        • By Product Type
        • By Company Type
        • By Consumer Type
    • UK
      • Pricing Analysis
      • Market Share Analysis, 2024
        • By Type of Offering
        • By Functionality
        • By End User
        • By Deployment Mode
        • By Product Type
        • By Company Type
        • By Consumer Type
    • France
      • Pricing Analysis
      • Market Share Analysis, 2024
        • By Type of Offering
        • By Functionality
        • By End User
        • By Deployment Mode
        • By Product Type
        • By Company Type
        • By Consumer Type
    • Italy
      • Pricing Analysis
      • Market Share Analysis, 2024
        • By Type of Offering
        • By Functionality
        • By End User
        • By Deployment Mode
        • By Product Type
        • By Company Type
        • By Consumer Type
    • Spain
      • Pricing Analysis
      • Market Share Analysis, 2024
        • By Type of Offering
        • By Functionality
        • By End User
        • By Deployment Mode
        • By Product Type
        • By Company Type
        • By Consumer Type
    • Belgium
      • Pricing Analysis
      • Market Share Analysis, 2024
        • By Type of Offering
        • By Functionality
        • By End User
        • By Deployment Mode
        • By Product Type
        • By Company Type
        • By Consumer Type
    • Netherlands
      • Pricing Analysis
      • Market Share Analysis, 2024
        • By Type of Offering
        • By Functionality
        • By End User
        • By Deployment Mode
        • By Product Type
        • By Company Type
        • By Consumer Type
    • Nordic
      • Pricing Analysis
      • Market Share Analysis, 2024
        • By Type of Offering
        • By Functionality
        • By End User
        • By Deployment Mode
        • By Product Type
        • By Company Type
        • By Consumer Type
    • Switzerland
      • Pricing Analysis
      • Market Share Analysis, 2024
        • By Type of Offering
        • By Functionality
        • By End User
        • By Deployment Mode
        • By Product Type
        • By Company Type
        • By Consumer Type
    • Russia
      • Pricing Analysis
      • Market Share Analysis, 2024
        • By Type of Offering
        • By Functionality
        • By End User
        • By Deployment Mode
        • By Product Type
        • By Company Type
        • By Consumer Type
    • Poland
      • Pricing Analysis
      • Market Share Analysis, 2024
        • By Type of Offering
        • By Functionality
        • By End User
        • By Deployment Mode
        • By Product Type
        • By Company Type
        • By Consumer Type
    • China
      • Pricing Analysis
      • Market Share Analysis, 2024
        • By Type of Offering
        • By Functionality
        • By End User
        • By Deployment Mode
        • By Product Type
        • By Company Type
        • By Consumer Type
    • Japan
      • Pricing Analysis
      • Market Share Analysis, 2024
        • By Type of Offering
        • By Functionality
        • By End User
        • By Deployment Mode
        • By Product Type
        • By Company Type
        • By Consumer Type
    • South Korea
      • Pricing Analysis
      • Market Share Analysis, 2024
        • By Type of Offering
        • By Functionality
        • By End User
        • By Deployment Mode
        • By Product Type
        • By Company Type
        • By Consumer Type
    • India
      • Pricing Analysis
      • Market Share Analysis, 2024
        • By Type of Offering
        • By Functionality
        • By End User
        • By Deployment Mode
        • By Product Type
        • By Company Type
        • By Consumer Type
    • Thailand
      • Pricing Analysis
      • Market Share Analysis, 2024
        • By Type of Offering
        • By Functionality
        • By End User
        • By Deployment Mode
        • By Product Type
        • By Company Type
        • By Consumer Type
    • Indonesia
      • Pricing Analysis
      • Market Share Analysis, 2024
        • By Type of Offering
        • By Functionality
        • By End User
        • By Deployment Mode
        • By Product Type
        • By Company Type
        • By Consumer Type
    • Australia
      • Pricing Analysis
      • Market Share Analysis, 2024
        • By Type of Offering
        • By Functionality
        • By End User
        • By Deployment Mode
        • By Product Type
        • By Company Type
        • By Consumer Type
    • New Zealand
      • Pricing Analysis
      • Market Share Analysis, 2024
        • By Type of Offering
        • By Functionality
        • By End User
        • By Deployment Mode
        • By Product Type
        • By Company Type
        • By Consumer Type
    • Turkey
      • Pricing Analysis
      • Market Share Analysis, 2024
        • By Type of Offering
        • By Functionality
        • By End User
        • By Deployment Mode
        • By Product Type
        • By Company Type
        • By Consumer Type
    • UAE
      • Pricing Analysis
      • Market Share Analysis, 2024
        • By Type of Offering
        • By Functionality
        • By End User
        • By Deployment Mode
        • By Product Type
        • By Company Type
        • By Consumer Type
    • Saudi Arabia
      • Pricing Analysis
      • Market Share Analysis, 2024
        • By Type of Offering
        • By Functionality
        • By End User
        • By Deployment Mode
        • By Product Type
        • By Company Type
        • By Consumer Type
    • Israel
      • Pricing Analysis
      • Market Share Analysis, 2024
        • By Type of Offering
        • By Functionality
        • By End User
        • By Deployment Mode
        • By Product Type
        • By Company Type
        • By Consumer Type
    • North Africa
      • Pricing Analysis
      • Market Share Analysis, 2024
        • By Type of Offering
        • By Functionality
        • By End User
        • By Deployment Mode
        • By Product Type
        • By Company Type
        • By Consumer Type
    • South Africa
      • Pricing Analysis
      • Market Share Analysis, 2024
        • By Type of Offering
        • By Functionality
        • By End User
        • By Deployment Mode
        • By Product Type
        • By Company Type
        • By Consumer Type
  20. Market Structure Analysis
    • Competition Dashboard
    • Competition Benchmarking
    • Market Share Analysis of Top Players
      • By Regional
      • By Type of Offering
      • By Functionality
      • By End User
      • By Deployment Mode
      • By Product Type
      • By Company Type
      • By Consumer Type
  21. Competition Analysis
    • Competition Deep Dive
      • Perfect Corp.
        • Overview
        • Product Portfolio
        • Profitability by Market Segments (Product/Age /Sales Channel/Region)
        • Sales Footprint
        • Strategy Overview
          • Marketing Strategy
          • Product Strategy
          • Channel Strategy
      • ModiFace (L’Oréal)
        • Overview
        • Product Portfolio
        • Profitability by Market Segments (Product/Age /Sales Channel/Region)
        • Sales Footprint
        • Strategy Overview
          • Marketing Strategy
          • Product Strategy
          • Channel Strategy
      • YouCam Makeup
        • Overview
        • Product Portfolio
        • Profitability by Market Segments (Product/Age /Sales Channel/Region)
        • Sales Footprint
        • Strategy Overview
          • Marketing Strategy
          • Product Strategy
          • Channel Strategy
      • Revieve
        • Overview
        • Product Portfolio
        • Profitability by Market Segments (Product/Age /Sales Channel/Region)
        • Sales Footprint
        • Strategy Overview
          • Marketing Strategy
          • Product Strategy
          • Channel Strategy
      • Meitu Inc.
        • Overview
        • Product Portfolio
        • Profitability by Market Segments (Product/Age /Sales Channel/Region)
        • Sales Footprint
        • Strategy Overview
          • Marketing Strategy
          • Product Strategy
          • Channel Strategy
      • Banuba
        • Overview
        • Product Portfolio
        • Profitability by Market Segments (Product/Age /Sales Channel/Region)
        • Sales Footprint
        • Strategy Overview
          • Marketing Strategy
          • Product Strategy
          • Channel Strategy
      • Ulta Beauty
        • Overview
        • Product Portfolio
        • Profitability by Market Segments (Product/Age /Sales Channel/Region)
        • Sales Footprint
        • Strategy Overview
          • Marketing Strategy
          • Product Strategy
          • Channel Strategy
      • Sephora
        • Overview
        • Product Portfolio
        • Profitability by Market Segments (Product/Age /Sales Channel/Region)
        • Sales Footprint
        • Strategy Overview
          • Marketing Strategy
          • Product Strategy
          • Channel Strategy
      • Taaz Inc.
        • Overview
        • Product Portfolio
        • Profitability by Market Segments (Product/Age /Sales Channel/Region)
        • Sales Footprint
        • Strategy Overview
          • Marketing Strategy
          • Product Strategy
          • Channel Strategy
      • Poplar Studio
        • Overview
        • Product Portfolio
        • Profitability by Market Segments (Product/Age /Sales Channel/Region)
        • Sales Footprint
        • Strategy Overview
          • Marketing Strategy
          • Product Strategy
          • Channel Strategy
      • Others
        • Overview
        • Product Portfolio
        • Profitability by Market Segments (Product/Age /Sales Channel/Region)
        • Sales Footprint
        • Strategy Overview
          • Marketing Strategy
          • Product Strategy
          • Channel Strategy
  22. Assumptions & Acronyms Used
  23. Research Methodology

List of Tables

  • Table 1: Global Market Value (USD Million) Forecast by Region, 2020-2035
  • Table 2: Global Market Volume (Units) Forecast by Region, 2020-2035
  • Table 3: Global Market Value (USD Million) Forecast by Type of Offering, 2020-2035
  • Table 4: Global Market Volume (Units) Forecast by Type of Offering, 2020-2035
  • Table 5: Global Market Value (USD Million) Forecast by Functionality, 2020-2035
  • Table 6: Global Market Volume (Units) Forecast by Functionality, 2020-2035
  • Table 7: Global Market Value (USD Million) Forecast by End User, 2020-2035
  • Table 8: Global Market Volume (Units) Forecast by End User, 2020-2035
  • Table 9: Global Market Value (USD Million) Forecast by Deployment Mode, 2020-2035
  • Table 10: Global Market Volume (Units) Forecast by Deployment Mode, 2020-2035
  • Table 11: Global Market Value (USD Million) Forecast by Product Type, 2020-2035
  • Table 12: Global Market Volume (Units) Forecast by Product Type, 2020-2035
  • Table 13: Global Market Value (USD Million) Forecast by Company Type, 2020-2035
  • Table 14: Global Market Volume (Units) Forecast by Company Type, 2020-2035
  • Table 15: Global Market Value (USD Million) Forecast by Consumer Type, 2020-2035
  • Table 16: Global Market Volume (Units) Forecast by Consumer Type, 2020-2035
  • Table 17: North America Market Value (USD Million) Forecast by Country, 2020-2035
  • Table 18: North America Market Volume (Units) Forecast by Country, 2020-2035
  • Table 19: North America Market Value (USD Million) Forecast by Type of Offering, 2020-2035
  • Table 20: North America Market Volume (Units) Forecast by Type of Offering, 2020-2035
  • Table 21: North America Market Value (USD Million) Forecast by Functionality, 2020-2035
  • Table 22: North America Market Volume (Units) Forecast by Functionality, 2020-2035
  • Table 23: North America Market Value (USD Million) Forecast by End User, 2020-2035
  • Table 24: North America Market Volume (Units) Forecast by End User, 2020-2035
  • Table 25: North America Market Value (USD Million) Forecast by Deployment Mode, 2020-2035
  • Table 26: North America Market Volume (Units) Forecast by Deployment Mode, 2020-2035
  • Table 27: North America Market Value (USD Million) Forecast by Product Type, 2020-2035
  • Table 28: North America Market Volume (Units) Forecast by Product Type, 2020-2035
  • Table 29: North America Market Value (USD Million) Forecast by Company Type, 2020-2035
  • Table 30: North America Market Volume (Units) Forecast by Company Type, 2020-2035
  • Table 31: North America Market Value (USD Million) Forecast by Consumer Type, 2020-2035
  • Table 32: North America Market Volume (Units) Forecast by Consumer Type, 2020-2035
  • Table 33: Latin America Market Value (USD Million) Forecast by Country, 2020-2035
  • Table 34: Latin America Market Volume (Units) Forecast by Country, 2020-2035
  • Table 35: Latin America Market Value (USD Million) Forecast by Type of Offering, 2020-2035
  • Table 36: Latin America Market Volume (Units) Forecast by Type of Offering, 2020-2035
  • Table 37: Latin America Market Value (USD Million) Forecast by Functionality, 2020-2035
  • Table 38: Latin America Market Volume (Units) Forecast by Functionality, 2020-2035
  • Table 39: Latin America Market Value (USD Million) Forecast by End User, 2020-2035
  • Table 40: Latin America Market Volume (Units) Forecast by End User, 2020-2035
  • Table 41: Latin America Market Value (USD Million) Forecast by Deployment Mode, 2020-2035
  • Table 42: Latin America Market Volume (Units) Forecast by Deployment Mode, 2020-2035
  • Table 43: Latin America Market Value (USD Million) Forecast by Product Type, 2020-2035
  • Table 44: Latin America Market Volume (Units) Forecast by Product Type, 2020-2035
  • Table 45: Latin America Market Value (USD Million) Forecast by Company Type, 2020-2035
  • Table 46: Latin America Market Volume (Units) Forecast by Company Type, 2020-2035
  • Table 47: Latin America Market Value (USD Million) Forecast by Consumer Type, 2020-2035
  • Table 48: Latin America Market Volume (Units) Forecast by Consumer Type, 2020-2035
  • Table 49: Europe Market Value (USD Million) Forecast by Country, 2020-2035
  • Table 50: Europe Market Volume (Units) Forecast by Country, 2020-2035
  • Table 51: Europe Market Value (USD Million) Forecast by Type of Offering, 2020-2035
  • Table 52: Europe Market Volume (Units) Forecast by Type of Offering, 2020-2035
  • Table 53: Europe Market Value (USD Million) Forecast by Functionality, 2020-2035
  • Table 54: Europe Market Volume (Units) Forecast by Functionality, 2020-2035
  • Table 55: Europe Market Value (USD Million) Forecast by End User, 2020-2035
  • Table 56: Europe Market Volume (Units) Forecast by End User, 2020-2035
  • Table 57: Europe Market Value (USD Million) Forecast by Deployment Mode, 2020-2035
  • Table 58: Europe Market Volume (Units) Forecast by Deployment Mode, 2020-2035
  • Table 59: Europe Market Value (USD Million) Forecast by Product Type, 2020-2035
  • Table 60: Europe Market Volume (Units) Forecast by Product Type, 2020-2035
  • Table 61: Europe Market Value (USD Million) Forecast by Company Type, 2020-2035
  • Table 62: Europe Market Volume (Units) Forecast by Company Type, 2020-2035
  • Table 63: Europe Market Value (USD Million) Forecast by Consumer Type, 2020-2035
  • Table 64: Europe Market Volume (Units) Forecast by Consumer Type, 2020-2035
  • Table 65: East Asia Market Value (USD Million) Forecast by Country, 2020-2035
  • Table 66: East Asia Market Volume (Units) Forecast by Country, 2020-2035
  • Table 67: East Asia Market Value (USD Million) Forecast by Type of Offering, 2020-2035
  • Table 68: East Asia Market Volume (Units) Forecast by Type of Offering, 2020-2035
  • Table 69: East Asia Market Value (USD Million) Forecast by Functionality, 2020-2035
  • Table 70: East Asia Market Volume (Units) Forecast by Functionality, 2020-2035
  • Table 71: East Asia Market Value (USD Million) Forecast by End User, 2020-2035
  • Table 72: East Asia Market Volume (Units) Forecast by End User, 2020-2035
  • Table 73: East Asia Market Value (USD Million) Forecast by Deployment Mode, 2020-2035
  • Table 74: East Asia Market Volume (Units) Forecast by Deployment Mode, 2020-2035
  • Table 75: East Asia Market Value (USD Million) Forecast by Product Type, 2020-2035
  • Table 76: East Asia Market Volume (Units) Forecast by Product Type, 2020-2035
  • Table 77: East Asia Market Value (USD Million) Forecast by Company Type, 2020-2035
  • Table 78: East Asia Market Volume (Units) Forecast by Company Type, 2020-2035
  • Table 79: East Asia Market Value (USD Million) Forecast by Consumer Type, 2020-2035
  • Table 80: East Asia Market Volume (Units) Forecast by Consumer Type, 2020-2035
  • Table 81: South Asia & Pacific Market Value (USD Million) Forecast by Country, 2020-2035
  • Table 82: South Asia & Pacific Market Volume (Units) Forecast by Country, 2020-2035
  • Table 83: South Asia & Pacific Market Value (USD Million) Forecast by Type of Offering, 2020-2035
  • Table 84: South Asia & Pacific Market Volume (Units) Forecast by Type of Offering, 2020-2035
  • Table 85: South Asia & Pacific Market Value (USD Million) Forecast by Functionality, 2020-2035
  • Table 86: South Asia & Pacific Market Volume (Units) Forecast by Functionality, 2020-2035
  • Table 87: South Asia & Pacific Market Value (USD Million) Forecast by End User, 2020-2035
  • Table 88: South Asia & Pacific Market Volume (Units) Forecast by End User, 2020-2035
  • Table 89: South Asia & Pacific Market Value (USD Million) Forecast by Deployment Mode, 2020-2035
  • Table 90: South Asia & Pacific Market Volume (Units) Forecast by Deployment Mode, 2020-2035
  • Table 91: South Asia & Pacific Market Value (USD Million) Forecast by Product Type, 2020-2035
  • Table 92: South Asia & Pacific Market Volume (Units) Forecast by Product Type, 2020-2035
  • Table 93: South Asia & Pacific Market Value (USD Million) Forecast by Company Type, 2020-2035
  • Table 94: South Asia & Pacific Market Volume (Units) Forecast by Company Type, 2020-2035
  • Table 95: South Asia & Pacific Market Value (USD Million) Forecast by Consumer Type, 2020-2035
  • Table 96: South Asia & Pacific Market Volume (Units) Forecast by Consumer Type, 2020-2035
  • Table 97: Middle East and Africa Market Value (USD Million) Forecast by Country, 2020-2035
  • Table 98: Middle East and Africa Market Volume (Units) Forecast by Country, 2020-2035
  • Table 99: Middle East and Africa Market Value (USD Million) Forecast by Type of Offering, 2020-2035
  • Table 100: Middle East and Africa Market Volume (Units) Forecast by Type of Offering, 2020-2035
  • Table 101: Middle East and Africa Market Value (USD Million) Forecast by Functionality, 2020-2035
  • Table 102: Middle East and Africa Market Volume (Units) Forecast by Functionality, 2020-2035
  • Table 103: Middle East and Africa Market Value (USD Million) Forecast by End User, 2020-2035
  • Table 104: Middle East and Africa Market Volume (Units) Forecast by End User, 2020-2035
  • Table 105: Middle East and Africa Market Value (USD Million) Forecast by Deployment Mode, 2020-2035
  • Table 106: Middle East and Africa Market Volume (Units) Forecast by Deployment Mode, 2020-2035
  • Table 107: Middle East and Africa Market Value (USD Million) Forecast by Product Type, 2020-2035
  • Table 108: Middle East and Africa Market Volume (Units) Forecast by Product Type, 2020-2035
  • Table 109: Middle East and Africa Market Value (USD Million) Forecast by Company Type, 2020-2035
  • Table 110: Middle East and Africa Market Volume (Units) Forecast by Company Type, 2020-2035
  • Table 111: Middle East and Africa Market Value (USD Million) Forecast by Consumer Type, 2020-2035
  • Table 112: Middle East and Africa Market Volume (Units) Forecast by Consumer Type, 2020-2035

List of Figures

  • Figure 1: Global Market Value (USD Million) by Type of Offering, 2025-2035
  • Figure 2: Global Market Value (USD Million) by Functionality, 2025-2035
  • Figure 3: Global Market Value (USD Million) by End User, 2025-2035
  • Figure 4: Global Market Value (USD Million) by Deployment Mode, 2025-2035
  • Figure 5: Global Market Value (USD Million) by Product Type, 2025-2035
  • Figure 6: Global Market Value (USD Million) by Company Type, 2025-2035
  • Figure 7: Global Market Value (USD Million) by Consumer Type, 2025-2035
  • Figure 8: Global Market Value (USD Million) by Region, 2025-2035
  • Figure 9: Global Market Value (USD Million) Analysis by Region, 2020-2035
  • Figure 10: Global Market Volume (Units) Analysis by Region, 2020-2035
  • Figure 11: Global Market Value Share (%) and BPS Analysis by Region, 2025-2035
  • Figure 12: Global Market Y-o-Y Growth (%) Projections by Region, 2025-2035
  • Figure 13: Global Market Value (USD Million) Analysis by Type of Offering, 2020-2035
  • Figure 14: Global Market Volume (Units) Analysis by Type of Offering, 2020-2035
  • Figure 15: Global Market Value Share (%) and BPS Analysis by Type of Offering, 2025-2035
  • Figure 16: Global Market Y-o-Y Growth (%) Projections by Type of Offering, 2025-2035
  • Figure 17: Global Market Value (USD Million) Analysis by Functionality, 2020-2035
  • Figure 18: Global Market Volume (Units) Analysis by Functionality, 2020-2035
  • Figure 19: Global Market Value Share (%) and BPS Analysis by Functionality, 2025-2035
  • Figure 20: Global Market Y-o-Y Growth (%) Projections by Functionality, 2025-2035
  • Figure 21: Global Market Value (USD Million) Analysis by End User, 2020-2035
  • Figure 22: Global Market Volume (Units) Analysis by End User, 2020-2035
  • Figure 23: Global Market Value Share (%) and BPS Analysis by End User, 2025-2035
  • Figure 24: Global Market Y-o-Y Growth (%) Projections by End User, 2025-2035
  • Figure 25: Global Market Value (USD Million) Analysis by Deployment Mode, 2020-2035
  • Figure 26: Global Market Volume (Units) Analysis by Deployment Mode, 2020-2035
  • Figure 27: Global Market Value Share (%) and BPS Analysis by Deployment Mode, 2025-2035
  • Figure 28: Global Market Y-o-Y Growth (%) Projections by Deployment Mode, 2025-2035
  • Figure 29: Global Market Value (USD Million) Analysis by Product Type, 2020-2035
  • Figure 30: Global Market Volume (Units) Analysis by Product Type, 2020-2035
  • Figure 31: Global Market Value Share (%) and BPS Analysis by Product Type, 2025-2035
  • Figure 32: Global Market Y-o-Y Growth (%) Projections by Product Type, 2025-2035
  • Figure 33: Global Market Value (USD Million) Analysis by Company Type, 2020-2035
  • Figure 34: Global Market Volume (Units) Analysis by Company Type, 2020-2035
  • Figure 35: Global Market Value Share (%) and BPS Analysis by Company Type, 2025-2035
  • Figure 36: Global Market Y-o-Y Growth (%) Projections by Company Type, 2025-2035
  • Figure 37: Global Market Value (USD Million) Analysis by Consumer Type, 2020-2035
  • Figure 38: Global Market Volume (Units) Analysis by Consumer Type, 2020-2035
  • Figure 39: Global Market Value Share (%) and BPS Analysis by Consumer Type, 2025-2035
  • Figure 40: Global Market Y-o-Y Growth (%) Projections by Consumer Type, 2025-2035
  • Figure 41: Global Market Attractiveness by Type of Offering, 2025-2035
  • Figure 42: Global Market Attractiveness by Functionality, 2025-2035
  • Figure 43: Global Market Attractiveness by End User, 2025-2035
  • Figure 44: Global Market Attractiveness by Deployment Mode, 2025-2035
  • Figure 45: Global Market Attractiveness by Product Type, 2025-2035
  • Figure 46: Global Market Attractiveness by Company Type, 2025-2035
  • Figure 47: Global Market Attractiveness by Consumer Type, 2025-2035
  • Figure 48: Global Market Attractiveness by Region, 2025-2035
  • Figure 49: North America Market Value (USD Million) by Type of Offering, 2025-2035
  • Figure 50: North America Market Value (USD Million) by Functionality, 2025-2035
  • Figure 51: North America Market Value (USD Million) by End User, 2025-2035
  • Figure 52: North America Market Value (USD Million) by Deployment Mode, 2025-2035
  • Figure 53: North America Market Value (USD Million) by Product Type, 2025-2035
  • Figure 54: North America Market Value (USD Million) by Company Type, 2025-2035
  • Figure 55: North America Market Value (USD Million) by Consumer Type, 2025-2035
  • Figure 56: North America Market Value (USD Million) by Country, 2025-2035
  • Figure 57: North America Market Value (USD Million) Analysis by Country, 2020-2035
  • Figure 58: North America Market Volume (Units) Analysis by Country, 2020-2035
  • Figure 59: North America Market Value Share (%) and BPS Analysis by Country, 2025-2035
  • Figure 60: North America Market Y-o-Y Growth (%) Projections by Country, 2025-2035
  • Figure 61: North America Market Value (USD Million) Analysis by Type of Offering, 2020-2035
  • Figure 62: North America Market Volume (Units) Analysis by Type of Offering, 2020-2035
  • Figure 63: North America Market Value Share (%) and BPS Analysis by Type of Offering, 2025-2035
  • Figure 64: North America Market Y-o-Y Growth (%) Projections by Type of Offering, 2025-2035
  • Figure 65: North America Market Value (USD Million) Analysis by Functionality, 2020-2035
  • Figure 66: North America Market Volume (Units) Analysis by Functionality, 2020-2035
  • Figure 67: North America Market Value Share (%) and BPS Analysis by Functionality, 2025-2035
  • Figure 68: North America Market Y-o-Y Growth (%) Projections by Functionality, 2025-2035
  • Figure 69: North America Market Value (USD Million) Analysis by End User, 2020-2035
  • Figure 70: North America Market Volume (Units) Analysis by End User, 2020-2035
  • Figure 71: North America Market Value Share (%) and BPS Analysis by End User, 2025-2035
  • Figure 72: North America Market Y-o-Y Growth (%) Projections by End User, 2025-2035
  • Figure 73: North America Market Value (USD Million) Analysis by Deployment Mode, 2020-2035
  • Figure 74: North America Market Volume (Units) Analysis by Deployment Mode, 2020-2035
  • Figure 75: North America Market Value Share (%) and BPS Analysis by Deployment Mode, 2025-2035
  • Figure 76: North America Market Y-o-Y Growth (%) Projections by Deployment Mode, 2025-2035
  • Figure 77: North America Market Value (USD Million) Analysis by Product Type, 2020-2035
  • Figure 78: North America Market Volume (Units) Analysis by Product Type, 2020-2035
  • Figure 79: North America Market Value Share (%) and BPS Analysis by Product Type, 2025-2035
  • Figure 80: North America Market Y-o-Y Growth (%) Projections by Product Type, 2025-2035
  • Figure 81: North America Market Value (USD Million) Analysis by Company Type, 2020-2035
  • Figure 82: North America Market Volume (Units) Analysis by Company Type, 2020-2035
  • Figure 83: North America Market Value Share (%) and BPS Analysis by Company Type, 2025-2035
  • Figure 84: North America Market Y-o-Y Growth (%) Projections by Company Type, 2025-2035
  • Figure 85: North America Market Value (USD Million) Analysis by Consumer Type, 2020-2035
  • Figure 86: North America Market Volume (Units) Analysis by Consumer Type, 2020-2035
  • Figure 87: North America Market Value Share (%) and BPS Analysis by Consumer Type, 2025-2035
  • Figure 88: North America Market Y-o-Y Growth (%) Projections by Consumer Type, 2025-2035
  • Figure 89: North America Market Attractiveness by Type of Offering, 2025-2035
  • Figure 90: North America Market Attractiveness by Functionality, 2025-2035
  • Figure 91: North America Market Attractiveness by End User, 2025-2035
  • Figure 92: North America Market Attractiveness by Deployment Mode, 2025-2035
  • Figure 93: North America Market Attractiveness by Product Type, 2025-2035
  • Figure 94: North America Market Attractiveness by Company Type, 2025-2035
  • Figure 95: North America Market Attractiveness by Consumer Type, 2025-2035
  • Figure 96: North America Market Attractiveness by Country, 2025-2035
  • Figure 97: Latin America Market Value (USD Million) by Type of Offering, 2025-2035
  • Figure 98: Latin America Market Value (USD Million) by Functionality, 2025-2035
  • Figure 99: Latin America Market Value (USD Million) by End User, 2025-2035
  • Figure 100: Latin America Market Value (USD Million) by Deployment Mode, 2025-2035
  • Figure 101: Latin America Market Value (USD Million) by Product Type, 2025-2035
  • Figure 102: Latin America Market Value (USD Million) by Company Type, 2025-2035
  • Figure 103: Latin America Market Value (USD Million) by Consumer Type, 2025-2035
  • Figure 104: Latin America Market Value (USD Million) by Country, 2025-2035
  • Figure 105: Latin America Market Value (USD Million) Analysis by Country, 2020-2035
  • Figure 106: Latin America Market Volume (Units) Analysis by Country, 2020-2035
  • Figure 107: Latin America Market Value Share (%) and BPS Analysis by Country, 2025-2035
  • Figure 108: Latin America Market Y-o-Y Growth (%) Projections by Country, 2025-2035
  • Figure 109: Latin America Market Value (USD Million) Analysis by Type of Offering, 2020-2035
  • Figure 110: Latin America Market Volume (Units) Analysis by Type of Offering, 2020-2035
  • Figure 111: Latin America Market Value Share (%) and BPS Analysis by Type of Offering, 2025-2035
  • Figure 112: Latin America Market Y-o-Y Growth (%) Projections by Type of Offering, 2025-2035
  • Figure 113: Latin America Market Value (USD Million) Analysis by Functionality, 2020-2035
  • Figure 114: Latin America Market Volume (Units) Analysis by Functionality, 2020-2035
  • Figure 115: Latin America Market Value Share (%) and BPS Analysis by Functionality, 2025-2035
  • Figure 116: Latin America Market Y-o-Y Growth (%) Projections by Functionality, 2025-2035
  • Figure 117: Latin America Market Value (USD Million) Analysis by End User, 2020-2035
  • Figure 118: Latin America Market Volume (Units) Analysis by End User, 2020-2035
  • Figure 119: Latin America Market Value Share (%) and BPS Analysis by End User, 2025-2035
  • Figure 120: Latin America Market Y-o-Y Growth (%) Projections by End User, 2025-2035
  • Figure 121: Latin America Market Value (USD Million) Analysis by Deployment Mode, 2020-2035
  • Figure 122: Latin America Market Volume (Units) Analysis by Deployment Mode, 2020-2035
  • Figure 123: Latin America Market Value Share (%) and BPS Analysis by Deployment Mode, 2025-2035
  • Figure 124: Latin America Market Y-o-Y Growth (%) Projections by Deployment Mode, 2025-2035
  • Figure 125: Latin America Market Value (USD Million) Analysis by Product Type, 2020-2035
  • Figure 126: Latin America Market Volume (Units) Analysis by Product Type, 2020-2035
  • Figure 127: Latin America Market Value Share (%) and BPS Analysis by Product Type, 2025-2035
  • Figure 128: Latin America Market Y-o-Y Growth (%) Projections by Product Type, 2025-2035
  • Figure 129: Latin America Market Value (USD Million) Analysis by Company Type, 2020-2035
  • Figure 130: Latin America Market Volume (Units) Analysis by Company Type, 2020-2035
  • Figure 131: Latin America Market Value Share (%) and BPS Analysis by Company Type, 2025-2035
  • Figure 132: Latin America Market Y-o-Y Growth (%) Projections by Company Type, 2025-2035
  • Figure 133: Latin America Market Value (USD Million) Analysis by Consumer Type, 2020-2035
  • Figure 134: Latin America Market Volume (Units) Analysis by Consumer Type, 2020-2035
  • Figure 135: Latin America Market Value Share (%) and BPS Analysis by Consumer Type, 2025-2035
  • Figure 136: Latin America Market Y-o-Y Growth (%) Projections by Consumer Type, 2025-2035
  • Figure 137: Latin America Market Attractiveness by Type of Offering, 2025-2035
  • Figure 138: Latin America Market Attractiveness by Functionality, 2025-2035
  • Figure 139: Latin America Market Attractiveness by End User, 2025-2035
  • Figure 140: Latin America Market Attractiveness by Deployment Mode, 2025-2035
  • Figure 141: Latin America Market Attractiveness by Product Type, 2025-2035
  • Figure 142: Latin America Market Attractiveness by Company Type, 2025-2035
  • Figure 143: Latin America Market Attractiveness by Consumer Type, 2025-2035
  • Figure 144: Latin America Market Attractiveness by Country, 2025-2035
  • Figure 145: Europe Market Value (USD Million) by Type of Offering, 2025-2035
  • Figure 146: Europe Market Value (USD Million) by Functionality, 2025-2035
  • Figure 147: Europe Market Value (USD Million) by End User, 2025-2035
  • Figure 148: Europe Market Value (USD Million) by Deployment Mode, 2025-2035
  • Figure 149: Europe Market Value (USD Million) by Product Type, 2025-2035
  • Figure 150: Europe Market Value (USD Million) by Company Type, 2025-2035
  • Figure 151: Europe Market Value (USD Million) by Consumer Type, 2025-2035
  • Figure 152: Europe Market Value (USD Million) by Country, 2025-2035
  • Figure 153: Europe Market Value (USD Million) Analysis by Country, 2020-2035
  • Figure 154: Europe Market Volume (Units) Analysis by Country, 2020-2035
  • Figure 155: Europe Market Value Share (%) and BPS Analysis by Country, 2025-2035
  • Figure 156: Europe Market Y-o-Y Growth (%) Projections by Country, 2025-2035
  • Figure 157: Europe Market Value (USD Million) Analysis by Type of Offering, 2020-2035
  • Figure 158: Europe Market Volume (Units) Analysis by Type of Offering, 2020-2035
  • Figure 159: Europe Market Value Share (%) and BPS Analysis by Type of Offering, 2025-2035
  • Figure 160: Europe Market Y-o-Y Growth (%) Projections by Type of Offering, 2025-2035
  • Figure 161: Europe Market Value (USD Million) Analysis by Functionality, 2020-2035
  • Figure 162: Europe Market Volume (Units) Analysis by Functionality, 2020-2035
  • Figure 163: Europe Market Value Share (%) and BPS Analysis by Functionality, 2025-2035
  • Figure 164: Europe Market Y-o-Y Growth (%) Projections by Functionality, 2025-2035
  • Figure 165: Europe Market Value (USD Million) Analysis by End User, 2020-2035
  • Figure 166: Europe Market Volume (Units) Analysis by End User, 2020-2035
  • Figure 167: Europe Market Value Share (%) and BPS Analysis by End User, 2025-2035
  • Figure 168: Europe Market Y-o-Y Growth (%) Projections by End User, 2025-2035
  • Figure 169: Europe Market Value (USD Million) Analysis by Deployment Mode, 2020-2035
  • Figure 170: Europe Market Volume (Units) Analysis by Deployment Mode, 2020-2035
  • Figure 171: Europe Market Value Share (%) and BPS Analysis by Deployment Mode, 2025-2035
  • Figure 172: Europe Market Y-o-Y Growth (%) Projections by Deployment Mode, 2025-2035
  • Figure 173: Europe Market Value (USD Million) Analysis by Product Type, 2020-2035
  • Figure 174: Europe Market Volume (Units) Analysis by Product Type, 2020-2035
  • Figure 175: Europe Market Value Share (%) and BPS Analysis by Product Type, 2025-2035
  • Figure 176: Europe Market Y-o-Y Growth (%) Projections by Product Type, 2025-2035
  • Figure 177: Europe Market Value (USD Million) Analysis by Company Type, 2020-2035
  • Figure 178: Europe Market Volume (Units) Analysis by Company Type, 2020-2035
  • Figure 179: Europe Market Value Share (%) and BPS Analysis by Company Type, 2025-2035
  • Figure 180: Europe Market Y-o-Y Growth (%) Projections by Company Type, 2025-2035
  • Figure 181: Europe Market Value (USD Million) Analysis by Consumer Type, 2020-2035
  • Figure 182: Europe Market Volume (Units) Analysis by Consumer Type, 2020-2035
  • Figure 183: Europe Market Value Share (%) and BPS Analysis by Consumer Type, 2025-2035
  • Figure 184: Europe Market Y-o-Y Growth (%) Projections by Consumer Type, 2025-2035
  • Figure 185: Europe Market Attractiveness by Type of Offering, 2025-2035
  • Figure 186: Europe Market Attractiveness by Functionality, 2025-2035
  • Figure 187: Europe Market Attractiveness by End User, 2025-2035
  • Figure 188: Europe Market Attractiveness by Deployment Mode, 2025-2035
  • Figure 189: Europe Market Attractiveness by Product Type, 2025-2035
  • Figure 190: Europe Market Attractiveness by Company Type, 2025-2035
  • Figure 191: Europe Market Attractiveness by Consumer Type, 2025-2035
  • Figure 192: Europe Market Attractiveness by Country, 2025-2035
  • Figure 193: East Asia Market Value (USD Million) by Type of Offering, 2025-2035
  • Figure 194: East Asia Market Value (USD Million) by Functionality, 2025-2035
  • Figure 195: East Asia Market Value (USD Million) by End User, 2025-2035
  • Figure 196: East Asia Market Value (USD Million) by Deployment Mode, 2025-2035
  • Figure 197: East Asia Market Value (USD Million) by Product Type, 2025-2035
  • Figure 198: East Asia Market Value (USD Million) by Company Type, 2025-2035
  • Figure 199: East Asia Market Value (USD Million) by Consumer Type, 2025-2035
  • Figure 200: East Asia Market Value (USD Million) by Country, 2025-2035
  • Figure 201: East Asia Market Value (USD Million) Analysis by Country, 2020-2035
  • Figure 202: East Asia Market Volume (Units) Analysis by Country, 2020-2035
  • Figure 203: East Asia Market Value Share (%) and BPS Analysis by Country, 2025-2035
  • Figure 204: East Asia Market Y-o-Y Growth (%) Projections by Country, 2025-2035
  • Figure 205: East Asia Market Value (USD Million) Analysis by Type of Offering, 2020-2035
  • Figure 206: East Asia Market Volume (Units) Analysis by Type of Offering, 2020-2035
  • Figure 207: East Asia Market Value Share (%) and BPS Analysis by Type of Offering, 2025-2035
  • Figure 208: East Asia Market Y-o-Y Growth (%) Projections by Type of Offering, 2025-2035
  • Figure 209: East Asia Market Value (USD Million) Analysis by Functionality, 2020-2035
  • Figure 210: East Asia Market Volume (Units) Analysis by Functionality, 2020-2035
  • Figure 211: East Asia Market Value Share (%) and BPS Analysis by Functionality, 2025-2035
  • Figure 212: East Asia Market Y-o-Y Growth (%) Projections by Functionality, 2025-2035
  • Figure 213: East Asia Market Value (USD Million) Analysis by End User, 2020-2035
  • Figure 214: East Asia Market Volume (Units) Analysis by End User, 2020-2035
  • Figure 215: East Asia Market Value Share (%) and BPS Analysis by End User, 2025-2035
  • Figure 216: East Asia Market Y-o-Y Growth (%) Projections by End User, 2025-2035
  • Figure 217: East Asia Market Value (USD Million) Analysis by Deployment Mode, 2020-2035
  • Figure 218: East Asia Market Volume (Units) Analysis by Deployment Mode, 2020-2035
  • Figure 219: East Asia Market Value Share (%) and BPS Analysis by Deployment Mode, 2025-2035
  • Figure 220: East Asia Market Y-o-Y Growth (%) Projections by Deployment Mode, 2025-2035
  • Figure 221: East Asia Market Value (USD Million) Analysis by Product Type, 2020-2035
  • Figure 222: East Asia Market Volume (Units) Analysis by Product Type, 2020-2035
  • Figure 223: East Asia Market Value Share (%) and BPS Analysis by Product Type, 2025-2035
  • Figure 224: East Asia Market Y-o-Y Growth (%) Projections by Product Type, 2025-2035
  • Figure 225: East Asia Market Value (USD Million) Analysis by Company Type, 2020-2035
  • Figure 226: East Asia Market Volume (Units) Analysis by Company Type, 2020-2035
  • Figure 227: East Asia Market Value Share (%) and BPS Analysis by Company Type, 2025-2035
  • Figure 228: East Asia Market Y-o-Y Growth (%) Projections by Company Type, 2025-2035
  • Figure 229: East Asia Market Value (USD Million) Analysis by Consumer Type, 2020-2035
  • Figure 230: East Asia Market Volume (Units) Analysis by Consumer Type, 2020-2035
  • Figure 231: East Asia Market Value Share (%) and BPS Analysis by Consumer Type, 2025-2035
  • Figure 232: East Asia Market Y-o-Y Growth (%) Projections by Consumer Type, 2025-2035
  • Figure 233: East Asia Market Attractiveness by Type of Offering, 2025-2035
  • Figure 234: East Asia Market Attractiveness by Functionality, 2025-2035
  • Figure 235: East Asia Market Attractiveness by End User, 2025-2035
  • Figure 236: East Asia Market Attractiveness by Deployment Mode, 2025-2035
  • Figure 237: East Asia Market Attractiveness by Product Type, 2025-2035
  • Figure 238: East Asia Market Attractiveness by Company Type, 2025-2035
  • Figure 239: East Asia Market Attractiveness by Consumer Type, 2025-2035
  • Figure 240: East Asia Market Attractiveness by Country, 2025-2035
  • Figure 241: South Asia & Pacific Market Value (USD Million) by Type of Offering, 2025-2035
  • Figure 242: South Asia & Pacific Market Value (USD Million) by Functionality, 2025-2035
  • Figure 243: South Asia & Pacific Market Value (USD Million) by End User, 2025-2035
  • Figure 244: South Asia & Pacific Market Value (USD Million) by Deployment Mode, 2025-2035
  • Figure 245: South Asia & Pacific Market Value (USD Million) by Product Type, 2025-2035
  • Figure 246: South Asia & Pacific Market Value (USD Million) by Company Type, 2025-2035
  • Figure 247: South Asia & Pacific Market Value (USD Million) by Consumer Type, 2025-2035
  • Figure 248: South Asia & Pacific Market Value (USD Million) by Country, 2025-2035
  • Figure 249: South Asia & Pacific Market Value (USD Million) Analysis by Country, 2020-2035
  • Figure 250: South Asia & Pacific Market Volume (Units) Analysis by Country, 2020-2035
  • Figure 251: South Asia & Pacific Market Value Share (%) and BPS Analysis by Country, 2025-2035
  • Figure 252: South Asia & Pacific Market Y-o-Y Growth (%) Projections by Country, 2025-2035
  • Figure 253: South Asia & Pacific Market Value (USD Million) Analysis by Type of Offering, 2020-2035
  • Figure 254: South Asia & Pacific Market Volume (Units) Analysis by Type of Offering, 2020-2035
  • Figure 255: South Asia & Pacific Market Value Share (%) and BPS Analysis by Type of Offering, 2025-2035
  • Figure 256: South Asia & Pacific Market Y-o-Y Growth (%) Projections by Type of Offering, 2025-2035
  • Figure 257: South Asia & Pacific Market Value (USD Million) Analysis by Functionality, 2020-2035
  • Figure 258: South Asia & Pacific Market Volume (Units) Analysis by Functionality, 2020-2035
  • Figure 259: South Asia & Pacific Market Value Share (%) and BPS Analysis by Functionality, 2025-2035
  • Figure 260: South Asia & Pacific Market Y-o-Y Growth (%) Projections by Functionality, 2025-2035
  • Figure 261: South Asia & Pacific Market Value (USD Million) Analysis by End User, 2020-2035
  • Figure 262: South Asia & Pacific Market Volume (Units) Analysis by End User, 2020-2035
  • Figure 263: South Asia & Pacific Market Value Share (%) and BPS Analysis by End User, 2025-2035
  • Figure 264: South Asia & Pacific Market Y-o-Y Growth (%) Projections by End User, 2025-2035
  • Figure 265: South Asia & Pacific Market Value (USD Million) Analysis by Deployment Mode, 2020-2035
  • Figure 266: South Asia & Pacific Market Volume (Units) Analysis by Deployment Mode, 2020-2035
  • Figure 267: South Asia & Pacific Market Value Share (%) and BPS Analysis by Deployment Mode, 2025-2035
  • Figure 268: South Asia & Pacific Market Y-o-Y Growth (%) Projections by Deployment Mode, 2025-2035
  • Figure 269: South Asia & Pacific Market Value (USD Million) Analysis by Product Type, 2020-2035
  • Figure 270: South Asia & Pacific Market Volume (Units) Analysis by Product Type, 2020-2035
  • Figure 271: South Asia & Pacific Market Value Share (%) and BPS Analysis by Product Type, 2025-2035
  • Figure 272: South Asia & Pacific Market Y-o-Y Growth (%) Projections by Product Type, 2025-2035
  • Figure 273: South Asia & Pacific Market Value (USD Million) Analysis by Company Type, 2020-2035
  • Figure 274: South Asia & Pacific Market Volume (Units) Analysis by Company Type, 2020-2035
  • Figure 275: South Asia & Pacific Market Value Share (%) and BPS Analysis by Company Type, 2025-2035
  • Figure 276: South Asia & Pacific Market Y-o-Y Growth (%) Projections by Company Type, 2025-2035
  • Figure 277: South Asia & Pacific Market Value (USD Million) Analysis by Consumer Type, 2020-2035
  • Figure 278: South Asia & Pacific Market Volume (Units) Analysis by Consumer Type, 2020-2035
  • Figure 279: South Asia & Pacific Market Value Share (%) and BPS Analysis by Consumer Type, 2025-2035
  • Figure 280: South Asia & Pacific Market Y-o-Y Growth (%) Projections by Consumer Type, 2025-2035
  • Figure 281: South Asia & Pacific Market Attractiveness by Type of Offering, 2025-2035
  • Figure 282: South Asia & Pacific Market Attractiveness by Functionality, 2025-2035
  • Figure 283: South Asia & Pacific Market Attractiveness by End User, 2025-2035
  • Figure 284: South Asia & Pacific Market Attractiveness by Deployment Mode, 2025-2035
  • Figure 285: South Asia & Pacific Market Attractiveness by Product Type, 2025-2035
  • Figure 286: South Asia & Pacific Market Attractiveness by Company Type, 2025-2035
  • Figure 287: South Asia & Pacific Market Attractiveness by Consumer Type, 2025-2035
  • Figure 288: South Asia & Pacific Market Attractiveness by Country, 2025-2035
  • Figure 289: Middle East and Africa Market Value (USD Million) by Type of Offering, 2025-2035
  • Figure 290: Middle East and Africa Market Value (USD Million) by Functionality, 2025-2035
  • Figure 291: Middle East and Africa Market Value (USD Million) by End User, 2025-2035
  • Figure 292: Middle East and Africa Market Value (USD Million) by Deployment Mode, 2025-2035
  • Figure 293: Middle East and Africa Market Value (USD Million) by Product Type, 2025-2035
  • Figure 294: Middle East and Africa Market Value (USD Million) by Company Type, 2025-2035
  • Figure 295: Middle East and Africa Market Value (USD Million) by Consumer Type, 2025-2035
  • Figure 296: Middle East and Africa Market Value (USD Million) by Country, 2025-2035
  • Figure 297: Middle East and Africa Market Value (USD Million) Analysis by Country, 2020-2035
  • Figure 298: Middle East and Africa Market Volume (Units) Analysis by Country, 2020-2035
  • Figure 299: Middle East and Africa Market Value Share (%) and BPS Analysis by Country, 2025-2035
  • Figure 300: Middle East and Africa Market Y-o-Y Growth (%) Projections by Country, 2025-2035
  • Figure 301: Middle East and Africa Market Value (USD Million) Analysis by Type of Offering, 2020-2035
  • Figure 302: Middle East and Africa Market Volume (Units) Analysis by Type of Offering, 2020-2035
  • Figure 303: Middle East and Africa Market Value Share (%) and BPS Analysis by Type of Offering, 2025-2035
  • Figure 304: Middle East and Africa Market Y-o-Y Growth (%) Projections by Type of Offering, 2025-2035
  • Figure 305: Middle East and Africa Market Value (USD Million) Analysis by Functionality, 2020-2035
  • Figure 306: Middle East and Africa Market Volume (Units) Analysis by Functionality, 2020-2035
  • Figure 307: Middle East and Africa Market Value Share (%) and BPS Analysis by Functionality, 2025-2035
  • Figure 308: Middle East and Africa Market Y-o-Y Growth (%) Projections by Functionality, 2025-2035
  • Figure 309: Middle East and Africa Market Value (USD Million) Analysis by End User, 2020-2035
  • Figure 310: Middle East and Africa Market Volume (Units) Analysis by End User, 2020-2035
  • Figure 311: Middle East and Africa Market Value Share (%) and BPS Analysis by End User, 2025-2035
  • Figure 312: Middle East and Africa Market Y-o-Y Growth (%) Projections by End User, 2025-2035
  • Figure 313: Middle East and Africa Market Value (USD Million) Analysis by Deployment Mode, 2020-2035
  • Figure 314: Middle East and Africa Market Volume (Units) Analysis by Deployment Mode, 2020-2035
  • Figure 315: Middle East and Africa Market Value Share (%) and BPS Analysis by Deployment Mode, 2025-2035
  • Figure 316: Middle East and Africa Market Y-o-Y Growth (%) Projections by Deployment Mode, 2025-2035
  • Figure 317: Middle East and Africa Market Value (USD Million) Analysis by Product Type, 2020-2035
  • Figure 318: Middle East and Africa Market Volume (Units) Analysis by Product Type, 2020-2035
  • Figure 319: Middle East and Africa Market Value Share (%) and BPS Analysis by Product Type, 2025-2035
  • Figure 320: Middle East and Africa Market Y-o-Y Growth (%) Projections by Product Type, 2025-2035
  • Figure 321: Middle East and Africa Market Value (USD Million) Analysis by Company Type, 2020-2035
  • Figure 322: Middle East and Africa Market Volume (Units) Analysis by Company Type, 2020-2035
  • Figure 323: Middle East and Africa Market Value Share (%) and BPS Analysis by Company Type, 2025-2035
  • Figure 324: Middle East and Africa Market Y-o-Y Growth (%) Projections by Company Type, 2025-2035
  • Figure 325: Middle East and Africa Market Value (USD Million) Analysis by Consumer Type, 2020-2035
  • Figure 326: Middle East and Africa Market Volume (Units) Analysis by Consumer Type, 2020-2035
  • Figure 327: Middle East and Africa Market Value Share (%) and BPS Analysis by Consumer Type, 2025-2035
  • Figure 328: Middle East and Africa Market Y-o-Y Growth (%) Projections by Consumer Type, 2025-2035
  • Figure 329: Middle East and Africa Market Attractiveness by Type of Offering, 2025-2035
  • Figure 330: Middle East and Africa Market Attractiveness by Functionality, 2025-2035
  • Figure 331: Middle East and Africa Market Attractiveness by End User, 2025-2035
  • Figure 332: Middle East and Africa Market Attractiveness by Deployment Mode, 2025-2035
  • Figure 333: Middle East and Africa Market Attractiveness by Product Type, 2025-2035
  • Figure 334: Middle East and Africa Market Attractiveness by Company Type, 2025-2035
  • Figure 335: Middle East and Africa Market Attractiveness by Consumer Type, 2025-2035
  • Figure 336: Middle East and Africa Market Attractiveness by Country, 2025-2035
Dashboard
Dashboard
Dashboard
Dashboard
Dashboard
Dashboard

Full Research Suite comprises of:

Market outlook & trends analysis

Market outlook & trends analysis

Interviews & case studies

Interviews & case studies

Strategic recommendations

Strategic recommendations

Vendor profiles & capabilities analysis

Vendor profiles & capabilities analysis

5-year forecasts

5-year forecasts

8 regions and 60+ country-level data splits

8 regions and 60+ country-level data splits

Market segment data splits

Market segment data splits

12 months of continuous data updates

12 months of continuous data updates

DELIVERED AS:

PDF EXCEL ONLINE

Full Research Suite


$2000

$3500

$5000

Buy Report Now
Similar Industry Reports

Similar Industry Reports

Airport Ground Transportation Market

Airport Ground Transportation Market Forecast and Outlook 2025 to 2035

AI Waste Sorting Robots Market

AI Waste Sorting Robots Market Forecast and Outlook 2025 to 2035

AI Image Editor Market

AI Image Editor Market Forecast and Outlook 2025 to 2035

Airless Sprayer Accessories Market

Airless Sprayer Accessories Market Size and Share Forecast Outlook 2025 to 2035

Air Purge Valve Market

Air Purge Valve Market Size and Share Forecast Outlook 2025 to 2035

AI Demand Forecasting Software Market

AI Demand Forecasting Software Market Size and Share Forecast Outlook 2025 to 2035

Air Flow Sensors Market

Air Flow Sensors Market Size and Share Forecast Outlook 2025 to 2035

Air Separation Plant Market

Air Separation Plant Market Size and Share Forecast Outlook 2025 to 2035

Air Cooled Turbo Generators Market

Air Cooled Turbo Generators Market Size and Share Forecast Outlook 2025 to 2035

Aircraft Cooling Turbines Market

Aircraft Cooling Turbines Market Size and Share Forecast Outlook 2025 to 2035

Air Conditioning Compressor Market

Air Conditioning Compressor Market Size and Share Forecast Outlook 2025 to 2035

Air Measuring Equipment Market

Air Measuring Equipment Market Size and Share Forecast Outlook 2025 to 2035

Aircraft Smoke Detection and Fire Extinguishing System Market

Aircraft Smoke Detection and Fire Extinguishing System Market Size and Share Forecast Outlook 2025 to 2035

Aircraft Hose Fittings Market

Aircraft Hose Fittings Market Size and Share Forecast Outlook 2025 to 2035

Aircraft Cabin Interior Market

Aircraft Cabin Interior Market Size and Share Forecast Outlook 2025 to 2035

Aircraft Galley Systems Market

Aircraft Galley Systems Market Size and Share Forecast Outlook 2025 to 2035

Aircraft Interior Lighting Market

Aircraft Interior Lighting Market Size and Share Forecast Outlook 2025 to 2035

Aircraft Battery Market

Aircraft Battery Market Size and Share Forecast Outlook 2025 to 2035

Aircraft Floor Panels Market

Aircraft Floor Panels Market Size and Share Forecast Outlook 2025 to 2035

Aircraft Fuel Systems Market

Aircraft Fuel Systems Market Size and Share Forecast Outlook 2025 to 2035

Future Market Insights

AI Makeup Market

Chat With MaRIA

Chat With

MaRIA

Hi There, I am MaRIA, Your Market Research Intelligence Assistant. How may I help you?