Air Cargo Market Size, Share, and Forecast Outlook 2025 to 2035

The air cargo market is valued at USD 250 billion in 2025 and is expected to reach USD 420 billion by 2035, growing at a CAGR of 5.3%.
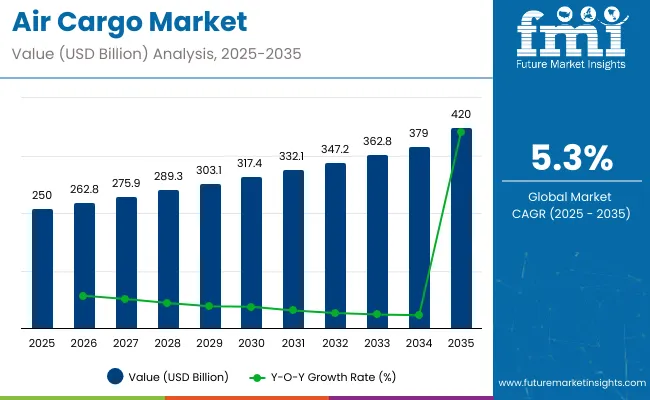
Quick Stats of Air Cargo Market

  • Air Cargo Market Size (2025): USD 250 billion
  • Projected Air Cargo Market Size (2035): USD 420 billion
  • Forecast CAGR of Air Cargo Market (2025 to 2035): 5.3%
  • Leading Type in Air Cargo Market (2025): Air Freight with 70% share
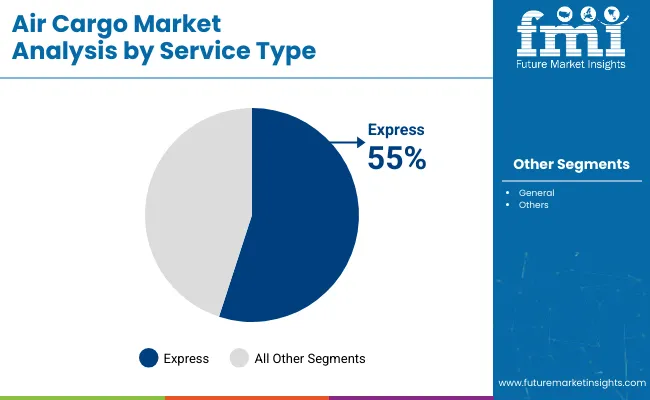
  • Leading Service in Air Cargo Market (2025): Express with 55% share
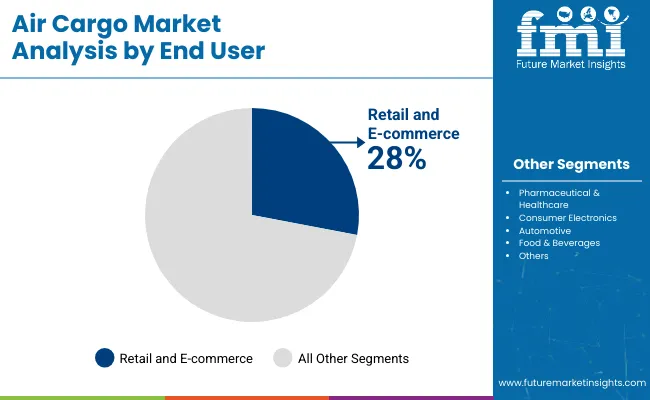
  • Leading End User in Air Cargo Market (2025): Retail and E-commerce with 28% share
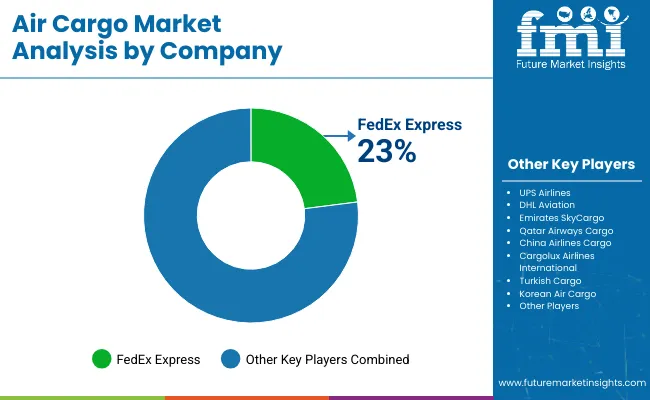
  • Leading Players in Air Cargo Market (2025): FedEx Express, UPS Airlines, DHL Aviation

Air Cargo Market

Metric Value
Industry Size (2025E) USD 250 billion
Industry Value (2035F) USD 420 billion
CAGR (2025 to 2035) 5.3%

Saturation point analysis shows that growth will gradually moderate as key markets approach full utilization of existing air freight capacity and infrastructure. Mature regions, including North America and Europe, are nearing operational limits at major hubs, where incremental demand will increasingly be addressed through efficiency improvements rather than network expansion.

Emerging regions, particularly Asia Pacific and parts of the Middle East, continue to present growth opportunities with new cargo hubs, fleet additions, and expanding logistics networks. Short-term variability in demand is influenced by seasonal trade cycles, fuel price changes, and global economic conditions, yet the long-term trajectory remains positive. Saturation points are further shaped by technological adoption, including automated cargo handling, larger freighter aircraft, and digital tracking systems, which enhance capacity without proportional infrastructure investment. Monitoring saturation trends enables stakeholders to optimize operations, integrate technology, and plan strategic routes, ensuring continued value creation. Even as mature markets stabilize, regional expansion and process improvements allow the market to sustain steady growth and strengthen its overall resilience over the decade.

The air cargo market is influenced by several core sectors. Airline operators and freighters represent around 43%, managing the majority of cargo transport and fleet operations. Logistics and freight forwarding companies contribute approximately 27%, coordinating shipment routing, customs clearance, and supply chain management. Airport infrastructure and ground handling services account for nearly 15%, providing warehousing, loading, and cargo handling facilities. E-commerce and retail shippers make up close to 10%, driving demand for express air shipments. Aviation technology and tracking solutions comprise the remaining 5%, offering cargo monitoring, security, and fleet optimization systems.

The air cargo sector has seen strong growth due to e-commerce expansion and global trade recovery. Global air freight volumes reached over 65 million tons in 2024, representing a 6% increase year-on-year. Express shipments for high-value goods now constitute nearly 30% of total cargo revenue, while perishables and pharmaceuticals are rising segments. Digital tracking and AI-based route optimization have reduced transit times by 10–12%, improving reliability and efficiency. Airlines are investing in larger freighters and converted passenger aircraft to meet surging demand. Sustainability initiatives, including more fuel-efficient aircraft and carbon-offset programs, are increasingly influencing fleet planning and operational strategies.

Top Air Cargo Market Dynamics

The air cargo market is valued at USD 250 billion in 2025 and is projected to reach USD 420 billion by 2035. Freight tonnage is expected to rise from 60 million tons in 2025 to 98 million tons in 2035, driven by the growth of e-commerce, express delivery services, and global trade expansion. Asia Pacific leads the market with around 40% of total freight volume, followed by North America at 25% and Europe at 20%. Key cargo categories include pharmaceuticals, perishables, and electronics, collectively contributing nearly 50% of revenue.

Driving Force E-Commerce and Trade Expansion

E-commerce growth and cross-border trade are significantly boosting air cargo demand. Express parcel shipments are increasing at an estimated 8 to 9% annually, with electronics, pharmaceuticals, and consumer goods accounting for nearly 50% of total revenue. Airlines are optimizing capacity by utilizing belly cargo in passenger aircraft and dedicated freighters. Digital tracking, automated documentation, and real-time monitoring enhance reliability and reduce delays. Delivery expectations are evolving, with same-day and next-day options becoming standard in developed markets. In my opinion, air cargo has transformed into a critical enabler of global trade, ensuring rapid delivery of high-value, perishable, and time-sensitive shipments.

Growth Opportunity Cold Chain and Specialized Logistics

Cold chain logistics is emerging as a major growth driver, with the segment expected to expand from USD 35 billion in 2025 to USD 65 billion by 2035. Pharmaceuticals, vaccines, perishable foods, and high-value biotech products require temperature-controlled containers, warehouses, and real-time monitoring. Airlines are expanding dedicated freighter routes for cold chain products, particularly between Asia, Europe, and North America. E-grocery delivery and life sciences sectors are creating additional demand for specialized logistics. From my perspective, carriers investing in cold chain infrastructure and real-time monitoring will capture high-value shipments efficiently and secure long-term contracts.

  • Cold chain segment projected to reach USD 65 billion by 2035
  • Dedicated freighter routes link major manufacturing and consumption hubs
  • Biotech, pharmaceuticals, and e-grocery drive specialized logistics demand

Emerging Trend Digitalization and Automation

Digitalization and automation are transforming the air cargo sector. AI powered route optimization and predictive analytics enhance fleet utilization and delivery efficiency. Automated cargo handling, warehouse robotics, and real-time monitoring reduce errors and increase throughput. Integration of digital platforms across shippers, forwarders, and airlines improves transparency and operational efficiency. Cloud-based systems enable continuous tracking and optimization of freight operations. In my view, adoption of AI-driven logistics, IoT enabled monitoring, and automated warehousing will allow carriers to improve efficiency, reliability, and customer satisfaction while meeting rising demand from e-commerce and time-sensitive shipments.

  • AI and predictive analytics optimize fleet and route efficiency
  • Automation and robotics increase warehouse throughput and reduce handling errors
  • Digital integration improves operational visibility and control

Market Challenge High Operational Costs and Capacity Constraints

High operational costs and limited capacity remain significant challenges for air cargo operators. Fuel accounts for 30 to 35% of total operating expenses, while maintenance, airport handling, and labor add another 20 to 25%. Limited freighter capacity and airport slot restrictions create bottlenecks during peak seasons. Volatility in fuel prices and global economic fluctuations affect profitability. In my opinion, airlines must invest in fleet modernization, digital infrastructure, and efficient capacity planning to sustain growth. Without addressing high operational costs and capacity constraints, market expansion could slow despite increasing demand for international freight, express logistics, and specialized cargo services.

  • Fuel represents 30 to 35% of operating expenses
  • Limited freighter capacity and airport slots create peak season bottlenecks
  • Maintenance, handling, and labor account for 20 to 25% of total costs

Analyzing Air Cargo Market by Top Investment Segments

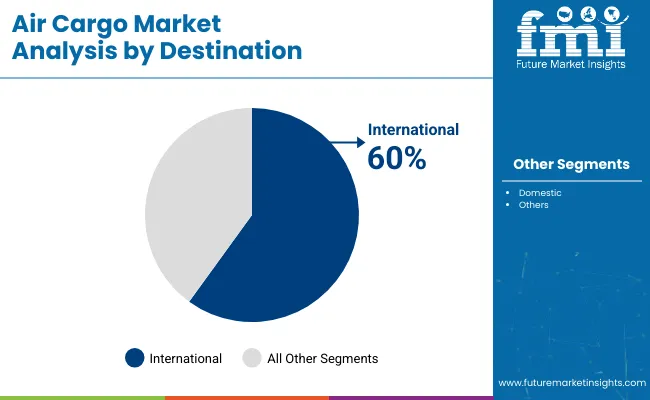
The market in 2025 is driven by global trade growth, e-commerce expansion, and the rising demand for timely delivery. Air freight dominates with 70% share, while air mail accounts for 30%. Express services capture 55% of the service segment, with general cargo at 45%. International destinations hold 60% of shipments, and domestic destinations represent 40%. Retail, e-commerce, and pharmaceuticals are the leading end users, accounting for 28% and 22% share respectively. Key operators include FedEx, DHL, UPS, and Emirates SkyCargo. Market growth is propelled by fast logistics, cold-chain transport, and sector-specific handling requirements, where digital tracking, fleet optimization, and strategic hubs ensure operational efficiency and timely deliveries worldwide.
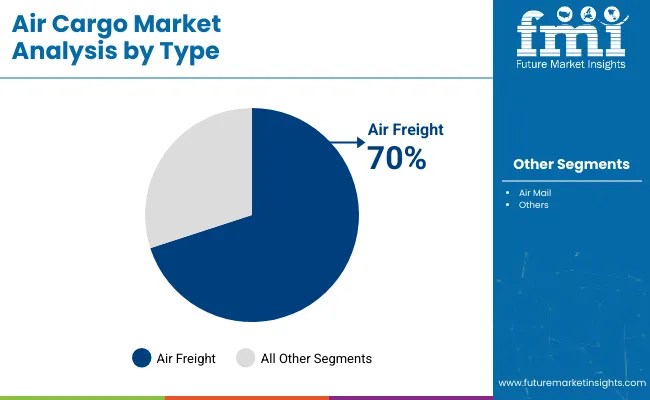
Air Freight and Air Mail Lead Type Segment

Air Cargo Market By Type

Air freight dominates the type segment with 70% share, handling high-value, time-sensitive goods such as electronics, pharmaceuticals, and automotive components. Air mail contributes 30%, focused on letters, documents, and small parcels requiring scheduled delivery. Leading operators include FedEx, DHL, UPS, and Emirates SkyCargo, offering integrated solutions for express and general cargo. Air freight adoption is driven by globalization, rapid e-commerce growth, and cross-border logistics demand. Air mail retains significance in developing regions where traditional postal systems remain prevalent. Companies optimize fleet allocation, route planning, and cargo consolidation to meet both segments efficiently. Type segmentation ensures flexibility in handling weight, volume, and delivery urgency.
  • FedEx handles 40% of global air freight shipments
  • DHL provides 35% of air mail and small parcel services
  • UPS manages 30% of mixed freight and mail operations globally

Express and General Services Drive Market Growth

Air Cargo Market By Service

Express services lead with 55% share, catering to urgent shipments, high-value cargo, and cold-chain products. General cargo accounts for 45%, serving standard commercial and industrial shipments. Operators like DHL, FedEx, and UPS focus on express logistics through dedicated fleets, real-time tracking, and priority handling. General services rely on standard cargo planes and shared space for cost efficiency. Express demand is rising due to e-commerce, pharmaceuticals, and electronics requiring quick delivery, while general cargo supports conventional trade and bulk shipments. Market growth depends on integrating technology, predictive scheduling, and optimizing operational cost across both service types.
  • DHL handles 45% of express cargo globally
  • FedEx delivers 35% of general cargo services for commercial clients
  • Emirates SkyCargo manages 30% of mixed service shipments worldwide

International and Domestic Destinations Shape Market Dynamics

Air Cargo Market By Destination

International destinations account for 60% of air cargo volume, supporting cross-border trade, multinational supply chains, and global e-commerce. Domestic shipments represent 40%, catering to regional logistics and last-mile connectivity. Operators including FedEx, UPS, and Emirates SkyCargo leverage hub-and-spoke networks, customs clearance efficiency, and regional partnerships to manage international cargo. Domestic shipments are supported by national carriers and regional airlines ensuring timely delivery. International demand is fueled by high-value goods, perishable items, and industrial components, whereas domestic routes focus on quick intra-country distribution. Network optimization, fleet utilization, and adherence to regulatory frameworks determine efficiency in both international and domestic segments.
  • FedEx handles 50% of international air cargo shipments
  • UPS provides 40% of domestic cargo solutions in North America
  • Emirates SkyCargo delivers 35% of mixed global and regional air freight

Retail, Pharma, And Electronics Lead End-User Segment

Air Cargo Market By End User

Retail and e-commerce dominate with 28% share, driven by fast delivery expectations and global marketplace integration. Pharmaceuticals and healthcare account for 22%, requiring temperature-controlled transport and regulatory compliance. Consumer electronics hold 18%, automotive 12%, and food & beverages 12%, reflecting perishable and high-value product logistics. Operators like DHL, FedEx, UPS, and Kuehne + Nagel provide end-to-end solutions including express handling, cold-chain logistics, and dedicated cargo facilities. End-user segmentation highlights the role of sector-specific solutions in ensuring timely, safe, and efficient delivery. Market adoption depends on fleet capacity, operational agility, and integration of AI-driven tracking and predictive analytics for optimized performance.
  • DHL handles 40% of retail and e-commerce shipments globally
  • FedEx provides 35% of pharmaceutical and healthcare logistics solutions
  • UPS manages 30% of consumer electronics and high-value cargo worldwide

Top Countries Expanding, Producing, and Operating in the Air Cargo Market

Air Cargo Market By Country

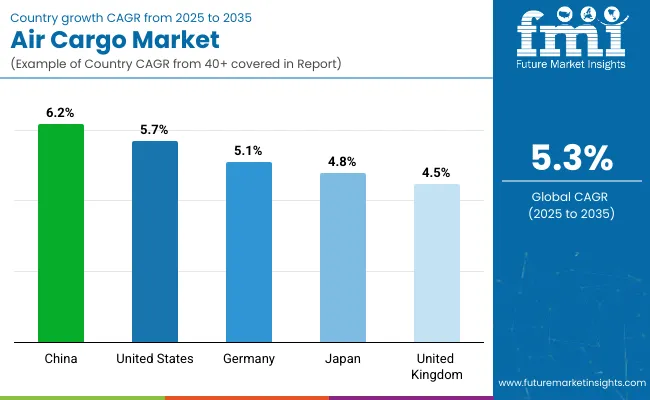
China leads the market with a CAGR of 6.2% from 2025 to 2035, +17% above the global average of 5.3%, driven by BRICS-supported expansion in e-commerce, manufacturing exports, and modern logistics infrastructure. The United States follows at 5.7%, +8% above the global rate, reflecting OECD-backed investments in cargo hubs, fleet modernization, and efficiency-enhancing technologies. Germany records 5.1%, −4% below the global benchmark, with growth shaped by steady demand in established European trade networks and incremental upgrades in air cargo handling. Japan posts 4.8%, −9% under the global rate, influenced by a mature cargo sector and gradual integration of advanced fleet technologies. The United Kingdom stands at 4.5%, −15% below the global CAGR, constrained by limited expansion capacity and moderate adoption of digital logistics solutions. In summary, BRICS nations, particularly China, are driving volume growth, while OECD economies focus on efficiency, technological improvements, and optimized network operations to maintain steady market performance.

Air Cargo Market Outlook in China

The air cargo market in China is expected to grow at a CAGR of 6.2%, fueled by e-commerce, manufacturing exports, and logistics expansion. Major airports including Shanghai Pudong, Shenzhen, and Guangzhou Baiyun handle high volumes of electronics, automotive parts, and pharmaceuticals. Airlines such as China Southern and Air China deploy automated cargo management systems to improve efficiency. Widebody freighters enhance intercontinental shipments, while cold chain systems support perishable and medical goods. Emerging smart airport technologies streamline cargo flow and reduce turnaround times. By 2035, the market is anticipated to continue expanding with emphasis on high-value freight and integrated logistics solutions.

  • E-commerce and electronics drive cargo volume growth
  • Cold chain logistics expand perishable and medical goods transport
  • Automation improves cargo handling efficiency at major airports

Air Cargo Market Prospects in the United States

The United States air cargo market is projected to grow at a CAGR of 5.7%, supported by major hubs like Memphis, Louisville, and Chicago. Freight carriers including FedEx Express, UPS Airlines, and Atlas Air utilize AI-based systems for cargo planning and optimization. Growth is fueled by e-commerce, cross-border trade, and increasing demand for perishable goods delivery. Investments in advanced cargo terminals and predictive logistics enhance efficiency, particularly for high-value electronics and industrial components. Widebody aircraft usage continues to expand for both domestic and international shipments.

  • AI-driven cargo management optimizes load planning and aircraft utilization
  • E-commerce and cross-border logistics drive steady demand
  • Widebody aircraft enhance capacity for high-value and perishable shipments

Air Cargo Market Expansion in Germany

The air cargo industry in Germany is expected to expand at a CAGR of 5.1%, anchored by Frankfurt and Munich as key European freight hubs. Lufthansa Cargo and DB Schenker handle industrial machinery, automotive parts, and pharmaceuticals. Automation in warehouses and tracking technologies improve efficiency and reduce handling delays. The automotive sector and chemical exports significantly influence demand, with just-in-time supply chains requiring fast and reliable air transport. Investments in energy-efficient freighters and hybrid aircraft support operational sustainability and reduce fuel costs. By 2035, Germany is projected to maintain a strong position in European air freight.

  • Frankfurt and Munich dominate industrial and pharmaceutical cargo operations
  • Automated warehouse and tracking systems reduce processing time
  • Just-in-time manufacturing strengthens demand for rapid air transport

Air Cargo Market Trends in Japan

The air cargo industry in Japan is projected to grow at a CAGR of 4.8%, centered around Tokyo Narita, Haneda, and Kansai airports. ANA Cargo and Nippon Cargo Airlines lead in electronics, automotive, and precision machinery transport. Cold chain logistics support seafood and pharmaceutical shipments, while AI-assisted scheduling improves aircraft utilization. Exports to North America and Europe remain strong, and airport automation reduces cargo handling time. The market benefits from Japan’s export-oriented manufacturing sector and advanced logistics infrastructure, focusing on high-value and sensitive goods.

  • Electronics and automotive components are major cargo segments
  • Cold chain systems enhance transport of perishable goods
  • AI scheduling and airport automation improve operational efficiency

Air Cargo Market Prospects in the United Kingdom

The United Kingdom air cargo market is expected to grow at a CAGR of 4.5%, with London Heathrow and East Midlands airports acting as key hubs. DHL, Virgin Atlantic Cargo, and IAG Cargo manage high-value electronics, pharmaceuticals, and fashion goods. Automation in warehouses, including robotic sorting and cold storage, improves handling efficiency. E-commerce demand and cross-border trade with Europe drive growth, while predictive logistics tools optimize delivery schedules. Investments in infrastructure support faster cargo processing and timely shipments of time-sensitive goods.
  • High-value electronics and pharmaceuticals dominate freight volumes
  • Robotic sorting and cold storage enhance warehouse efficiency
  • Predictive logistics improve delivery reliability for time-sensitive shipments

Leading Air Cargo Manufacturers, Suppliers, Distributors

Air Cargo Market By Company

Air cargo companies compete by offering faster delivery, broad network coverage, and specialized cargo handling. China Airlines Cargo and Cargolux Airlines International focus on connecting Asia and Europe efficiently, maintaining frequent flights and temperature-controlled services for perishable goods. Turkish Cargo leverages Istanbul as a central hub to streamline transcontinental shipments. FedEx Express and UPS Airlines use advanced logistics technology, predictive tracking, and dedicated freight solutions to secure reliability and speed for time-sensitive deliveries.

Emirates SkyCargo and Qatar Airways Cargo attract high-value shipments by providing premium handling, wide cargo space, and flexible routing. DHL Aviation and Singapore Airlines Cargo focus on integrated services, combining air freight with ground transportation for end-to-end solutions. Korean Air Cargo and Cathay Pacific Cargo offer specialized freight options such as pharmaceuticals, e-commerce goods, and oversized cargo. The competition intensifies through fleet expansion, partnerships, and optimized scheduling to reduce transit times while maximizing capacity.

Marketing relies on product brochures and digital catalogs highlighting cargo types, handling options, and global destinations. Brochures emphasize efficiency, safety, and reliability, helping clients select tailored solutions for their business. Some digital brochures include route maps, transit timelines, and service comparisons to improve customer experience. Each presentation positions the carrier as a dependable partner for critical shipments while keeping information concise and practical. Clarity, speed, and service quality remain the focus rather than promotional language.

Leading Players

  • FedEx Express
  • UPS Airlines
  • DHL Aviation
  • Emirates SkyCargo
  • Qatar Airways Cargo
  • China Airlines Cargo
  • Cargolux Airlines International
  • Turkish Cargo
  • Korean Air Cargo
  • Cathay Pacific Cargo
  • Singapore Airlines Cargo

Report Scope

Report Attributes Details
Market Size (2025) USD 250 billion
Projected Market Size (2035) USD 420 billion
CAGR (2025 to 2035) 5.3%
Base Year for Estimation 2024
Historical Period 2020 to 2024
Projection Period 2025 to 2035
Quantitative Units USD billion for value
Type Segments Air Freight, Air Mail
Service Segments Express, General
Destination Segments Domestic, International
End-User Segments Retail & E-commerce, Food & Beverages, Pharmaceutical & Healthcare, Consumer Electronics, Automotive, Others
Regions Covered North America, Latin America, Western Europe, Eastern Europe, Asia Pacific, Middle East & Africa
Countries Covered United States, Canada, Brazil, Mexico, Germany, United Kingdom, France, Italy, China, Japan, India, UAE, Saudi Arabia, South Africa, Australia
Leading Players FedEx Express, UPS Airlines, DHL Aviation, Emirates SkyCargo, Qatar Airways Cargo, China Airlines Cargo, Cargolux Airlines International, Turkish Cargo, Korean Air Cargo, Cathay Pacific Cargo, Singapore Airlines Cargo
Additional Attributes Dollar sales by cargo type and service, demand dynamics across express and general freight, regional trends in domestic and international shipments, innovation in temperature-controlled logistics, digital tracking, AI-based route optimization, and environmental impact of emissions reduction in air logistics

Air Cargo Market Analyzed by Key Investment Segments 

By Type:

  • Air Freight
  • Air Mail

By Service:

  • Express
  • General

By Destination:

  • Domestic
  • International

By End User:

  • Retail and E-commerce
  • Food & Beverages
  • Pharmaceutical & Healthcare
  • Consumer Electronics
  • Automotive
  • Others

By Region:

  • North America
  • Latin America
  • Western Europe
  • Eastern Europe
  • Asia Pacific
  • The Middle East and Africa

Table of Content

  1. Executive Summary
    • Global Market Outlook
    • Demand-side Trends
    • Supply-side Trends
    • Technology Roadmap Analysis
    • Analysis and Recommendations
  2. Market Overview
    • Market Coverage / Taxonomy
    • Market Definition / Scope / Limitations
  3. Market Background
    • Market Dynamics
      • Drivers
      • Restraints
      • Opportunity
      • Trends
    • Scenario Forecast
      • Demand in Optimistic Scenario
      • Demand in Likely Scenario
      • Demand in Conservative Scenario
    • Opportunity Map Analysis
    • Product Life Cycle Analysis
    • Supply Chain Analysis
      • Supply Side Participants and their Roles
        • Producers
        • Mid-Level Participants (Traders/ Agents/ Brokers)
        • Wholesalers and Distributors
      • Value Added and Value Created at Node in the Supply Chain
      • List of Raw Material Suppliers
      • List of Existing and Potential Buyer’s
    • Investment Feasibility Matrix
    • Value Chain Analysis
      • Profit Margin Analysis
      • Wholesalers and Distributors
      • Retailers
    • PESTLE and Porter’s Analysis
    • Regulatory Landscape
      • By Key Regions
      • By Key Countries
    • Regional Parent Market Outlook
    • Production and Consumption Statistics
    • Import and Export Statistics
  4. Global Market Analysis 2020 to 2024 and Forecast, 2025 to 2035
    • Historical Market Size Value (USD Billion) & Volume (Thousand Units) Analysis, 2020 to 2024
    • Current and Future Market Size Value (USD Billion) & Volume (Thousand Units) Projections, 2025 to 2035
      • Y-o-Y Growth Trend Analysis
      • Absolute $ Opportunity Analysis
  5. Global Market Pricing Analysis 2020 to 2024 and Forecast 2025 to 2035
  6. Global Market Analysis 2020 to 2024 and Forecast 2025 to 2035, By Type
    • Introduction / Key Findings
    • Historical Market Size Value (USD Billion) & Volume (Thousand Units) Analysis By Type, 2020 to 2024
    • Current and Future Market Size Value (USD Billion) & Volume (Thousand Units) Analysis and Forecast By Type, 2025 to 2035
      • Air Freight
      • Air Mail
    • Y-o-Y Growth Trend Analysis By Type, 2020 to 2024
    • Absolute $ Opportunity Analysis By Type, 2025 to 2035
  7. Global Market Analysis 2020 to 2024 and Forecast 2025 to 2035, By Service Type
    • Introduction / Key Findings
    • Historical Market Size Value (USD Billion) & Volume (Thousand Units) Analysis By Service Type, 2020 to 2024
    • Current and Future Market Size Value (USD Billion) & Volume (Thousand Units) Analysis and Forecast By Service Type, 2025 to 2035
      • Express
      • General
    • Y-o-Y Growth Trend Analysis By Service Type, 2020 to 2024
    • Absolute $ Opportunity Analysis By Service Type, 2025 to 2035
  8. Global Market Analysis 2020 to 2024 and Forecast 2025 to 2035, By Destination
    • Introduction / Key Findings
    • Historical Market Size Value (USD Billion) & Volume (Thousand Units) Analysis By Destination, 2020 to 2024
    • Current and Future Market Size Value (USD Billion) & Volume (Thousand Units) Analysis and Forecast By Destination, 2025 to 2035
      • International
      • Domestic
    • Y-o-Y Growth Trend Analysis By Destination, 2020 to 2024
    • Absolute $ Opportunity Analysis By Destination, 2025 to 2035
  9. Global Market Analysis 2020 to 2024 and Forecast 2025 to 2035, By End User
    • Introduction / Key Findings
    • Historical Market Size Value (USD Billion) & Volume (Thousand Units) Analysis By End User, 2020 to 2024
    • Current and Future Market Size Value (USD Billion) & Volume (Thousand Units) Analysis and Forecast By End User, 2025 to 2035
      • Retail and E-commerce
      • Pharmaceutical & Healthcare
      • Consumer Electronics
      • Automotive
      • Food & Beverages
      • Others
    • Y-o-Y Growth Trend Analysis By End User, 2020 to 2024
    • Absolute $ Opportunity Analysis By End User, 2025 to 2035
  10. Global Market Analysis 2020 to 2024 and Forecast 2025 to 2035, By Region
    • Introduction
    • Historical Market Size Value (USD Billion) & Volume (Thousand Units) Analysis By Region, 2020 to 2024
    • Current Market Size Value (USD Billion) & Volume (Thousand Units) Analysis and Forecast By Region, 2025 to 2035
      • North America
      • Latin America
      • Western Europe
      • Eastern Europe
      • East Asia
      • South Asia & Pacific
      • Middle East and Africa
    • Market Attractiveness Analysis By Region
  11. North America Market Analysis 2020 to 2024 and Forecast 2025 to 2035, By Country
    • Historical Market Size Value (USD Billion) & Volume (Thousand Units) Trend Analysis By Market Taxonomy, 2020 to 2024
    • Market Size Value (USD Billion) & Volume (Thousand Units) Forecast By Market Taxonomy, 2025 to 2035
      • By Country
        • USA
        • Canada
        • Mexico
      • By Type
      • By Service Type
      • By Destination
      • By End User
    • Market Attractiveness Analysis
      • By Country
      • By Type
      • By Service Type
      • By Destination
      • By End User
    • Key Takeaways
  12. Latin America Market Analysis 2020 to 2024 and Forecast 2025 to 2035, By Country
    • Historical Market Size Value (USD Billion) & Volume (Thousand Units) Trend Analysis By Market Taxonomy, 2020 to 2024
    • Market Size Value (USD Billion) & Volume (Thousand Units) Forecast By Market Taxonomy, 2025 to 2035
      • By Country
        • Brazil
        • Argentina
        • Rest of LATAM
      • By Type
      • By Service Type
      • By Destination
      • By End User
    • Market Attractiveness Analysis
      • By Country
      • By Type
      • By Service Type
      • By Destination
      • By End User
    • Key Takeaways
  13. Western Europe Market Analysis 2020 to 2024 and Forecast 2025 to 2035, By Country
    • Historical Market Size Value (USD Billion) & Volume (Thousand Units) Trend Analysis By Market Taxonomy, 2020 to 2024
    • Market Size Value (USD Billion) & Volume (Thousand Units) Forecast By Market Taxonomy, 2025 to 2035
      • By Country
        • Germany
        • Italy
        • France
        • UK
        • Spain
        • BENELUX
        • Nordic
        • Rest of W.Europe
      • By Type
      • By Service Type
      • By Destination
      • By End User
    • Market Attractiveness Analysis
      • By Country
      • By Type
      • By Service Type
      • By Destination
      • By End User
    • Key Takeaways
  14. Eastern Europe Market Analysis 2020 to 2024 and Forecast 2025 to 2035, By Country
    • Historical Market Size Value (USD Billion) & Volume (Thousand Units) Trend Analysis By Market Taxonomy, 2020 to 2024
    • Market Size Value (USD Billion) & Volume (Thousand Units) Forecast By Market Taxonomy, 2025 to 2035
      • By Country
        • Russia
        • Hungary
        • Poland
        • Balkan & Baltics
        • Rest of E. Europe
      • By Type
      • By Service Type
      • By Destination
      • By End User
    • Market Attractiveness Analysis
      • By Country
      • By Type
      • By Service Type
      • By Destination
      • By End User
    • Key Takeaways
  15. East Asia Market Analysis 2020 to 2024 and Forecast 2025 to 2035, By Country
    • Historical Market Size Value (USD Billion) & Volume (Thousand Units) Trend Analysis By Market Taxonomy, 2020 to 2024
    • Market Size Value (USD Billion) & Volume (Thousand Units) Forecast By Market Taxonomy, 2025 to 2035
      • By Country
        • China
        • Japan
        • South Korea
      • By Type
      • By Service Type
      • By Destination
      • By End User
    • Market Attractiveness Analysis
      • By Country
      • By Type
      • By Service Type
      • By Destination
      • By End User
    • Key Takeaways
  16. South Asia & Pacific Market Analysis 2020 to 2024 and Forecast 2025 to 2035, By Country
    • Historical Market Size Value (USD Billion) & Volume (Thousand Units) Trend Analysis By Market Taxonomy, 2020 to 2024
    • Market Size Value (USD Billion) & Volume (Thousand Units) Forecast By Market Taxonomy, 2025 to 2035
      • By Country
        • India
        • Australia & New Zealand
        • ASEAN
        • Rest of SAP
      • By Type
      • By Service Type
      • By Destination
      • By End User
    • Market Attractiveness Analysis
      • By Country
      • By Type
      • By Service Type
      • By Destination
      • By End User
    • Key Takeaways
  17. Middle East and Africa Market Analysis 2020 to 2024 and Forecast 2025 to 2035, By Country
    • Historical Market Size Value (USD Billion) & Volume (Thousand Units) Trend Analysis By Market Taxonomy, 2020 to 2024
    • Market Size Value (USD Billion) & Volume (Thousand Units) Forecast By Market Taxonomy, 2025 to 2035
      • By Country
        • GCC Countries
        • Northern Africa
        • South Africa
        • Turkiye
        • Rest of MEA
      • By Type
      • By Service Type
      • By Destination
      • By End User
    • Market Attractiveness Analysis
      • By Country
      • By Type
      • By Service Type
      • By Destination
      • By End User
    • Key Takeaways
  18. Key Countries Market Analysis
    • USA
      • Pricing Analysis
      • Market Share Analysis, 2024
        • By Type
        • By Service Type
        • By Destination
        • By End User
    • Canada
      • Pricing Analysis
      • Market Share Analysis, 2024
        • By Type
        • By Service Type
        • By Destination
        • By End User
    • Brazil
      • Pricing Analysis
      • Market Share Analysis, 2024
        • By Type
        • By Service Type
        • By Destination
        • By End User
    • Mexico
      • Pricing Analysis
      • Market Share Analysis, 2024
        • By Type
        • By Service Type
        • By Destination
        • By End User
    • Argentina
      • Pricing Analysis
      • Market Share Analysis, 2024
        • By Type
        • By Service Type
        • By Destination
        • By End User
  19. Market Structure Analysis
    • Competition Dashboard
    • Competition Benchmarking
    • Market Share Analysis of Top Players
      • By Regional
      • By Type
      • By Service Type
      • By Destination
      • By End User
  20. Competition Analysis
    • Competition Deep Dive
      • FedEx Express
        • Overview
        • Product Portfolio
        • Profitability by Market Segments (Product/Age /Sales Channel/Region)
        • Sales Footprint
        • Strategy Overview
          • Marketing Strategy
          • Product Strategy
          • Channel Strategy
      • UPS Airlines
        • Overview
        • Product Portfolio
        • Profitability by Market Segments (Product/Age /Sales Channel/Region)
        • Sales Footprint
        • Strategy Overview
          • Marketing Strategy
          • Product Strategy
          • Channel Strategy
      • DHL Aviation
        • Overview
        • Product Portfolio
        • Profitability by Market Segments (Product/Age /Sales Channel/Region)
        • Sales Footprint
        • Strategy Overview
          • Marketing Strategy
          • Product Strategy
          • Channel Strategy
      • Emirates SkyCargo
        • Overview
        • Product Portfolio
        • Profitability by Market Segments (Product/Age /Sales Channel/Region)
        • Sales Footprint
        • Strategy Overview
          • Marketing Strategy
          • Product Strategy
          • Channel Strategy
      • Qatar Airways Cargo
        • Overview
        • Product Portfolio
        • Profitability by Market Segments (Product/Age /Sales Channel/Region)
        • Sales Footprint
        • Strategy Overview
          • Marketing Strategy
          • Product Strategy
          • Channel Strategy
      • China Airlines Cargo
        • Overview
        • Product Portfolio
        • Profitability by Market Segments (Product/Age /Sales Channel/Region)
        • Sales Footprint
        • Strategy Overview
          • Marketing Strategy
          • Product Strategy
          • Channel Strategy
      • Cargolux Airlines International
        • Overview
        • Product Portfolio
        • Profitability by Market Segments (Product/Age /Sales Channel/Region)
        • Sales Footprint
        • Strategy Overview
          • Marketing Strategy
          • Product Strategy
          • Channel Strategy
      • Turkish Cargo
        • Overview
        • Product Portfolio
        • Profitability by Market Segments (Product/Age /Sales Channel/Region)
        • Sales Footprint
        • Strategy Overview
          • Marketing Strategy
          • Product Strategy
          • Channel Strategy
      • Korean
        • Overview
        • Product Portfolio
        • Profitability by Market Segments (Product/Age /Sales Channel/Region)
        • Sales Footprint
        • Strategy Overview
          • Marketing Strategy
          • Product Strategy
          • Channel Strategy
      • Cathay Pacific Cargo
        • Overview
        • Product Portfolio
        • Profitability by Market Segments (Product/Age /Sales Channel/Region)
        • Sales Footprint
        • Strategy Overview
          • Marketing Strategy
          • Product Strategy
          • Channel Strategy
      • Singapore Airlines Cargo
        • Overview
        • Product Portfolio
        • Profitability by Market Segments (Product/Age /Sales Channel/Region)
        • Sales Footprint
        • Strategy Overview
          • Marketing Strategy
          • Product Strategy
          • Channel Strategy
  21. Assumptions & Acronyms Used
  22. Research Methodology

List of Tables

  • Table 1: Global Market Value (USD Billion) Forecast by Region, 2020-2035
  • Table 2: Global Market Volume (Thousand Units) Forecast by Region, 2020-2035
  • Table 3: Global Market Value (USD Billion) Forecast by Type, 2020-2035
  • Table 4: Global Market Volume (Thousand Units) Forecast by Type, 2020-2035
  • Table 5: Global Market Value (USD Billion) Forecast by Service Type, 2020-2035
  • Table 6: Global Market Volume (Thousand Units) Forecast by Service Type, 2020-2035
  • Table 7: Global Market Value (USD Billion) Forecast by Destination, 2020-2035
  • Table 8: Global Market Volume (Thousand Units) Forecast by Destination, 2020-2035
  • Table 9: Global Market Value (USD Billion) Forecast by End User, 2020-2035
  • Table 10: Global Market Volume (Thousand Units) Forecast by End User, 2020-2035
  • Table 11: North America Market Value (USD Billion) Forecast by Country, 2020-2035
  • Table 12: North America Market Volume (Thousand Units) Forecast by Country, 2020-2035
  • Table 13: North America Market Value (USD Billion) Forecast by Type, 2020-2035
  • Table 14: North America Market Volume (Thousand Units) Forecast by Type, 2020-2035
  • Table 15: North America Market Value (USD Billion) Forecast by Service Type, 2020-2035
  • Table 16: North America Market Volume (Thousand Units) Forecast by Service Type, 2020-2035
  • Table 17: North America Market Value (USD Billion) Forecast by Destination, 2020-2035
  • Table 18: North America Market Volume (Thousand Units) Forecast by Destination, 2020-2035
  • Table 19: North America Market Value (USD Billion) Forecast by End User, 2020-2035
  • Table 20: North America Market Volume (Thousand Units) Forecast by End User, 2020-2035
  • Table 21: Latin America Market Value (USD Billion) Forecast by Country, 2020-2035
  • Table 22: Latin America Market Volume (Thousand Units) Forecast by Country, 2020-2035
  • Table 23: Latin America Market Value (USD Billion) Forecast by Type, 2020-2035
  • Table 24: Latin America Market Volume (Thousand Units) Forecast by Type, 2020-2035
  • Table 25: Latin America Market Value (USD Billion) Forecast by Service Type, 2020-2035
  • Table 26: Latin America Market Volume (Thousand Units) Forecast by Service Type, 2020-2035
  • Table 27: Latin America Market Value (USD Billion) Forecast by Destination, 2020-2035
  • Table 28: Latin America Market Volume (Thousand Units) Forecast by Destination, 2020-2035
  • Table 29: Latin America Market Value (USD Billion) Forecast by End User, 2020-2035
  • Table 30: Latin America Market Volume (Thousand Units) Forecast by End User, 2020-2035
  • Table 31: Western Europe Market Value (USD Billion) Forecast by Country, 2020-2035
  • Table 32: Western Europe Market Volume (Thousand Units) Forecast by Country, 2020-2035
  • Table 33: Western Europe Market Value (USD Billion) Forecast by Type, 2020-2035
  • Table 34: Western Europe Market Volume (Thousand Units) Forecast by Type, 2020-2035
  • Table 35: Western Europe Market Value (USD Billion) Forecast by Service Type, 2020-2035
  • Table 36: Western Europe Market Volume (Thousand Units) Forecast by Service Type, 2020-2035
  • Table 37: Western Europe Market Value (USD Billion) Forecast by Destination, 2020-2035
  • Table 38: Western Europe Market Volume (Thousand Units) Forecast by Destination, 2020-2035
  • Table 39: Western Europe Market Value (USD Billion) Forecast by End User, 2020-2035
  • Table 40: Western Europe Market Volume (Thousand Units) Forecast by End User, 2020-2035
  • Table 41: Eastern Europe Market Value (USD Billion) Forecast by Country, 2020-2035
  • Table 42: Eastern Europe Market Volume (Thousand Units) Forecast by Country, 2020-2035
  • Table 43: Eastern Europe Market Value (USD Billion) Forecast by Type, 2020-2035
  • Table 44: Eastern Europe Market Volume (Thousand Units) Forecast by Type, 2020-2035
  • Table 45: Eastern Europe Market Value (USD Billion) Forecast by Service Type, 2020-2035
  • Table 46: Eastern Europe Market Volume (Thousand Units) Forecast by Service Type, 2020-2035
  • Table 47: Eastern Europe Market Value (USD Billion) Forecast by Destination, 2020-2035
  • Table 48: Eastern Europe Market Volume (Thousand Units) Forecast by Destination, 2020-2035
  • Table 49: Eastern Europe Market Value (USD Billion) Forecast by End User, 2020-2035
  • Table 50: Eastern Europe Market Volume (Thousand Units) Forecast by End User, 2020-2035
  • Table 51: East Asia Market Value (USD Billion) Forecast by Country, 2020-2035
  • Table 52: East Asia Market Volume (Thousand Units) Forecast by Country, 2020-2035
  • Table 53: East Asia Market Value (USD Billion) Forecast by Type, 2020-2035
  • Table 54: East Asia Market Volume (Thousand Units) Forecast by Type, 2020-2035
  • Table 55: East Asia Market Value (USD Billion) Forecast by Service Type, 2020-2035
  • Table 56: East Asia Market Volume (Thousand Units) Forecast by Service Type, 2020-2035
  • Table 57: East Asia Market Value (USD Billion) Forecast by Destination, 2020-2035
  • Table 58: East Asia Market Volume (Thousand Units) Forecast by Destination, 2020-2035
  • Table 59: East Asia Market Value (USD Billion) Forecast by End User, 2020-2035
  • Table 60: East Asia Market Volume (Thousand Units) Forecast by End User, 2020-2035
  • Table 61: South Asia & Pacific Market Value (USD Billion) Forecast by Country, 2020-2035
  • Table 62: South Asia & Pacific Market Volume (Thousand Units) Forecast by Country, 2020-2035
  • Table 63: South Asia & Pacific Market Value (USD Billion) Forecast by Type, 2020-2035
  • Table 64: South Asia & Pacific Market Volume (Thousand Units) Forecast by Type, 2020-2035
  • Table 65: South Asia & Pacific Market Value (USD Billion) Forecast by Service Type, 2020-2035
  • Table 66: South Asia & Pacific Market Volume (Thousand Units) Forecast by Service Type, 2020-2035
  • Table 67: South Asia & Pacific Market Value (USD Billion) Forecast by Destination, 2020-2035
  • Table 68: South Asia & Pacific Market Volume (Thousand Units) Forecast by Destination, 2020-2035
  • Table 69: South Asia & Pacific Market Value (USD Billion) Forecast by End User, 2020-2035
  • Table 70: South Asia & Pacific Market Volume (Thousand Units) Forecast by End User, 2020-2035
  • Table 71: Middle East and Africa Market Value (USD Billion) Forecast by Country, 2020-2035
  • Table 72: Middle East and Africa Market Volume (Thousand Units) Forecast by Country, 2020-2035
  • Table 73: Middle East and Africa Market Value (USD Billion) Forecast by Type, 2020-2035
  • Table 74: Middle East and Africa Market Volume (Thousand Units) Forecast by Type, 2020-2035
  • Table 75: Middle East and Africa Market Value (USD Billion) Forecast by Service Type, 2020-2035
  • Table 76: Middle East and Africa Market Volume (Thousand Units) Forecast by Service Type, 2020-2035
  • Table 77: Middle East and Africa Market Value (USD Billion) Forecast by Destination, 2020-2035
  • Table 78: Middle East and Africa Market Volume (Thousand Units) Forecast by Destination, 2020-2035
  • Table 79: Middle East and Africa Market Value (USD Billion) Forecast by End User, 2020-2035
  • Table 80: Middle East and Africa Market Volume (Thousand Units) Forecast by End User, 2020-2035

List of Figures

  • Figure 1: Global Market Volume (Thousand Units) Forecast 2020-2035
  • Figure 2: Global Market Pricing Analysis
  • Figure 3: Global Market Value (USD Billion) Forecast 2020-2035
  • Figure 4: Global Market Value Share and BPS Analysis by Type, 2025 and 2035
  • Figure 5: Global Market Y-o-Y Growth Comparison by Type, 2025-2035
  • Figure 6: Global Market Attractiveness Analysis by Type
  • Figure 7: Global Market Value Share and BPS Analysis by Service Type, 2025 and 2035
  • Figure 8: Global Market Y-o-Y Growth Comparison by Service Type, 2025-2035
  • Figure 9: Global Market Attractiveness Analysis by Service Type
  • Figure 10: Global Market Value Share and BPS Analysis by Destination, 2025 and 2035
  • Figure 11: Global Market Y-o-Y Growth Comparison by Destination, 2025-2035
  • Figure 12: Global Market Attractiveness Analysis by Destination
  • Figure 13: Global Market Value Share and BPS Analysis by End User, 2025 and 2035
  • Figure 14: Global Market Y-o-Y Growth Comparison by End User, 2025-2035
  • Figure 15: Global Market Attractiveness Analysis by End User
  • Figure 16: Global Market Value (USD Billion) Share and BPS Analysis by Region, 2025 and 2035
  • Figure 17: Global Market Y-o-Y Growth Comparison by Region, 2025-2035
  • Figure 18: Global Market Attractiveness Analysis by Region
  • Figure 19: North America Market Incremental $ Opportunity, 2025-2035
  • Figure 20: Latin America Market Incremental $ Opportunity, 2025-2035
  • Figure 21: Western Europe Market Incremental $ Opportunity, 2025-2035
  • Figure 22: Eastern Europe Market Incremental $ Opportunity, 2025-2035
  • Figure 23: East Asia Market Incremental $ Opportunity, 2025-2035
  • Figure 24: South Asia & Pacific Market Incremental $ Opportunity, 2025-2035
  • Figure 25: Middle East and Africa Market Incremental $ Opportunity, 2025-2035
  • Figure 26: North America Market Value Share and BPS Analysis by Country, 2025 and 2035
  • Figure 27: North America Market Value Share and BPS Analysis by Type, 2025 and 2035
  • Figure 28: North America Market Y-o-Y Growth Comparison by Type, 2025-2035
  • Figure 29: North America Market Attractiveness Analysis by Type
  • Figure 30: North America Market Value Share and BPS Analysis by Service Type, 2025 and 2035
  • Figure 31: North America Market Y-o-Y Growth Comparison by Service Type, 2025-2035
  • Figure 32: North America Market Attractiveness Analysis by Service Type
  • Figure 33: North America Market Value Share and BPS Analysis by Destination, 2025 and 2035
  • Figure 34: North America Market Y-o-Y Growth Comparison by Destination, 2025-2035
  • Figure 35: North America Market Attractiveness Analysis by Destination
  • Figure 36: North America Market Value Share and BPS Analysis by End User, 2025 and 2035
  • Figure 37: North America Market Y-o-Y Growth Comparison by End User, 2025-2035
  • Figure 38: North America Market Attractiveness Analysis by End User
  • Figure 39: Latin America Market Value Share and BPS Analysis by Country, 2025 and 2035
  • Figure 40: Latin America Market Value Share and BPS Analysis by Type, 2025 and 2035
  • Figure 41: Latin America Market Y-o-Y Growth Comparison by Type, 2025-2035
  • Figure 42: Latin America Market Attractiveness Analysis by Type
  • Figure 43: Latin America Market Value Share and BPS Analysis by Service Type, 2025 and 2035
  • Figure 44: Latin America Market Y-o-Y Growth Comparison by Service Type, 2025-2035
  • Figure 45: Latin America Market Attractiveness Analysis by Service Type
  • Figure 46: Latin America Market Value Share and BPS Analysis by Destination, 2025 and 2035
  • Figure 47: Latin America Market Y-o-Y Growth Comparison by Destination, 2025-2035
  • Figure 48: Latin America Market Attractiveness Analysis by Destination
  • Figure 49: Latin America Market Value Share and BPS Analysis by End User, 2025 and 2035
  • Figure 50: Latin America Market Y-o-Y Growth Comparison by End User, 2025-2035
  • Figure 51: Latin America Market Attractiveness Analysis by End User
  • Figure 52: Western Europe Market Value Share and BPS Analysis by Country, 2025 and 2035
  • Figure 53: Western Europe Market Value Share and BPS Analysis by Type, 2025 and 2035
  • Figure 54: Western Europe Market Y-o-Y Growth Comparison by Type, 2025-2035
  • Figure 55: Western Europe Market Attractiveness Analysis by Type
  • Figure 56: Western Europe Market Value Share and BPS Analysis by Service Type, 2025 and 2035
  • Figure 57: Western Europe Market Y-o-Y Growth Comparison by Service Type, 2025-2035
  • Figure 58: Western Europe Market Attractiveness Analysis by Service Type
  • Figure 59: Western Europe Market Value Share and BPS Analysis by Destination, 2025 and 2035
  • Figure 60: Western Europe Market Y-o-Y Growth Comparison by Destination, 2025-2035
  • Figure 61: Western Europe Market Attractiveness Analysis by Destination
  • Figure 62: Western Europe Market Value Share and BPS Analysis by End User, 2025 and 2035
  • Figure 63: Western Europe Market Y-o-Y Growth Comparison by End User, 2025-2035
  • Figure 64: Western Europe Market Attractiveness Analysis by End User
  • Figure 65: Eastern Europe Market Value Share and BPS Analysis by Country, 2025 and 2035
  • Figure 66: Eastern Europe Market Value Share and BPS Analysis by Type, 2025 and 2035
  • Figure 67: Eastern Europe Market Y-o-Y Growth Comparison by Type, 2025-2035
  • Figure 68: Eastern Europe Market Attractiveness Analysis by Type
  • Figure 69: Eastern Europe Market Value Share and BPS Analysis by Service Type, 2025 and 2035
  • Figure 70: Eastern Europe Market Y-o-Y Growth Comparison by Service Type, 2025-2035
  • Figure 71: Eastern Europe Market Attractiveness Analysis by Service Type
  • Figure 72: Eastern Europe Market Value Share and BPS Analysis by Destination, 2025 and 2035
  • Figure 73: Eastern Europe Market Y-o-Y Growth Comparison by Destination, 2025-2035
  • Figure 74: Eastern Europe Market Attractiveness Analysis by Destination
  • Figure 75: Eastern Europe Market Value Share and BPS Analysis by End User, 2025 and 2035
  • Figure 76: Eastern Europe Market Y-o-Y Growth Comparison by End User, 2025-2035
  • Figure 77: Eastern Europe Market Attractiveness Analysis by End User
  • Figure 78: East Asia Market Value Share and BPS Analysis by Country, 2025 and 2035
  • Figure 79: East Asia Market Value Share and BPS Analysis by Type, 2025 and 2035
  • Figure 80: East Asia Market Y-o-Y Growth Comparison by Type, 2025-2035
  • Figure 81: East Asia Market Attractiveness Analysis by Type
  • Figure 82: East Asia Market Value Share and BPS Analysis by Service Type, 2025 and 2035
  • Figure 83: East Asia Market Y-o-Y Growth Comparison by Service Type, 2025-2035
  • Figure 84: East Asia Market Attractiveness Analysis by Service Type
  • Figure 85: East Asia Market Value Share and BPS Analysis by Destination, 2025 and 2035
  • Figure 86: East Asia Market Y-o-Y Growth Comparison by Destination, 2025-2035
  • Figure 87: East Asia Market Attractiveness Analysis by Destination
  • Figure 88: East Asia Market Value Share and BPS Analysis by End User, 2025 and 2035
  • Figure 89: East Asia Market Y-o-Y Growth Comparison by End User, 2025-2035
  • Figure 90: East Asia Market Attractiveness Analysis by End User
  • Figure 91: South Asia & Pacific Market Value Share and BPS Analysis by Country, 2025 and 2035
  • Figure 92: South Asia & Pacific Market Value Share and BPS Analysis by Type, 2025 and 2035
  • Figure 93: South Asia & Pacific Market Y-o-Y Growth Comparison by Type, 2025-2035
  • Figure 94: South Asia & Pacific Market Attractiveness Analysis by Type
  • Figure 95: South Asia & Pacific Market Value Share and BPS Analysis by Service Type, 2025 and 2035
  • Figure 96: South Asia & Pacific Market Y-o-Y Growth Comparison by Service Type, 2025-2035
  • Figure 97: South Asia & Pacific Market Attractiveness Analysis by Service Type
  • Figure 98: South Asia & Pacific Market Value Share and BPS Analysis by Destination, 2025 and 2035
  • Figure 99: South Asia & Pacific Market Y-o-Y Growth Comparison by Destination, 2025-2035
  • Figure 100: South Asia & Pacific Market Attractiveness Analysis by Destination
  • Figure 101: South Asia & Pacific Market Value Share and BPS Analysis by End User, 2025 and 2035
  • Figure 102: South Asia & Pacific Market Y-o-Y Growth Comparison by End User, 2025-2035
  • Figure 103: South Asia & Pacific Market Attractiveness Analysis by End User
  • Figure 104: Middle East and Africa Market Value Share and BPS Analysis by Country, 2025 and 2035
  • Figure 105: Middle East and Africa Market Value Share and BPS Analysis by Type, 2025 and 2035
  • Figure 106: Middle East and Africa Market Y-o-Y Growth Comparison by Type, 2025-2035
  • Figure 107: Middle East and Africa Market Attractiveness Analysis by Type
  • Figure 108: Middle East and Africa Market Value Share and BPS Analysis by Service Type, 2025 and 2035
  • Figure 109: Middle East and Africa Market Y-o-Y Growth Comparison by Service Type, 2025-2035
  • Figure 110: Middle East and Africa Market Attractiveness Analysis by Service Type
  • Figure 111: Middle East and Africa Market Value Share and BPS Analysis by Destination, 2025 and 2035
  • Figure 112: Middle East and Africa Market Y-o-Y Growth Comparison by Destination, 2025-2035
  • Figure 113: Middle East and Africa Market Attractiveness Analysis by Destination
  • Figure 114: Middle East and Africa Market Value Share and BPS Analysis by End User, 2025 and 2035
  • Figure 115: Middle East and Africa Market Y-o-Y Growth Comparison by End User, 2025-2035
  • Figure 116: Middle East and Africa Market Attractiveness Analysis by End User
  • Figure 117: Global Market - Tier Structure Analysis
  • Figure 118: Global Market - Company Share Analysis

Frequently Asked Questions

What is the market size of the air cargo market in 2025?

The market size is valued at USD 250 billion in 2025.

How much will the air cargo market reach by 2035?

It is projected to reach USD 420 billion by 2035.

What is the forecast CAGR for the air cargo market from 2025 to 2035?

The market is expected to grow at a CAGR of 5.3% during 2025-2035.

Which type holds the largest share in the market?

Air Freight holds the largest share with 70% in 2025.

Who are the leading players in the market?

FedEx Express, UPS Airlines, and DHL Aviation are among the leading players.

Explore Similar Insights

Future Market Insights

Air Cargo Market