Reports

- Global Locations -

Headquarters

Future Market Insights, Inc.

Christiana Corporate, 200
Continental Drive, Suite 401,
Newark, Delaware - 19713,
United States

T: +1-347-918-3531

Americas

Future Market Insights, Inc.

616 Corporate Way, Suite 2-9018,
Valley Cottage, NY 10989, United States

MEA

Future Market Insights

1602-6 Jumeirah Bay X2 Tower, Plot No: JLT-PH2-X2A,
Jumeirah Lakes Towers, Dubai,
United Arab Emirates

Europe

Future Market Insights

3rd Floor, 207 Regent Street,
W1B 3HH London
United Kingdom

T: + 44 (0) 20 8123 9659

Asia Pacific

Future Market Insights

IndiaLand Global Tech Park, Unit UG-1, Behind Grand HighStreet, Phase 1, Hinjawadi, MH, Pune – 411057, India

Aircraft Landing Gear Market Outlook 2024 to 2034

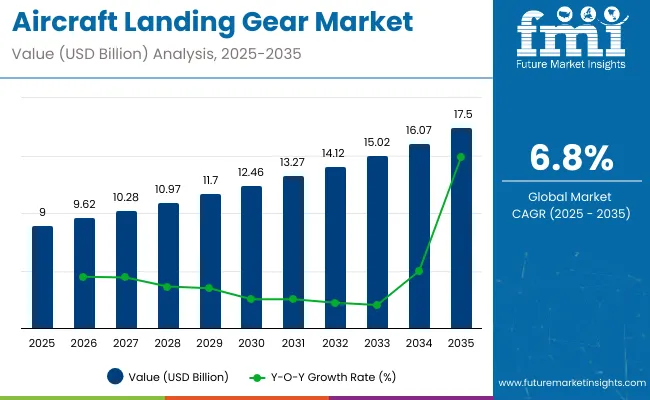
The aircraft landing gear market is valued at US$ 8.00 billion in 2024 and is projected to reach US$ 15.00 billion by 2034, exhibiting a CAGR of 6.5% over the forecast period.

Key Market Drivers:

The aircraft landing gear market generated an estimated revenue of US$ 5.4 billion in 2019. In five years, the market grew at a pace of 8.17% and added revenue of US$ 2.60 billion. Several reasons can be attributed to this growth:

  • The increasing global air travel demand necessitates expanding and modernizing aircraft fleets, leading to a surge in replacements and upgrades of modern landing gear technologies.
  • The use of lightweight materials, advanced sensors, and improved designs are driving the growth of the landing gear market.
  • With the aging global fleet of aircraft, frequent maintenance and eventual landing gear replacements have become significant contributors to market growth.
  • Regulatory mandates for aviation safety standards and the need for compliance with innovative and compliant landing gear systems are prompting airlines to invest in upgrading their landing gear.
  • The increased defense spending has fuelled demand for advanced landing gear systems in both military and dual-use aircraft.
  • The proliferation of low-cost carriers and regional airlines has contributed to the demand for new aircraft, boosting the landing gear market.
  • The development of more efficient landing gear systems is a response to the growing emphasis on fuel efficiency and environmentally sustainable aviation solutions.
  • Airlines also opt for retrofitting existing fleets with improved landing gear to extend the lifespan of aircraft and comply with evolving performance standards.
Attributes Key Statistics
Expected Base Year Value (2024) US$ 8 billion
Anticipated Forecast Value (2034) US$ 15 billion
Estimated Growth (2024 to 2034) 6.5% CAGR

Don't pay for what you don't need

Customize your report by selecting specific countries or regions and save 30%!

Consumption Analysis of the Aircraft Landing Gear Market

  • The market is experiencing increasing demand from commercial airlines as they require landing gear for their fleets of passenger and cargo aircraft.
  • The aircraft landing gear is also widespread among armed forces. These entities employ aircraft landing gear to procure landing gear for military aircraft, including fighters, transport planes, and helicopters.
  • There is a rising adoption of aircraft landing gear by companies that design and produce aircraft to integrate them into their new aircraft during the manufacturing process.
  • The use of aircraft landing gear is also growing among companies that lease aircraft to airlines that are involved in purchasing landing gear as part of their aircraft maintenance and asset management activities.
  • The demand for aircraft landing gear is also touching the skies in entities engaged in aerospace research and development. These entities acquire landing gear for testing and prototyping purposes.
  • The growing adoption of aircraft landing gear is also observed in government organizations responsible for national aviation and defense to procure landing gear for military and governmental aircraft.

Restraining Factors Adversely Affecting the Market

The aircraft landing gear market is anticipated to surpass a valuation of US$ 15 billion by the year 2034, with a growth rate of 6.5%. While the market is expected to experience remarkable growth, several restraining factors could adversely affect its development:

  • The substantial upfront investment required for the procurement and installation of new landing gear systems poses a financial challenge for airlines and aircraft operators with budget constraints
  • Extended periods of aircraft grounding, either due to economic downturns, global crises, or unforeseen events, also impact the demand for new landing gear systems and disrupt market growth.
  • Rapid advancements in aviation technology may lead to shorter product lifecycles for landing gear systems. This keeps smaller companies away from the market as they cannot afford to keep investing in research and development.
  • Economic downturns and uncertainties in global financial markets can lead to reduced air travel demand, impacting airlines' ability and willingness to invest in new landing gear.
Nikhil Kaitwade
Nikhil Kaitwade

Principal Consultant

Talk to Analyst

Find your sweet spots for generating winning opportunities in this market.

Comparative View of Adjacent Industries

A comprehensive study of the global aviation sector has been carried out in the section where two industries have the potential to give rigorous competition to the aircraft landing gear market: the aircraft exterior lighting market and the aircraft cabin interior market.

The current market valuation, growth factors, and critical challenges in the respective markets have been discussed below. Based on these numbers, the market for aircraft exterior lighting is anticipated to overpower the other two in the coming future.

Aircraft Landing Gear Market:

Attributes Aircraft Landing Gear Market
CAGR (2024 to 2034) 6.50%
Growth Factor The increasing global air travel demand and the increased defense spending
Challenges The substantial upfront investment required for the procurement and installation of new landing gear systems

Aircraft Cabin Interior Market:

Attributes Aircraft Cabin Interior Market
CAGR (2023 to 2033) 6.10%
Growth Factor Growing demand for aircraft refurbishing and space optimization in aircraft
Challenges The aviation industry's focus on reducing overall weight for fuel efficiency hinders the adoption of heavy cabin equipment

Aircraft Exterior Lighting Market:

Attributes Aircraft Exterior Lighting Market
CAGR (2023 to 2033) 6.6%
Growth Factor It plays a crucial role in ensuring the safety and efficiency of an aircraft by providing visibility during critical phases such as take-off, landing, and taxiing.
Challenges An aircraft's structural integrity might be jeopardized if a lightning strike results in structural damage, including melted or pitted surface metal.

Category-wise Insights

Main Landing Gear for Aircrafts to Dominate the Global Aviation Sector

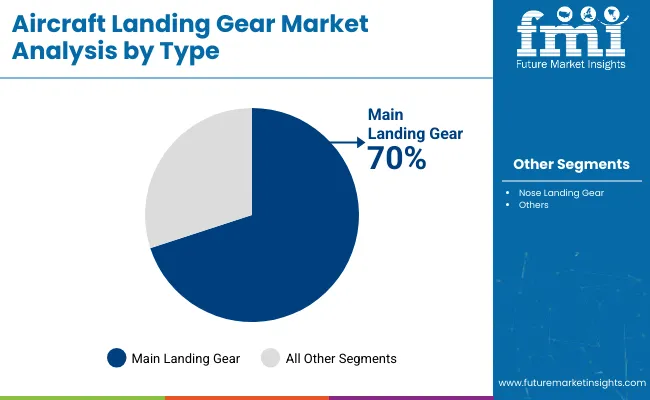
Depending on the type, the aircraft landing gear market is bifurcated into main and nose landing gear. The former is anticipated to grow at a remarkable rate of 6.30% CAGR.

  • The demand for main landing gear in the aviation sector is touching the skies as they play a vital role in supporting the majority of an aircraft's weight during touchdown and ground operations.
  • Their significance is also increasing as the performance of the main landing gear directly impacts the safety, efficiency, and operational capabilities of various types of aircraft.
  • Ongoing technological advancements in materials, design, and manufacturing processes contribute to the improved performance and efficiency of main landing gear systems, augmenting the overall adoption.
Attributes Details
Type Main Landing Gear
CAGR 6.3%

Actuation Systems Take the Lion’s Share in the Global Market

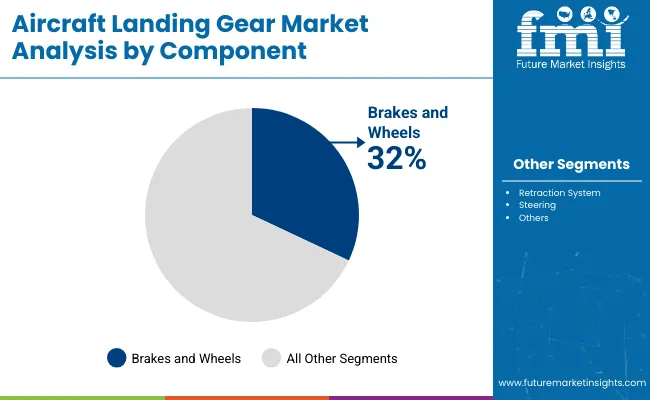
The aircraft landing gear market is categorized by sub-system into actuation, steering, and brake systems. The actuation systems segment dominates the market and is anticipated to grow at a remarkable rate of 6.10%.

  • Actuation systems are in great demand as they play a crucial role in facilitating the controlled movement and positioning of landing gear components, contributing to the safety and precision of aircraft operations during take-off and landing.
  • Factors such as technological advancements, increased air travel, and the continual focus on safety standards also contribute to the increased adoption of actuation systems in the sector.
  • Actuation systems also enjoy widespread preference among aviation companies due to factors such as technological advancements, increased air travel, and the continual focus on safety standards.
Attributes Details
Sub-system Actuation System
CAGR 6.10%

Get the data you need at a Fraction of the cost

Personalize your report by choosing insights you need
and save 40%!

Country-wise Insights

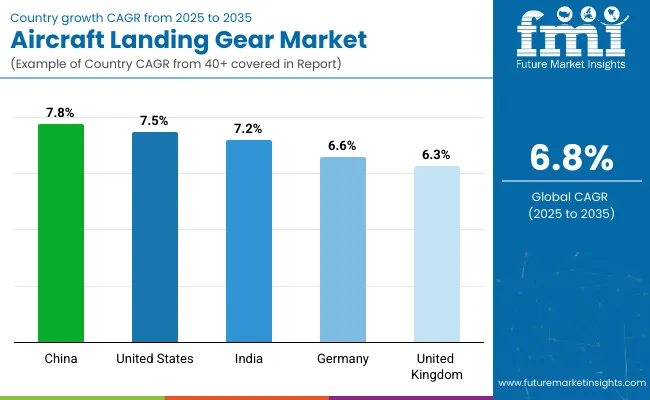
The section provides an analysis of the aircraft landing gear market by country, including Japan, China, the United States, the United Kingdom, and South Korea. The table presents the CAGR for each country, indicating the expected growth of the market in that country through 2034.

Countries CAGR
South Korea 8.50%
Japan 7.90%
The United Kingdom 7.70%
China 6.90%
The United States 6.80%

Demand for Aircraft Landing Gear in South Korea

South Korea is one of the leading countries in this market. The South Korea aircraft landing gear market is anticipated to retain its dominance by progressing at an annual growth rate of 8.50% till 2034.

  • Government initiatives and investments in the aerospace sector, coupled with support for technological advancements, are the biggest drivers for the market.
  • The demand for aircraft, especially in the context of regional and international connectivity, drives the growth of the market.

Sales of Aircraft Landing Gear in Japan

Japan is another Asian country that leads the aircraft landing gear market. The Japan aircraft landing gear market is anticipated to retain its dominance by progressing at an annual growth rate of 7.90% till 2034.

  • With an emphasis on improving regional connectivity, the Japanese aviation sector in the last few years has been expanding exponentially. This has pushed the demand for aircraft equipment, such as aircraft landing gears, to support efficient operations in domestic and international routes.
  • Besides this, Japan's commitment to environmental sustainability in aviation, including the development of fuel-efficient aircraft, encourages the adoption of advanced landing gear technologies.

Aircraft Landing Gear Market in the United Kingdom

The United Kingdom dominates the market of aircraft landing gear in Europe. The United Kingdom aircraft landing gear market is anticipated to exhibit an annual growth rate of 7.70% till 2034.

  • The presence of aerospace clusters and innovation hubs in the country, such as the Farnborough Aerospace Consortium, pushes collaboration and knowledge exchange among key players. This is driving advancements in landing gear technologies, thus increasing the adoption.
  • The United Kingdom's strong focus on defense aviation, coupled with a commitment to modernize military aircraft fleets, generates demand for high-performance landing gear systems in both military and dual-use applications.

Aircraft Landing Gear Industry in China

China is one of the leading countries in Asia for aircraft landing gear, which is anticipated to register a CAGR of 6.90% through 2034.

  • Over the past few years, the Chinese aviation sector has experienced a tremendous surge, mainly due to the rising middle class and increased connectivity. This has resulted in an increased demand for new aircraft and landing gear systems in the country.
  • Apart from this, China is also emerging as a key manufacturing hub for aerospace components, including landing gear. This positions China as one of the leading countries in the international marketplace.

Aircraft Landing Gear Market in the United States

Over the next ten years, the United States' demand for aircraft landing gear is projected to rise at a 6.80% CAGR.

  • The United States is blessed with numerous innovative aviation companies, such as Boeing, Lockheed Martin Corporation, Airbus, etc. This presence generates significant demand for landing gears for aircraft production and modernization projects.
  • Besides this, the United States government spends a substantial amount of its GDP on the defense sector. This spending fuels the demand for advanced landing gear systems for military aircraft, contributing to overall market growth.

Competitive Landscape

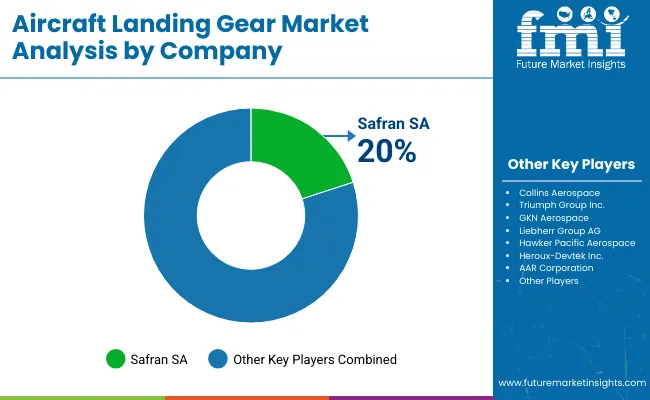
The market for aircraft landing gear is filled with international and domestic companies and is highly fragmented. Safran Landing Systems, Collins Aerospace, Liebherr-Aerospace, Heroux-Devtek, etc., are some of the prominent companies in the aircraft landing gear market. These companies are investing billions of dollars in research and development activities to curate lightweight materials, advanced sensors, and smart technologies to improve performance, fuel efficiency, and safety.

Recent Developments:

  • In October 2023, Supernal announced a collaboration with Mecaer Aviation Group and Hyundai WIA to develop landing gear for its SA-1 eVTOL aircraft, with plans for a technology demonstrator by late 2024. The partnership capitalizes on Mecaer's expertise in landing gear design and Hyundai WIA's precision manufacturing capabilities.
  • In June 2023, United Kingdom-based TISICS unveiled Light Land, a sustainable and high-strength landing gear for commercial aircraft, comprising the world's largest fiber-reinforced metal composite component. The innovation, developed with £2.5 million R&D funding, promises improved fuel efficiency and aligns with the aerospace industry's net-zero emissions goal by 2050.
  • In August 2023, WAAM3D joined the I-Break project, a £22.5m collaboration led by Airbus and 15 partners. The initiative aimed to advance lower-emission aerospace technology by innovating landing gear components, utilizing additive manufacturing and composite techniques to accelerate production and reduce the industrial CO2 footprint by 30%.

Key Companies in the Market

  • Safran Landing Systems
  • Collins Aerospace (Raytheon Technologies)
  • Liebherr-Aerospace
  • Heroux-Devtek
  • Triumph Group
  • UTC Aerospace Systems (now part of Raytheon Technologies)
  • Meggitt PLC
  • Eaton Corporation
  • CIRCOR Aerospace
  • Parker Hannifin Corporation
  • Moog Inc.
  • AAR Corp.
  • Shimadzu Precision Instruments, Inc.
  • UTC Landing Systems (a part of Raytheon Technologies)
  • GKN Aerospace
  • Honeywell Aerospace
  • Crane Aerospace & Electronics
  • Woodward, Inc.
  • Crane Co.
  • SKF Group

Key Segments in the Aircraft Landing Gear Market

By Type:

  • Main Landing Gear
  • Nose Landing Gear

By Sub-system:

  • Actuation System
  • Steering System
  • Brake System
  • Others

By Aircraft Type:

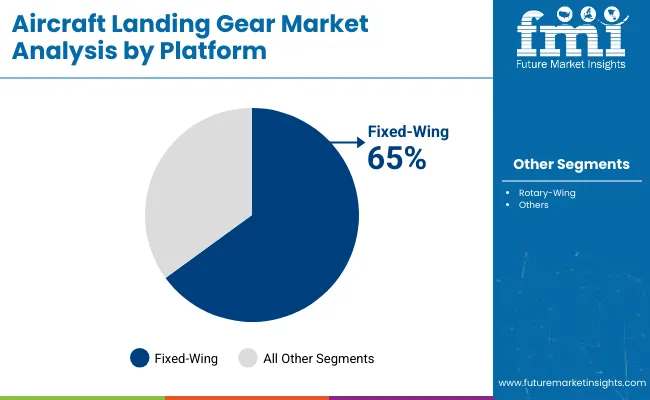
  • Fixed Wing
  • Rotary Wing

By End User:

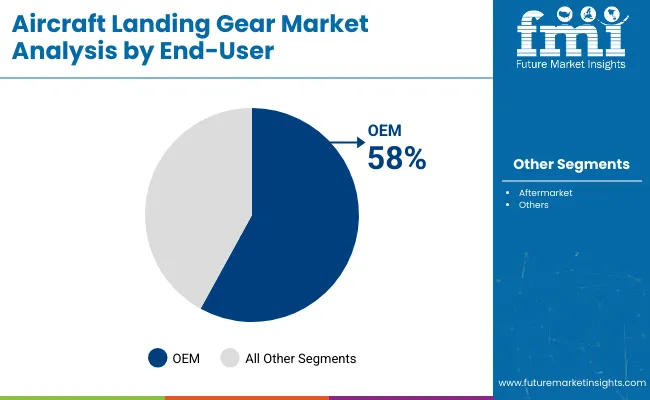
  • OEM
  • Aftermarket

By Region:

  • North America
  • Latin America
  • Asia Pacific
  • The Middle East and Africa (MEA)
  • Europe

Frequently Asked Questions

How Much is the Aircraft Landing Gear Market Currently Worth?

The global market is expected to be worth US$ 8 billion by 2024.

What is the Sales Forecast for Aircraft Landing Gear Through 2034?

The market for aircraft landing gear is expected to reach US$ 15 billion by 2034.

At What Rate is the Aircraft Landing Gear Market Growing?

The sales of aircraft landing gear are growing at a rate of 6.5 % from 2024 to 2034.

Who are the Key Manufacturing Companies for Aircraft Landing Gear?

Some of the key players in the market are Safran Landing Systems, Collins Aerospace, Liebherr-Aerospace, Heroux-Devtek, etc.

What was the Overall Valuation of the Aircraft Landing Gear Market in 2023?

The market valuation for the aircraft landing gear in 2023 was US$ 7.40 billion.

Table of Content

1. Executive Summary

    1.1. Global Market Outlook

    1.2. Demand-side Trends

    1.3. Supply-side Trends

    1.4. Technology Roadmap Analysis

    1.5. Analysis and Recommendations

2. Market Overview

    2.1. Market Coverage / Taxonomy

    2.2. Market Definition / Scope / Limitations

3. Market Background

    3.1. Market Dynamics

        3.1.1. Drivers

        3.1.2. Restraints

        3.1.3. Opportunity

        3.1.4. Trends

    3.2. Scenario Forecast

        3.2.1. Demand in Optimistic Scenario

        3.2.2. Demand in Likely Scenario

        3.2.3. Demand in Conservative Scenario

    3.3. Opportunity Map Analysis

    3.4. Product Life Cycle Analysis

    3.5. Supply Chain Analysis

        3.5.1. Supply Side Participants and their Roles

            3.5.1.1. Producers

            3.5.1.2. Mid-Level Participants (Traders/ Agents/ Brokers)

            3.5.1.3. Wholesalers and Distributors

        3.5.2. Value Added and Value Created at Node in the Supply Chain

        3.5.3. List of Raw Material Suppliers

        3.5.4. List of Existing and Potential Buyer’s

    3.6. Investment Feasibility Matrix

    3.7. Value Chain Analysis

        3.7.1. Profit Margin Analysis

        3.7.2. Wholesalers and Distributors

        3.7.3. Retailers

    3.8. PESTLE and Porter’s Analysis

    3.9. Regulatory Landscape

        3.9.1. By Key Regions

        3.9.2. By Key Countries

    3.10. Regional Parent Market Outlook

    3.11. Production and Consumption Statistics

    3.12. Import and Export Statistics

4. Global Market Analysis 2019 to 2023 and Forecast, 2024 to 2034

    4.1. Historical Market Size Value (US$ Million) & Volume (Units) Analysis, 2019 to 2023

    4.2. Current and Future Market Size Value (US$ Million) & Volume (Units) Projections, 2024 to 2034

        4.2.1. Y-o-Y Growth Trend Analysis

        4.2.2. Absolute $ Opportunity Analysis

5. Global Market Analysis 2019 to 2023 and Forecast 2024 to 2034, By Type

    5.1. Introduction / Key Findings

    5.2. Historical Market Size Value (US$ Million) & Volume (Units) Analysis By Type, 2019 to 2023

    5.3. Current and Future Market Size Value (US$ Million) & Volume (Units) Analysis and Forecast By Type, 2024 to 2034

        5.3.1. Main Landing Gear

        5.3.2. Nose Landing Gear

    5.4. Y-o-Y Growth Trend Analysis By Type, 2019 to 2023

    5.5. Absolute $ Opportunity Analysis By Type, 2024 to 2034

6. Global Market Analysis 2019 to 2023 and Forecast 2024 to 2034, By Sub-System

    6.1. Introduction / Key Findings

    6.2. Historical Market Size Value (US$ Million) & Volume (Units) Analysis By Sub-System, 2019 to 2023

    6.3. Current and Future Market Size Value (US$ Million) & Volume (Units) Analysis and Forecast By Sub-System, 2024 to 2034

        6.3.1. Actuation System

        6.3.2. Steering System

        6.3.3. Brake System

        6.3.4. Others

    6.4. Y-o-Y Growth Trend Analysis By Sub-System, 2019 to 2023

    6.5. Absolute $ Opportunity Analysis By Sub-System, 2024 to 2034

7. Global Market Analysis 2019 to 2023 and Forecast 2024 to 2034, By Aircraft Type

    7.1. Introduction / Key Findings

    7.2. Historical Market Size Value (US$ Million) & Volume (Units) Analysis By Aircraft Type, 2019 to 2023

    7.3. Current and Future Market Size Value (US$ Million) & Volume (Units) Analysis and Forecast By Aircraft Type, 2024 to 2034

        7.3.1. Fixed Wing

        7.3.2. Rotary Wing

    7.4. Y-o-Y Growth Trend Analysis By Aircraft Type, 2019 to 2023

    7.5. Absolute $ Opportunity Analysis By Aircraft Type, 2024 to 2034

8. Global Market Analysis 2019 to 2023 and Forecast 2024 to 2034, By End-User

    8.1. Introduction / Key Findings

    8.2. Historical Market Size Value (US$ Million) & Volume (Units) Analysis By End-User, 2019 to 2023

    8.3. Current and Future Market Size Value (US$ Million) & Volume (Units) Analysis and Forecast By End-User, 2024 to 2034

        8.3.1. OEM

        8.3.2. Aftermarket

    8.4. Y-o-Y Growth Trend Analysis By End-User, 2019 to 2023

    8.5. Absolute $ Opportunity Analysis By End-User, 2024 to 2034

9. Global Market Analysis 2019 to 2023 and Forecast 2024 to 2034, By Region

    9.1. Introduction

    9.2. Historical Market Size Value (US$ Million) & Volume (Units) Analysis By Region, 2019 to 2023

    9.3. Current Market Size Value (US$ Million) & Volume (Units) Analysis and Forecast By Region, 2024 to 2034

        9.3.1. North America

        9.3.2. Latin America

        9.3.3. Western Europe

        9.3.4. Eastern Europe

        9.3.5. South Asia and Pacific

        9.3.6. East Asia

        9.3.7. Middle East and Africa

    9.4. Market Attractiveness Analysis By Region

10. North America Market Analysis 2019 to 2023 and Forecast 2024 to 2034, By Country

    10.1. Historical Market Size Value (US$ Million) & Volume (Units) Trend Analysis By Market Taxonomy, 2019 to 2023

    10.2. Market Size Value (US$ Million) & Volume (Units) Forecast By Market Taxonomy, 2024 to 2034

        10.2.1. By Country

            10.2.1.1. USA

            10.2.1.2. Canada

        10.2.2. By Type

        10.2.3. By Sub-System

        10.2.4. By Aircraft Type

        10.2.5. By End-User

    10.3. Market Attractiveness Analysis

        10.3.1. By Country

        10.3.2. By Type

        10.3.3. By Sub-System

        10.3.4. By Aircraft Type

        10.3.5. By End-User

    10.4. Key Takeaways

11. Latin America Market Analysis 2019 to 2023 and Forecast 2024 to 2034, By Country

    11.1. Historical Market Size Value (US$ Million) & Volume (Units) Trend Analysis By Market Taxonomy, 2019 to 2023

    11.2. Market Size Value (US$ Million) & Volume (Units) Forecast By Market Taxonomy, 2024 to 2034

        11.2.1. By Country

            11.2.1.1. Brazil

            11.2.1.2. Mexico

            11.2.1.3. Rest of Latin America

        11.2.2. By Type

        11.2.3. By Sub-System

        11.2.4. By Aircraft Type

        11.2.5. By End-User

    11.3. Market Attractiveness Analysis

        11.3.1. By Country

        11.3.2. By Type

        11.3.3. By Sub-System

        11.3.4. By Aircraft Type

        11.3.5. By End-User

    11.4. Key Takeaways

12. Western Europe Market Analysis 2019 to 2023 and Forecast 2024 to 2034, By Country

    12.1. Historical Market Size Value (US$ Million) & Volume (Units) Trend Analysis By Market Taxonomy, 2019 to 2023

    12.2. Market Size Value (US$ Million) & Volume (Units) Forecast By Market Taxonomy, 2024 to 2034

        12.2.1. By Country

            12.2.1.1. Germany

            12.2.1.2. UK

            12.2.1.3. France

            12.2.1.4. Spain

            12.2.1.5. Italy

            12.2.1.6. Rest of Western Europe

        12.2.2. By Type

        12.2.3. By Sub-System

        12.2.4. By Aircraft Type

        12.2.5. By End-User

    12.3. Market Attractiveness Analysis

        12.3.1. By Country

        12.3.2. By Type

        12.3.3. By Sub-System

        12.3.4. By Aircraft Type

        12.3.5. By End-User

    12.4. Key Takeaways

13. Eastern Europe Market Analysis 2019 to 2023 and Forecast 2024 to 2034, By Country

    13.1. Historical Market Size Value (US$ Million) & Volume (Units) Trend Analysis By Market Taxonomy, 2019 to 2023

    13.2. Market Size Value (US$ Million) & Volume (Units) Forecast By Market Taxonomy, 2024 to 2034

        13.2.1. By Country

            13.2.1.1. Poland

            13.2.1.2. Russia

            13.2.1.3. Czech Republic

            13.2.1.4. Romania

            13.2.1.5. Rest of Eastern Europe

        13.2.2. By Type

        13.2.3. By Sub-System

        13.2.4. By Aircraft Type

        13.2.5. By End-User

    13.3. Market Attractiveness Analysis

        13.3.1. By Country

        13.3.2. By Type

        13.3.3. By Sub-System

        13.3.4. By Aircraft Type

        13.3.5. By End-User

    13.4. Key Takeaways

14. South Asia and Pacific Market Analysis 2019 to 2023 and Forecast 2024 to 2034, By Country

    14.1. Historical Market Size Value (US$ Million) & Volume (Units) Trend Analysis By Market Taxonomy, 2019 to 2023

    14.2. Market Size Value (US$ Million) & Volume (Units) Forecast By Market Taxonomy, 2024 to 2034

        14.2.1. By Country

            14.2.1.1. India

            14.2.1.2. Bangladesh

            14.2.1.3. Australia

            14.2.1.4. New Zealand

            14.2.1.5. Rest of South Asia and Pacific

        14.2.2. By Type

        14.2.3. By Sub-System

        14.2.4. By Aircraft Type

        14.2.5. By End-User

    14.3. Market Attractiveness Analysis

        14.3.1. By Country

        14.3.2. By Type

        14.3.3. By Sub-System

        14.3.4. By Aircraft Type

        14.3.5. By End-User

    14.4. Key Takeaways

15. East Asia Market Analysis 2019 to 2023 and Forecast 2024 to 2034, By Country

    15.1. Historical Market Size Value (US$ Million) & Volume (Units) Trend Analysis By Market Taxonomy, 2019 to 2023

    15.2. Market Size Value (US$ Million) & Volume (Units) Forecast By Market Taxonomy, 2024 to 2034

        15.2.1. By Country

            15.2.1.1. China

            15.2.1.2. Japan

            15.2.1.3. South Korea

        15.2.2. By Type

        15.2.3. By Sub-System

        15.2.4. By Aircraft Type

        15.2.5. By End-User

    15.3. Market Attractiveness Analysis

        15.3.1. By Country

        15.3.2. By Type

        15.3.3. By Sub-System

        15.3.4. By Aircraft Type

        15.3.5. By End-User

    15.4. Key Takeaways

16. Middle East and Africa Market Analysis 2019 to 2023 and Forecast 2024 to 2034, By Country

    16.1. Historical Market Size Value (US$ Million) & Volume (Units) Trend Analysis By Market Taxonomy, 2019 to 2023

    16.2. Market Size Value (US$ Million) & Volume (Units) Forecast By Market Taxonomy, 2024 to 2034

        16.2.1. By Country

            16.2.1.1. GCC Countries

            16.2.1.2. South Africa

            16.2.1.3. Israel

            16.2.1.4. Rest of MEA

        16.2.2. By Type

        16.2.3. By Sub-System

        16.2.4. By Aircraft Type

        16.2.5. By End-User

    16.3. Market Attractiveness Analysis

        16.3.1. By Country

        16.3.2. By Type

        16.3.3. By Sub-System

        16.3.4. By Aircraft Type

        16.3.5. By End-User

    16.4. Key Takeaways

17. Key Countries Market Analysis

    17.1. USA

        17.1.1. Pricing Analysis

        17.1.2. Market Share Analysis, 2023

            17.1.2.1. By Type

            17.1.2.2. By Sub-System

            17.1.2.3. By Aircraft Type

            17.1.2.4. By End-User

    17.2. Canada

        17.2.1. Pricing Analysis

        17.2.2. Market Share Analysis, 2023

            17.2.2.1. By Type

            17.2.2.2. By Sub-System

            17.2.2.3. By Aircraft Type

            17.2.2.4. By End-User

    17.3. Brazil

        17.3.1. Pricing Analysis

        17.3.2. Market Share Analysis, 2023

            17.3.2.1. By Type

            17.3.2.2. By Sub-System

            17.3.2.3. By Aircraft Type

            17.3.2.4. By End-User

    17.4. Mexico

        17.4.1. Pricing Analysis

        17.4.2. Market Share Analysis, 2023

            17.4.2.1. By Type

            17.4.2.2. By Sub-System

            17.4.2.3. By Aircraft Type

            17.4.2.4. By End-User

    17.5. Germany

        17.5.1. Pricing Analysis

        17.5.2. Market Share Analysis, 2023

            17.5.2.1. By Type

            17.5.2.2. By Sub-System

            17.5.2.3. By Aircraft Type

            17.5.2.4. By End-User

    17.6. UK

        17.6.1. Pricing Analysis

        17.6.2. Market Share Analysis, 2023

            17.6.2.1. By Type

            17.6.2.2. By Sub-System

            17.6.2.3. By Aircraft Type

            17.6.2.4. By End-User

    17.7. France

        17.7.1. Pricing Analysis

        17.7.2. Market Share Analysis, 2023

            17.7.2.1. By Type

            17.7.2.2. By Sub-System

            17.7.2.3. By Aircraft Type

            17.7.2.4. By End-User

    17.8. Spain

        17.8.1. Pricing Analysis

        17.8.2. Market Share Analysis, 2023

            17.8.2.1. By Type

            17.8.2.2. By Sub-System

            17.8.2.3. By Aircraft Type

            17.8.2.4. By End-User

    17.9. Italy

        17.9.1. Pricing Analysis

        17.9.2. Market Share Analysis, 2023

            17.9.2.1. By Type

            17.9.2.2. By Sub-System

            17.9.2.3. By Aircraft Type

            17.9.2.4. By End-User

    17.10. Poland

        17.10.1. Pricing Analysis

        17.10.2. Market Share Analysis, 2023

            17.10.2.1. By Type

            17.10.2.2. By Sub-System

            17.10.2.3. By Aircraft Type

            17.10.2.4. By End-User

    17.11. Russia

        17.11.1. Pricing Analysis

        17.11.2. Market Share Analysis, 2023

            17.11.2.1. By Type

            17.11.2.2. By Sub-System

            17.11.2.3. By Aircraft Type

            17.11.2.4. By End-User

    17.12. Czech Republic

        17.12.1. Pricing Analysis

        17.12.2. Market Share Analysis, 2023

            17.12.2.1. By Type

            17.12.2.2. By Sub-System

            17.12.2.3. By Aircraft Type

            17.12.2.4. By End-User

    17.13. Romania

        17.13.1. Pricing Analysis

        17.13.2. Market Share Analysis, 2023

            17.13.2.1. By Type

            17.13.2.2. By Sub-System

            17.13.2.3. By Aircraft Type

            17.13.2.4. By End-User

    17.14. India

        17.14.1. Pricing Analysis

        17.14.2. Market Share Analysis, 2023

            17.14.2.1. By Type

            17.14.2.2. By Sub-System

            17.14.2.3. By Aircraft Type

            17.14.2.4. By End-User

    17.15. Bangladesh

        17.15.1. Pricing Analysis

        17.15.2. Market Share Analysis, 2023

            17.15.2.1. By Type

            17.15.2.2. By Sub-System

            17.15.2.3. By Aircraft Type

            17.15.2.4. By End-User

    17.16. Australia

        17.16.1. Pricing Analysis

        17.16.2. Market Share Analysis, 2023

            17.16.2.1. By Type

            17.16.2.2. By Sub-System

            17.16.2.3. By Aircraft Type

            17.16.2.4. By End-User

    17.17. New Zealand

        17.17.1. Pricing Analysis

        17.17.2. Market Share Analysis, 2023

            17.17.2.1. By Type

            17.17.2.2. By Sub-System

            17.17.2.3. By Aircraft Type

            17.17.2.4. By End-User

    17.18. China

        17.18.1. Pricing Analysis

        17.18.2. Market Share Analysis, 2023

            17.18.2.1. By Type

            17.18.2.2. By Sub-System

            17.18.2.3. By Aircraft Type

            17.18.2.4. By End-User

    17.19. Japan

        17.19.1. Pricing Analysis

        17.19.2. Market Share Analysis, 2023

            17.19.2.1. By Type

            17.19.2.2. By Sub-System

            17.19.2.3. By Aircraft Type

            17.19.2.4. By End-User

    17.20. South Korea

        17.20.1. Pricing Analysis

        17.20.2. Market Share Analysis, 2023

            17.20.2.1. By Type

            17.20.2.2. By Sub-System

            17.20.2.3. By Aircraft Type

            17.20.2.4. By End-User

    17.21. GCC Countries

        17.21.1. Pricing Analysis

        17.21.2. Market Share Analysis, 2023

            17.21.2.1. By Type

            17.21.2.2. By Sub-System

            17.21.2.3. By Aircraft Type

            17.21.2.4. By End-User

    17.22. South Africa

        17.22.1. Pricing Analysis

        17.22.2. Market Share Analysis, 2023

            17.22.2.1. By Type

            17.22.2.2. By Sub-System

            17.22.2.3. By Aircraft Type

            17.22.2.4. By End-User

    17.23. Israel

        17.23.1. Pricing Analysis

        17.23.2. Market Share Analysis, 2023

            17.23.2.1. By Type

            17.23.2.2. By Sub-System

            17.23.2.3. By Aircraft Type

            17.23.2.4. By End-User

18. Market Structure Analysis

    18.1. Competition Dashboard

    18.2. Competition Benchmarking

    18.3. Market Share Analysis of Top Players

        18.3.1. By Regional

        18.3.2. By Type

        18.3.3. By Sub-System

        18.3.4. By Aircraft Type

        18.3.5. By End-User

19. Competition Analysis

    19.1. Competition Deep Dive

        19.1.1. Circor International

            19.1.1.1. Overview

            19.1.1.2. Product Portfolio

            19.1.1.3. Profitability by Market Segments

            19.1.1.4. Sales Footprint

            19.1.1.5. Strategy Overview

                19.1.1.5.1. Marketing Strategy

                19.1.1.5.2. Product Strategy

                19.1.1.5.3. Channel Strategy

        19.1.2. Eaton Corporation

            19.1.2.1. Overview

            19.1.2.2. Product Portfolio

            19.1.2.3. Profitability by Market Segments

            19.1.2.4. Sales Footprint

            19.1.2.5. Strategy Overview

                19.1.2.5.1. Marketing Strategy

                19.1.2.5.2. Product Strategy

                19.1.2.5.3. Channel Strategy

        19.1.3. GKN Aerospace

            19.1.3.1. Overview

            19.1.3.2. Product Portfolio

            19.1.3.3. Profitability by Market Segments

            19.1.3.4. Sales Footprint

            19.1.3.5. Strategy Overview

                19.1.3.5.1. Marketing Strategy

                19.1.3.5.2. Product Strategy

                19.1.3.5.3. Channel Strategy

        19.1.4. Hawker Pacific Aerospace

            19.1.4.1. Overview

            19.1.4.2. Product Portfolio

            19.1.4.3. Profitability by Market Segments

            19.1.4.4. Sales Footprint

            19.1.4.5. Strategy Overview

                19.1.4.5.1. Marketing Strategy

                19.1.4.5.2. Product Strategy

                19.1.4.5.3. Channel Strategy

        19.1.5. Heroux-Devtek, Inc

            19.1.5.1. Overview

            19.1.5.2. Product Portfolio

            19.1.5.3. Profitability by Market Segments

            19.1.5.4. Sales Footprint

            19.1.5.5. Strategy Overview

                19.1.5.5.1. Marketing Strategy

                19.1.5.5.2. Product Strategy

                19.1.5.5.3. Channel Strategy

        19.1.6. Honeywell International

            19.1.6.1. Overview

            19.1.6.2. Product Portfolio

            19.1.6.3. Profitability by Market Segments

            19.1.6.4. Sales Footprint

            19.1.6.5. Strategy Overview

                19.1.6.5.1. Marketing Strategy

                19.1.6.5.2. Product Strategy

                19.1.6.5.3. Channel Strategy

        19.1.7. Liebherr Group

            19.1.7.1. Overview

            19.1.7.2. Product Portfolio

            19.1.7.3. Profitability by Market Segments

            19.1.7.4. Sales Footprint

            19.1.7.5. Strategy Overview

                19.1.7.5.1. Marketing Strategy

                19.1.7.5.2. Product Strategy

                19.1.7.5.3. Channel Strategy

        19.1.8. Magellan Aerospace

            19.1.8.1. Overview

            19.1.8.2. Product Portfolio

            19.1.8.3. Profitability by Market Segments

            19.1.8.4. Sales Footprint

            19.1.8.5. Strategy Overview

                19.1.8.5.1. Marketing Strategy

                19.1.8.5.2. Product Strategy

                19.1.8.5.3. Channel Strategy

        19.1.9. Safran

            19.1.9.1. Overview

            19.1.9.2. Product Portfolio

            19.1.9.3. Profitability by Market Segments

            19.1.9.4. Sales Footprint

            19.1.9.5. Strategy Overview

                19.1.9.5.1. Marketing Strategy

                19.1.9.5.2. Product Strategy

                19.1.9.5.3. Channel Strategy

        19.1.10. Triumph Group

            19.1.10.1. Overview

            19.1.10.2. Product Portfolio

            19.1.10.3. Profitability by Market Segments

            19.1.10.4. Sales Footprint

            19.1.10.5. Strategy Overview

                19.1.10.5.1. Marketing Strategy

                19.1.10.5.2. Product Strategy

                19.1.10.5.3. Channel Strategy

20. Assumptions & Acronyms Used

21. Research Methodology

List of Tables

Table 1: Global Market Value (US$ Million) Forecast by Region, 2019 to 2034

Table 2: Global Market Volume (Units) Forecast by Region, 2019 to 2034

Table 3: Global Market Value (US$ Million) Forecast by Type, 2019 to 2034

Table 4: Global Market Volume (Units) Forecast by Type, 2019 to 2034

Table 5: Global Market Value (US$ Million) Forecast by Sub-System, 2019 to 2034

Table 6: Global Market Volume (Units) Forecast by Sub-System, 2019 to 2034

Table 7: Global Market Value (US$ Million) Forecast by Aircraft Type, 2019 to 2034

Table 8: Global Market Volume (Units) Forecast by Aircraft Type, 2019 to 2034

Table 9: Global Market Value (US$ Million) Forecast by End-User, 2019 to 2034

Table 10: Global Market Volume (Units) Forecast by End-User, 2019 to 2034

Table 11: North America Market Value (US$ Million) Forecast by Country, 2019 to 2034

Table 12: North America Market Volume (Units) Forecast by Country, 2019 to 2034

Table 13: North America Market Value (US$ Million) Forecast by Type, 2019 to 2034

Table 14: North America Market Volume (Units) Forecast by Type, 2019 to 2034

Table 15: North America Market Value (US$ Million) Forecast by Sub-System, 2019 to 2034

Table 16: North America Market Volume (Units) Forecast by Sub-System, 2019 to 2034

Table 17: North America Market Value (US$ Million) Forecast by Aircraft Type, 2019 to 2034

Table 18: North America Market Volume (Units) Forecast by Aircraft Type, 2019 to 2034

Table 19: North America Market Value (US$ Million) Forecast by End-User, 2019 to 2034

Table 20: North America Market Volume (Units) Forecast by End-User, 2019 to 2034

Table 21: Latin America Market Value (US$ Million) Forecast by Country, 2019 to 2034

Table 22: Latin America Market Volume (Units) Forecast by Country, 2019 to 2034

Table 23: Latin America Market Value (US$ Million) Forecast by Type, 2019 to 2034

Table 24: Latin America Market Volume (Units) Forecast by Type, 2019 to 2034

Table 25: Latin America Market Value (US$ Million) Forecast by Sub-System, 2019 to 2034

Table 26: Latin America Market Volume (Units) Forecast by Sub-System, 2019 to 2034

Table 27: Latin America Market Value (US$ Million) Forecast by Aircraft Type, 2019 to 2034

Table 28: Latin America Market Volume (Units) Forecast by Aircraft Type, 2019 to 2034

Table 29: Latin America Market Value (US$ Million) Forecast by End-User, 2019 to 2034

Table 30: Latin America Market Volume (Units) Forecast by End-User, 2019 to 2034

Table 31: Western Europe Market Value (US$ Million) Forecast by Country, 2019 to 2034

Table 32: Western Europe Market Volume (Units) Forecast by Country, 2019 to 2034

Table 33: Western Europe Market Value (US$ Million) Forecast by Type, 2019 to 2034

Table 34: Western Europe Market Volume (Units) Forecast by Type, 2019 to 2034

Table 35: Western Europe Market Value (US$ Million) Forecast by Sub-System, 2019 to 2034

Table 36: Western Europe Market Volume (Units) Forecast by Sub-System, 2019 to 2034

Table 37: Western Europe Market Value (US$ Million) Forecast by Aircraft Type, 2019 to 2034

Table 38: Western Europe Market Volume (Units) Forecast by Aircraft Type, 2019 to 2034

Table 39: Western Europe Market Value (US$ Million) Forecast by End-User, 2019 to 2034

Table 40: Western Europe Market Volume (Units) Forecast by End-User, 2019 to 2034

Table 41: Eastern Europe Market Value (US$ Million) Forecast by Country, 2019 to 2034

Table 42: Eastern Europe Market Volume (Units) Forecast by Country, 2019 to 2034

Table 43: Eastern Europe Market Value (US$ Million) Forecast by Type, 2019 to 2034

Table 44: Eastern Europe Market Volume (Units) Forecast by Type, 2019 to 2034

Table 45: Eastern Europe Market Value (US$ Million) Forecast by Sub-System, 2019 to 2034

Table 46: Eastern Europe Market Volume (Units) Forecast by Sub-System, 2019 to 2034

Table 47: Eastern Europe Market Value (US$ Million) Forecast by Aircraft Type, 2019 to 2034

Table 48: Eastern Europe Market Volume (Units) Forecast by Aircraft Type, 2019 to 2034

Table 49: Eastern Europe Market Value (US$ Million) Forecast by End-User, 2019 to 2034

Table 50: Eastern Europe Market Volume (Units) Forecast by End-User, 2019 to 2034

Table 51: South Asia and Pacific Market Value (US$ Million) Forecast by Country, 2019 to 2034

Table 52: South Asia and Pacific Market Volume (Units) Forecast by Country, 2019 to 2034

Table 53: South Asia and Pacific Market Value (US$ Million) Forecast by Type, 2019 to 2034

Table 54: South Asia and Pacific Market Volume (Units) Forecast by Type, 2019 to 2034

Table 55: South Asia and Pacific Market Value (US$ Million) Forecast by Sub-System, 2019 to 2034

Table 56: South Asia and Pacific Market Volume (Units) Forecast by Sub-System, 2019 to 2034

Table 57: South Asia and Pacific Market Value (US$ Million) Forecast by Aircraft Type, 2019 to 2034

Table 58: South Asia and Pacific Market Volume (Units) Forecast by Aircraft Type, 2019 to 2034

Table 59: South Asia and Pacific Market Value (US$ Million) Forecast by End-User, 2019 to 2034

Table 60: South Asia and Pacific Market Volume (Units) Forecast by End-User, 2019 to 2034

Table 61: East Asia Market Value (US$ Million) Forecast by Country, 2019 to 2034

Table 62: East Asia Market Volume (Units) Forecast by Country, 2019 to 2034

Table 63: East Asia Market Value (US$ Million) Forecast by Type, 2019 to 2034

Table 64: East Asia Market Volume (Units) Forecast by Type, 2019 to 2034

Table 65: East Asia Market Value (US$ Million) Forecast by Sub-System, 2019 to 2034

Table 66: East Asia Market Volume (Units) Forecast by Sub-System, 2019 to 2034

Table 67: East Asia Market Value (US$ Million) Forecast by Aircraft Type, 2019 to 2034

Table 68: East Asia Market Volume (Units) Forecast by Aircraft Type, 2019 to 2034

Table 69: East Asia Market Value (US$ Million) Forecast by End-User, 2019 to 2034

Table 70: East Asia Market Volume (Units) Forecast by End-User, 2019 to 2034

Table 71: Middle East and Africa Market Value (US$ Million) Forecast by Country, 2019 to 2034

Table 72: Middle East and Africa Market Volume (Units) Forecast by Country, 2019 to 2034

Table 73: Middle East and Africa Market Value (US$ Million) Forecast by Type, 2019 to 2034

Table 74: Middle East and Africa Market Volume (Units) Forecast by Type, 2019 to 2034

Table 75: Middle East and Africa Market Value (US$ Million) Forecast by Sub-System, 2019 to 2034

Table 76: Middle East and Africa Market Volume (Units) Forecast by Sub-System, 2019 to 2034

Table 77: Middle East and Africa Market Value (US$ Million) Forecast by Aircraft Type, 2019 to 2034

Table 78: Middle East and Africa Market Volume (Units) Forecast by Aircraft Type, 2019 to 2034

Table 79: Middle East and Africa Market Value (US$ Million) Forecast by End-User, 2019 to 2034

Table 80: Middle East and Africa Market Volume (Units) Forecast by End-User, 2019 to 2034

List of Charts

Figure 1: Global Market Value (US$ Million) by Type, 2024 to 2034

Figure 2: Global Market Value (US$ Million) by Sub-System, 2024 to 2034

Figure 3: Global Market Value (US$ Million) by Aircraft Type, 2024 to 2034

Figure 4: Global Market Value (US$ Million) by End-User, 2024 to 2034

Figure 5: Global Market Value (US$ Million) by Region, 2024 to 2034

Figure 6: Global Market Value (US$ Million) Analysis by Region, 2019 to 2034

Figure 7: Global Market Volume (Units) Analysis by Region, 2019 to 2034

Figure 8: Global Market Value Share (%) and BPS Analysis by Region, 2024 to 2034

Figure 9: Global Market Y-o-Y Growth (%) Projections by Region, 2024 to 2034

Figure 10: Global Market Value (US$ Million) Analysis by Type, 2019 to 2034

Figure 11: Global Market Volume (Units) Analysis by Type, 2019 to 2034

Figure 12: Global Market Value Share (%) and BPS Analysis by Type, 2024 to 2034

Figure 13: Global Market Y-o-Y Growth (%) Projections by Type, 2024 to 2034

Figure 14: Global Market Value (US$ Million) Analysis by Sub-System, 2019 to 2034

Figure 15: Global Market Volume (Units) Analysis by Sub-System, 2019 to 2034

Figure 16: Global Market Value Share (%) and BPS Analysis by Sub-System, 2024 to 2034

Figure 17: Global Market Y-o-Y Growth (%) Projections by Sub-System, 2024 to 2034

Figure 18: Global Market Value (US$ Million) Analysis by Aircraft Type, 2019 to 2034

Figure 19: Global Market Volume (Units) Analysis by Aircraft Type, 2019 to 2034

Figure 20: Global Market Value Share (%) and BPS Analysis by Aircraft Type, 2024 to 2034

Figure 21: Global Market Y-o-Y Growth (%) Projections by Aircraft Type, 2024 to 2034

Figure 22: Global Market Value (US$ Million) Analysis by End-User, 2019 to 2034

Figure 23: Global Market Volume (Units) Analysis by End-User, 2019 to 2034

Figure 24: Global Market Value Share (%) and BPS Analysis by End-User, 2024 to 2034

Figure 25: Global Market Y-o-Y Growth (%) Projections by End-User, 2024 to 2034

Figure 26: Global Market Attractiveness by Type, 2024 to 2034

Figure 27: Global Market Attractiveness by Sub-System, 2024 to 2034

Figure 28: Global Market Attractiveness by Aircraft Type, 2024 to 2034

Figure 29: Global Market Attractiveness by End-User, 2024 to 2034

Figure 30: Global Market Attractiveness by Region, 2024 to 2034

Figure 31: North America Market Value (US$ Million) by Type, 2024 to 2034

Figure 32: North America Market Value (US$ Million) by Sub-System, 2024 to 2034

Figure 33: North America Market Value (US$ Million) by Aircraft Type, 2024 to 2034

Figure 34: North America Market Value (US$ Million) by End-User, 2024 to 2034

Figure 35: North America Market Value (US$ Million) by Country, 2024 to 2034

Figure 36: North America Market Value (US$ Million) Analysis by Country, 2019 to 2034

Figure 37: North America Market Volume (Units) Analysis by Country, 2019 to 2034

Figure 38: North America Market Value Share (%) and BPS Analysis by Country, 2024 to 2034

Figure 39: North America Market Y-o-Y Growth (%) Projections by Country, 2024 to 2034

Figure 40: North America Market Value (US$ Million) Analysis by Type, 2019 to 2034

Figure 41: North America Market Volume (Units) Analysis by Type, 2019 to 2034

Figure 42: North America Market Value Share (%) and BPS Analysis by Type, 2024 to 2034

Figure 43: North America Market Y-o-Y Growth (%) Projections by Type, 2024 to 2034

Figure 44: North America Market Value (US$ Million) Analysis by Sub-System, 2019 to 2034

Figure 45: North America Market Volume (Units) Analysis by Sub-System, 2019 to 2034

Figure 46: North America Market Value Share (%) and BPS Analysis by Sub-System, 2024 to 2034

Figure 47: North America Market Y-o-Y Growth (%) Projections by Sub-System, 2024 to 2034

Figure 48: North America Market Value (US$ Million) Analysis by Aircraft Type, 2019 to 2034

Figure 49: North America Market Volume (Units) Analysis by Aircraft Type, 2019 to 2034

Figure 50: North America Market Value Share (%) and BPS Analysis by Aircraft Type, 2024 to 2034

Figure 51: North America Market Y-o-Y Growth (%) Projections by Aircraft Type, 2024 to 2034

Figure 52: North America Market Value (US$ Million) Analysis by End-User, 2019 to 2034

Figure 53: North America Market Volume (Units) Analysis by End-User, 2019 to 2034

Figure 54: North America Market Value Share (%) and BPS Analysis by End-User, 2024 to 2034

Figure 55: North America Market Y-o-Y Growth (%) Projections by End-User, 2024 to 2034

Figure 56: North America Market Attractiveness by Type, 2024 to 2034

Figure 57: North America Market Attractiveness by Sub-System, 2024 to 2034

Figure 58: North America Market Attractiveness by Aircraft Type, 2024 to 2034

Figure 59: North America Market Attractiveness by End-User, 2024 to 2034

Figure 60: North America Market Attractiveness by Country, 2024 to 2034

Figure 61: Latin America Market Value (US$ Million) by Type, 2024 to 2034

Figure 62: Latin America Market Value (US$ Million) by Sub-System, 2024 to 2034

Figure 63: Latin America Market Value (US$ Million) by Aircraft Type, 2024 to 2034

Figure 64: Latin America Market Value (US$ Million) by End-User, 2024 to 2034

Figure 65: Latin America Market Value (US$ Million) by Country, 2024 to 2034

Figure 66: Latin America Market Value (US$ Million) Analysis by Country, 2019 to 2034

Figure 67: Latin America Market Volume (Units) Analysis by Country, 2019 to 2034

Figure 68: Latin America Market Value Share (%) and BPS Analysis by Country, 2024 to 2034

Figure 69: Latin America Market Y-o-Y Growth (%) Projections by Country, 2024 to 2034

Figure 70: Latin America Market Value (US$ Million) Analysis by Type, 2019 to 2034

Figure 71: Latin America Market Volume (Units) Analysis by Type, 2019 to 2034

Figure 72: Latin America Market Value Share (%) and BPS Analysis by Type, 2024 to 2034

Figure 73: Latin America Market Y-o-Y Growth (%) Projections by Type, 2024 to 2034

Figure 74: Latin America Market Value (US$ Million) Analysis by Sub-System, 2019 to 2034

Figure 75: Latin America Market Volume (Units) Analysis by Sub-System, 2019 to 2034

Figure 76: Latin America Market Value Share (%) and BPS Analysis by Sub-System, 2024 to 2034

Figure 77: Latin America Market Y-o-Y Growth (%) Projections by Sub-System, 2024 to 2034

Figure 78: Latin America Market Value (US$ Million) Analysis by Aircraft Type, 2019 to 2034

Figure 79: Latin America Market Volume (Units) Analysis by Aircraft Type, 2019 to 2034

Figure 80: Latin America Market Value Share (%) and BPS Analysis by Aircraft Type, 2024 to 2034

Figure 81: Latin America Market Y-o-Y Growth (%) Projections by Aircraft Type, 2024 to 2034

Figure 82: Latin America Market Value (US$ Million) Analysis by End-User, 2019 to 2034

Figure 83: Latin America Market Volume (Units) Analysis by End-User, 2019 to 2034

Figure 84: Latin America Market Value Share (%) and BPS Analysis by End-User, 2024 to 2034

Figure 85: Latin America Market Y-o-Y Growth (%) Projections by End-User, 2024 to 2034

Figure 86: Latin America Market Attractiveness by Type, 2024 to 2034

Figure 87: Latin America Market Attractiveness by Sub-System, 2024 to 2034

Figure 88: Latin America Market Attractiveness by Aircraft Type, 2024 to 2034

Figure 89: Latin America Market Attractiveness by End-User, 2024 to 2034

Figure 90: Latin America Market Attractiveness by Country, 2024 to 2034

Figure 91: Western Europe Market Value (US$ Million) by Type, 2024 to 2034

Figure 92: Western Europe Market Value (US$ Million) by Sub-System, 2024 to 2034

Figure 93: Western Europe Market Value (US$ Million) by Aircraft Type, 2024 to 2034

Figure 94: Western Europe Market Value (US$ Million) by End-User, 2024 to 2034

Figure 95: Western Europe Market Value (US$ Million) by Country, 2024 to 2034

Figure 96: Western Europe Market Value (US$ Million) Analysis by Country, 2019 to 2034

Figure 97: Western Europe Market Volume (Units) Analysis by Country, 2019 to 2034

Figure 98: Western Europe Market Value Share (%) and BPS Analysis by Country, 2024 to 2034

Figure 99: Western Europe Market Y-o-Y Growth (%) Projections by Country, 2024 to 2034

Figure 100: Western Europe Market Value (US$ Million) Analysis by Type, 2019 to 2034

Figure 101: Western Europe Market Volume (Units) Analysis by Type, 2019 to 2034

Figure 102: Western Europe Market Value Share (%) and BPS Analysis by Type, 2024 to 2034

Figure 103: Western Europe Market Y-o-Y Growth (%) Projections by Type, 2024 to 2034

Figure 104: Western Europe Market Value (US$ Million) Analysis by Sub-System, 2019 to 2034

Figure 105: Western Europe Market Volume (Units) Analysis by Sub-System, 2019 to 2034

Figure 106: Western Europe Market Value Share (%) and BPS Analysis by Sub-System, 2024 to 2034

Figure 107: Western Europe Market Y-o-Y Growth (%) Projections by Sub-System, 2024 to 2034

Figure 108: Western Europe Market Value (US$ Million) Analysis by Aircraft Type, 2019 to 2034

Figure 109: Western Europe Market Volume (Units) Analysis by Aircraft Type, 2019 to 2034

Figure 110: Western Europe Market Value Share (%) and BPS Analysis by Aircraft Type, 2024 to 2034

Figure 111: Western Europe Market Y-o-Y Growth (%) Projections by Aircraft Type, 2024 to 2034

Figure 112: Western Europe Market Value (US$ Million) Analysis by End-User, 2019 to 2034

Figure 113: Western Europe Market Volume (Units) Analysis by End-User, 2019 to 2034

Figure 114: Western Europe Market Value Share (%) and BPS Analysis by End-User, 2024 to 2034

Figure 115: Western Europe Market Y-o-Y Growth (%) Projections by End-User, 2024 to 2034

Figure 116: Western Europe Market Attractiveness by Type, 2024 to 2034

Figure 117: Western Europe Market Attractiveness by Sub-System, 2024 to 2034

Figure 118: Western Europe Market Attractiveness by Aircraft Type, 2024 to 2034

Figure 119: Western Europe Market Attractiveness by End-User, 2024 to 2034

Figure 120: Western Europe Market Attractiveness by Country, 2024 to 2034

Figure 121: Eastern Europe Market Value (US$ Million) by Type, 2024 to 2034

Figure 122: Eastern Europe Market Value (US$ Million) by Sub-System, 2024 to 2034

Figure 123: Eastern Europe Market Value (US$ Million) by Aircraft Type, 2024 to 2034

Figure 124: Eastern Europe Market Value (US$ Million) by End-User, 2024 to 2034

Figure 125: Eastern Europe Market Value (US$ Million) by Country, 2024 to 2034

Figure 126: Eastern Europe Market Value (US$ Million) Analysis by Country, 2019 to 2034

Figure 127: Eastern Europe Market Volume (Units) Analysis by Country, 2019 to 2034

Figure 128: Eastern Europe Market Value Share (%) and BPS Analysis by Country, 2024 to 2034

Figure 129: Eastern Europe Market Y-o-Y Growth (%) Projections by Country, 2024 to 2034

Figure 130: Eastern Europe Market Value (US$ Million) Analysis by Type, 2019 to 2034

Figure 131: Eastern Europe Market Volume (Units) Analysis by Type, 2019 to 2034

Figure 132: Eastern Europe Market Value Share (%) and BPS Analysis by Type, 2024 to 2034

Figure 133: Eastern Europe Market Y-o-Y Growth (%) Projections by Type, 2024 to 2034

Figure 134: Eastern Europe Market Value (US$ Million) Analysis by Sub-System, 2019 to 2034

Figure 135: Eastern Europe Market Volume (Units) Analysis by Sub-System, 2019 to 2034

Figure 136: Eastern Europe Market Value Share (%) and BPS Analysis by Sub-System, 2024 to 2034

Figure 137: Eastern Europe Market Y-o-Y Growth (%) Projections by Sub-System, 2024 to 2034

Figure 138: Eastern Europe Market Value (US$ Million) Analysis by Aircraft Type, 2019 to 2034

Figure 139: Eastern Europe Market Volume (Units) Analysis by Aircraft Type, 2019 to 2034

Figure 140: Eastern Europe Market Value Share (%) and BPS Analysis by Aircraft Type, 2024 to 2034

Figure 141: Eastern Europe Market Y-o-Y Growth (%) Projections by Aircraft Type, 2024 to 2034

Figure 142: Eastern Europe Market Value (US$ Million) Analysis by End-User, 2019 to 2034

Figure 143: Eastern Europe Market Volume (Units) Analysis by End-User, 2019 to 2034

Figure 144: Eastern Europe Market Value Share (%) and BPS Analysis by End-User, 2024 to 2034

Figure 145: Eastern Europe Market Y-o-Y Growth (%) Projections by End-User, 2024 to 2034

Figure 146: Eastern Europe Market Attractiveness by Type, 2024 to 2034

Figure 147: Eastern Europe Market Attractiveness by Sub-System, 2024 to 2034

Figure 148: Eastern Europe Market Attractiveness by Aircraft Type, 2024 to 2034

Figure 149: Eastern Europe Market Attractiveness by End-User, 2024 to 2034

Figure 150: Eastern Europe Market Attractiveness by Country, 2024 to 2034

Figure 151: South Asia and Pacific Market Value (US$ Million) by Type, 2024 to 2034

Figure 152: South Asia and Pacific Market Value (US$ Million) by Sub-System, 2024 to 2034

Figure 153: South Asia and Pacific Market Value (US$ Million) by Aircraft Type, 2024 to 2034

Figure 154: South Asia and Pacific Market Value (US$ Million) by End-User, 2024 to 2034

Figure 155: South Asia and Pacific Market Value (US$ Million) by Country, 2024 to 2034

Figure 156: South Asia and Pacific Market Value (US$ Million) Analysis by Country, 2019 to 2034

Figure 157: South Asia and Pacific Market Volume (Units) Analysis by Country, 2019 to 2034

Figure 158: South Asia and Pacific Market Value Share (%) and BPS Analysis by Country, 2024 to 2034

Figure 159: South Asia and Pacific Market Y-o-Y Growth (%) Projections by Country, 2024 to 2034

Figure 160: South Asia and Pacific Market Value (US$ Million) Analysis by Type, 2019 to 2034

Figure 161: South Asia and Pacific Market Volume (Units) Analysis by Type, 2019 to 2034

Figure 162: South Asia and Pacific Market Value Share (%) and BPS Analysis by Type, 2024 to 2034

Figure 163: South Asia and Pacific Market Y-o-Y Growth (%) Projections by Type, 2024 to 2034

Figure 164: South Asia and Pacific Market Value (US$ Million) Analysis by Sub-System, 2019 to 2034

Figure 165: South Asia and Pacific Market Volume (Units) Analysis by Sub-System, 2019 to 2034

Figure 166: South Asia and Pacific Market Value Share (%) and BPS Analysis by Sub-System, 2024 to 2034

Figure 167: South Asia and Pacific Market Y-o-Y Growth (%) Projections by Sub-System, 2024 to 2034

Figure 168: South Asia and Pacific Market Value (US$ Million) Analysis by Aircraft Type, 2019 to 2034

Figure 169: South Asia and Pacific Market Volume (Units) Analysis by Aircraft Type, 2019 to 2034

Figure 170: South Asia and Pacific Market Value Share (%) and BPS Analysis by Aircraft Type, 2024 to 2034

Figure 171: South Asia and Pacific Market Y-o-Y Growth (%) Projections by Aircraft Type, 2024 to 2034

Figure 172: South Asia and Pacific Market Value (US$ Million) Analysis by End-User, 2019 to 2034

Figure 173: South Asia and Pacific Market Volume (Units) Analysis by End-User, 2019 to 2034

Figure 174: South Asia and Pacific Market Value Share (%) and BPS Analysis by End-User, 2024 to 2034

Figure 175: South Asia and Pacific Market Y-o-Y Growth (%) Projections by End-User, 2024 to 2034

Figure 176: South Asia and Pacific Market Attractiveness by Type, 2024 to 2034

Figure 177: South Asia and Pacific Market Attractiveness by Sub-System, 2024 to 2034

Figure 178: South Asia and Pacific Market Attractiveness by Aircraft Type, 2024 to 2034

Figure 179: South Asia and Pacific Market Attractiveness by End-User, 2024 to 2034

Figure 180: South Asia and Pacific Market Attractiveness by Country, 2024 to 2034

Figure 181: East Asia Market Value (US$ Million) by Type, 2024 to 2034

Figure 182: East Asia Market Value (US$ Million) by Sub-System, 2024 to 2034

Figure 183: East Asia Market Value (US$ Million) by Aircraft Type, 2024 to 2034

Figure 184: East Asia Market Value (US$ Million) by End-User, 2024 to 2034

Figure 185: East Asia Market Value (US$ Million) by Country, 2024 to 2034

Figure 186: East Asia Market Value (US$ Million) Analysis by Country, 2019 to 2034

Figure 187: East Asia Market Volume (Units) Analysis by Country, 2019 to 2034

Figure 188: East Asia Market Value Share (%) and BPS Analysis by Country, 2024 to 2034

Figure 189: East Asia Market Y-o-Y Growth (%) Projections by Country, 2024 to 2034

Figure 190: East Asia Market Value (US$ Million) Analysis by Type, 2019 to 2034

Figure 191: East Asia Market Volume (Units) Analysis by Type, 2019 to 2034

Figure 192: East Asia Market Value Share (%) and BPS Analysis by Type, 2024 to 2034

Figure 193: East Asia Market Y-o-Y Growth (%) Projections by Type, 2024 to 2034

Figure 194: East Asia Market Value (US$ Million) Analysis by Sub-System, 2019 to 2034

Figure 195: East Asia Market Volume (Units) Analysis by Sub-System, 2019 to 2034

Figure 196: East Asia Market Value Share (%) and BPS Analysis by Sub-System, 2024 to 2034

Figure 197: East Asia Market Y-o-Y Growth (%) Projections by Sub-System, 2024 to 2034

Figure 198: East Asia Market Value (US$ Million) Analysis by Aircraft Type, 2019 to 2034

Figure 199: East Asia Market Volume (Units) Analysis by Aircraft Type, 2019 to 2034

Figure 200: East Asia Market Value Share (%) and BPS Analysis by Aircraft Type, 2024 to 2034

Figure 201: East Asia Market Y-o-Y Growth (%) Projections by Aircraft Type, 2024 to 2034

Figure 202: East Asia Market Value (US$ Million) Analysis by End-User, 2019 to 2034

Figure 203: East Asia Market Volume (Units) Analysis by End-User, 2019 to 2034

Figure 204: East Asia Market Value Share (%) and BPS Analysis by End-User, 2024 to 2034

Figure 205: East Asia Market Y-o-Y Growth (%) Projections by End-User, 2024 to 2034

Figure 206: East Asia Market Attractiveness by Type, 2024 to 2034

Figure 207: East Asia Market Attractiveness by Sub-System, 2024 to 2034

Figure 208: East Asia Market Attractiveness by Aircraft Type, 2024 to 2034

Figure 209: East Asia Market Attractiveness by End-User, 2024 to 2034

Figure 210: East Asia Market Attractiveness by Country, 2024 to 2034

Figure 211: Middle East and Africa Market Value (US$ Million) by Type, 2024 to 2034

Figure 212: Middle East and Africa Market Value (US$ Million) by Sub-System, 2024 to 2034

Figure 213: Middle East and Africa Market Value (US$ Million) by Aircraft Type, 2024 to 2034

Figure 214: Middle East and Africa Market Value (US$ Million) by End-User, 2024 to 2034

Figure 215: Middle East and Africa Market Value (US$ Million) by Country, 2024 to 2034

Figure 216: Middle East and Africa Market Value (US$ Million) Analysis by Country, 2019 to 2034

Figure 217: Middle East and Africa Market Volume (Units) Analysis by Country, 2019 to 2034

Figure 218: Middle East and Africa Market Value Share (%) and BPS Analysis by Country, 2024 to 2034

Figure 219: Middle East and Africa Market Y-o-Y Growth (%) Projections by Country, 2024 to 2034

Figure 220: Middle East and Africa Market Value (US$ Million) Analysis by Type, 2019 to 2034

Figure 221: Middle East and Africa Market Volume (Units) Analysis by Type, 2019 to 2034

Figure 222: Middle East and Africa Market Value Share (%) and BPS Analysis by Type, 2024 to 2034

Figure 223: Middle East and Africa Market Y-o-Y Growth (%) Projections by Type, 2024 to 2034

Figure 224: Middle East and Africa Market Value (US$ Million) Analysis by Sub-System, 2019 to 2034

Figure 225: Middle East and Africa Market Volume (Units) Analysis by Sub-System, 2019 to 2034

Figure 226: Middle East and Africa Market Value Share (%) and BPS Analysis by Sub-System, 2024 to 2034

Figure 227: Middle East and Africa Market Y-o-Y Growth (%) Projections by Sub-System, 2024 to 2034

Figure 228: Middle East and Africa Market Value (US$ Million) Analysis by Aircraft Type, 2019 to 2034

Figure 229: Middle East and Africa Market Volume (Units) Analysis by Aircraft Type, 2019 to 2034

Figure 230: Middle East and Africa Market Value Share (%) and BPS Analysis by Aircraft Type, 2024 to 2034

Figure 231: Middle East and Africa Market Y-o-Y Growth (%) Projections by Aircraft Type, 2024 to 2034

Figure 232: Middle East and Africa Market Value (US$ Million) Analysis by End-User, 2019 to 2034

Figure 233: Middle East and Africa Market Volume (Units) Analysis by End-User, 2019 to 2034

Figure 234: Middle East and Africa Market Value Share (%) and BPS Analysis by End-User, 2024 to 2034

Figure 235: Middle East and Africa Market Y-o-Y Growth (%) Projections by End-User, 2024 to 2034

Figure 236: Middle East and Africa Market Attractiveness by Type, 2024 to 2034

Figure 237: Middle East and Africa Market Attractiveness by Sub-System, 2024 to 2034

Figure 238: Middle East and Africa Market Attractiveness by Aircraft Type, 2024 to 2034

Figure 239: Middle East and Africa Market Attractiveness by End-User, 2024 to 2034

Figure 240: Middle East and Africa Market Attractiveness by Country, 2024 to 2034

Recommendations

Automotive

Aircraft Exterior Lighting Market

Published : September 2023

Automotive

Aircraft Cabin Interior Market

Published : June 2023

Explore Automotive Insights

View Reports

Aircraft Landing Gear Market