Aircraft Electrification Market Size, Share, and Forecast Outlook 2025 to 2035

The aircraft electrification market is valued at USD 11.5 billion in 2025 and will advance to USD 46.8 billion by 2035, growing at a CAGR of 15% with a multiplying factor of about 4.1x.
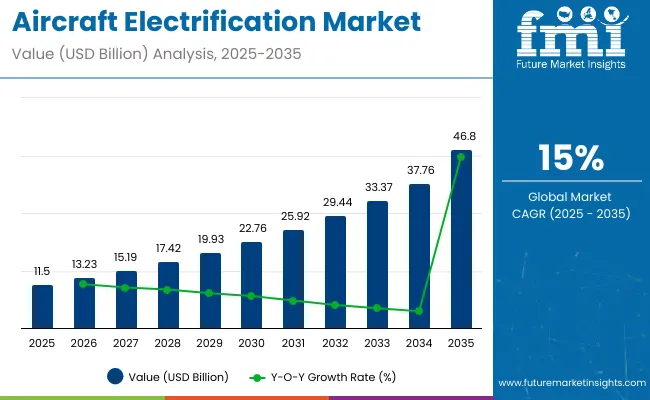
Quick Stats of Aircraft Electrification Market

  • Aircraft Electrification Market Size (2025): USD 11.5 billion
  • Projected Aircraft Electrification Market Size (2035): USD 46.8 billion
  • Forecast CAGR of Aircraft Electrification Market (2025 to 2035): 15%
  • Leading Segment of Aircraft Electrification Market (2025): Batteries (22%)
  • Key Growth Regions of Aircraft Electrification Market: North America, Europe, East Asia
  • Top Key Players of Aircraft Electrification Market: Honeywell International Inc., General Electric, Thales Group, Safran, BAE Systems

Aircraft Electrification Market

Metric Value
Industry Size (2025E) USD 11.5 billion
Industry Value (2035F) USD 46.8 billion
CAGR (2025 to 2035) 15%

Growth momentum analysis highlights how adoption accelerates in phases across the forecast horizon. In the early years, momentum is supported by regulatory pressure to lower emissions, rising fuel costs, and pilot programs from major aircraft manufacturers that integrate electric propulsion and hybrid systems in regional and short-haul aircraft. This stage is marked by strong investment in R&D and collaboration between aerospace firms, battery developers, and system integrators.

Between 2028 and 2032, momentum intensifies as technology breakthroughs in energy density, thermal management, and power electronics enhance operational feasibility. Commercialization of hybrid-electric aircraft and electrification of auxiliary systems drive steady adoption across both passenger and cargo fleets. Toward 2033 to 2035, growth momentum peaks as infrastructure for charging and maintenance matures, fleet operators adopt electric aircraft at larger scale, and new entrants push competition. This acceleration underscores the role of continuous innovation, cost optimization, and regulatory support in shaping market dynamics. Growth momentum across these phases illustrates a shift from experimental adoption to mainstream integration, reinforcing electrification as a transformative force in aviation.

Electrification programs are moving from prototypes to pre-production with measurable gains. High-voltage architectures (540-800 V) now feature in ~60% of active demonstrators, while next-gen SiC/GaN power stages deliver >98% inverter efficiency. Aviation-grade battery packs have advanced to 250-300 Wh/kg at system level in flight-test configurations, extending endurance by 15-25% versus prior iterations. Motor specific power in prototypes has reached 10-15 kW/kg, enabling megawatt-class propulsion for regional and eVTOL concepts. Hybrid-electric test hours expanded by 20% year-on-year in 2024-2025, and fleet simulations show 8-12% block-fuel reduction on short sectors using parallel-hybrid assist. Airports piloting MW-class charging report turnaround times under 30 minutes for eSTOL/eVTOL operations, supporting early commercial use cases.

The aircraft electrification market is underpinned by five primary parent sectors with differentiated influence. Aircraft OEMs and eVTOL developers account for approximately 33%, as platform design choices determine electrical architectures and demand for electric subsystems. Power electronics and distribution (inverters, converters, HVDC systems) contribute about 26%, enabling efficient energy flow and protection at high voltages. Batteries and energy storage represent roughly 21%, covering cells, battery management systems, and thermal control. Electric propulsion (high-specific-power motors and generators) holds near 12%, driving thrust and taxi functions. MRO, certification, and ground infrastructure comprise the remaining 8%, supporting compliance, upgrades, and charging logistics.

Top Aircraft Electrification Market Dynamics

Rising fuel costs, stricter emission regulations, and the aviation industry’s commitment to carbon reduction are fueling adoption of electric propulsion technologies. Asia Pacific leads the adoption curve with a growing focus on regional electric aircraft programs, while North America and Europe are advancing through investments in hybrid-electric and fully electric systems. Key applications include electric propulsion, power distribution, and auxiliary systems. Airlines and manufacturers are collaborating with technology providers to integrate advanced batteries, fuel cells, and power electronics into future fleets to enhance efficiency, reduce emissions, and optimize operational performance.

Driving Force Fuel Efficiency and Emission Reduction

Fuel efficiency and emission reduction are primary drivers in the aircraft electrification market. Aviation fuel accounts for nearly 25 to 30% of airline operating costs, making alternatives highly attractive. Electric propulsion systems can cut fuel consumption by up to 15% in hybrid aircraft and completely eliminate it in fully electric platforms. Regulatory pressures in Europe and North America are compelling airlines to adopt greener technologies, while Asia Pacific is leading in electric commuter aircraft projects. In my view, the demand for sustainable aviation will accelerate adoption of electrified systems, positioning them as a critical solution for both cost savings and environmental compliance.

  • Aviation fuel represents 25 to 30% of airline operating costs
  • Hybrid systems can reduce fuel consumption by up to 15%
  • Regulatory policies in Europe and North America accelerate green adoption

Growth Opportunity Regional Commuter Aircraft and Urban Air Mobility

Regional commuter aircraft and urban air mobility represent the strongest growth opportunities for aircraft electrification. By 2035, more than 6,000 electric and hybrid-electric aircraft are expected to enter service, primarily for short-haul flights under 500 km. Urban air mobility vehicles, including air taxis and cargo drones, are gaining traction in North America, Europe, and Asia Pacific. Investments in high-energy density batteries and fast-charging infrastructure will expand market opportunities. From my perspective, regional routes and urban mobility hubs will act as testing grounds for wider electrification in commercial aviation, creating long-term adoption pathways for large passenger and cargo aircraft.

  • Over 6,000 electric and hybrid aircraft projected in service by 2035
  • Short-haul flights under 500 km drive early adoption of electrified platforms
  • Urban air mobility and cargo drones expand demand for electric systems

Emerging Trend Integration of Advanced Batteries and Power Electronics

The integration of advanced batteries, fuel cells, and high-efficiency power electronics is reshaping aircraft electrification. Lithium-sulfur and solid-state batteries are expected to deliver energy densities 2 to 3 times higher than conventional lithium-ion, enabling longer flight ranges. Electric power distribution units and high-voltage converters are being developed to manage aircraft systems efficiently. Hybrid architectures combining fuel cells with batteries are also under research to extend endurance. In my opinion, the ability of manufacturers to integrate next-generation energy storage and distribution systems will determine how quickly electrified aircraft can transition from prototypes to mainstream aviation fleets.

  • Lithium-sulfur and solid-state batteries deliver 2 to 3 times higher energy density
  • High-voltage converters and power distribution units improve efficiency
  • Hybrid fuel cell-battery architectures extend flight endurance

Market Challenge High Costs and Energy Storage Limitations

High upfront costs and limitations in energy storage technology remain critical challenges for the aircraft electrification market. Development of electric propulsion systems, high-capacity batteries, and power electronics requires significant investment, raising the overall cost of aircraft production. Current battery technologies offer limited flight range compared to traditional aviation fuel, restricting adoption in long-haul segments. Infrastructure for charging and maintenance is underdeveloped in many regions, slowing deployment. In my opinion, unless battery energy density improves and costs decline, electrification will remain limited to regional and short-haul markets, delaying broader adoption in large commercial aircraft.

  • Development costs increase overall aircraft production expenses
  • Current batteries limit range, restricting use in long-haul aviation
  • Lack of charging and maintenance infrastructure slows deployment

Analyzing Aircraft Electrification Market by Top Investment Segments

The aircraft electrification market is expanding as OEMs, Tier 1 suppliers, and airlines invest in energy-efficient systems to reduce reliance on traditional propulsion. Components such as batteries, power electronics, and motors represent core areas of development. Applications are concentrated in power generation and distribution, while energy storage gains importance with rising hybrid programs. More electric configurations dominate, though hybrid and fully electric platforms continue to gain attention. Market players focus on balancing weight, power density, and system integration for both commercial and defense aviation projects.
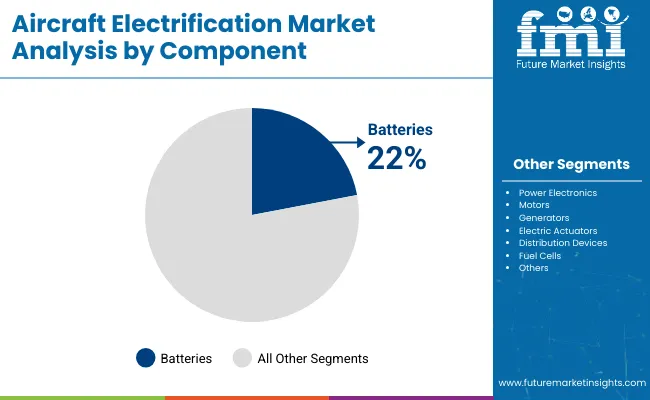
Batteries Lead Aircraft Electrification Market by Component in 2025

Aircraft Electrification Market By Component

Batteries hold 22% share, making them the leading component in electrified aircraft systems. High-density lithium-ion and next-generation solid-state chemistries are increasingly adopted to support hybrid and fully electric platforms. Aircraft programs prioritize lightweight battery packs with enhanced safety and thermal management features. Outsourcing partnerships focus on testing cycle durability and optimizing charging efficiency for aviation requirements. As energy demands rise across propulsion and auxiliary systems, OEMs integrate modular battery packs to achieve redundancy and reliability. Continuous research in high-power storage ensures steady growth of this segment across commercial and regional fleets.
  • Aircraft OEMs expand partnerships with cell manufacturers for aviation-grade packs
  • Solid-state battery R&D targets higher density and improved safety margins
  • Modular battery systems support redundancy in hybrid and electric aircraft

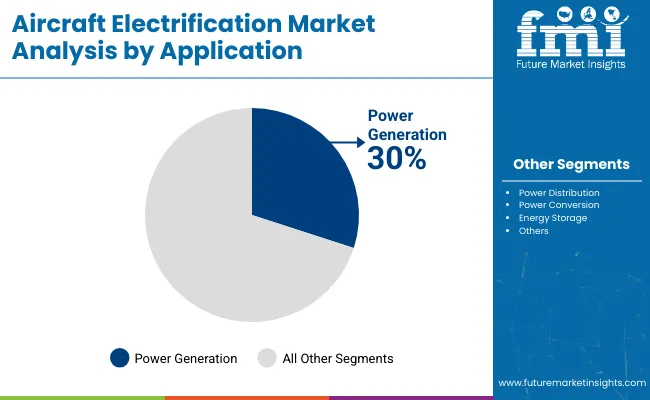
Power Generation Leads Aircraft Electrification Market by Application in 2025

Aircraft Electrification Market By Application

Power generation accounts for 30% share, the largest among applications in aircraft electrification. The segment includes electric generators that convert mechanical to electrical energy for avionics, actuation, and propulsion support. Hybrid-electric aircraft programs require high-output generators to balance engine load and distribute power efficiently. Industrial players are investing in lightweight, high-speed generator designs to improve efficiency. Military aviation also drives demand for enhanced onboard generation capacity, supporting advanced radar and sensor payloads. Ongoing adoption of more electric aircraft architectures reinforces generator system integration across fleets worldwide.
  • Advanced generator systems improve efficiency in hybrid-electric propulsion platforms
  • Military programs adopt higher capacity generators to support mission electronics
  • Lightweight designs reduce system weight while maintaining high power density

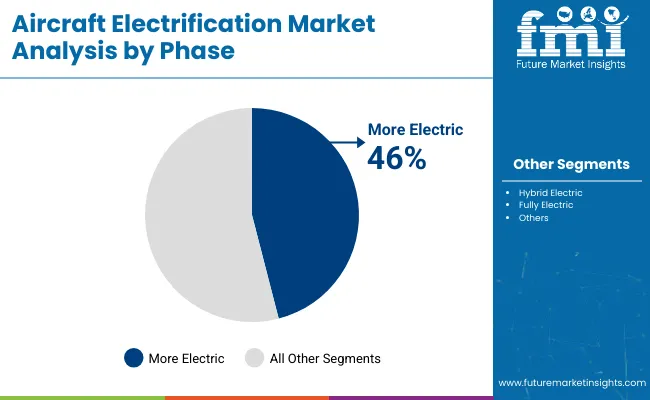
More Electric Segment Dominates Aircraft Electrification Market by Phase in 2025

Aircraft Electrification Market By Phase

More electric configurations represent 46% share, leading the market by phase adoption. This approach replaces hydraulic and pneumatic subsystems with electric alternatives to improve efficiency and reduce maintenance costs. Aircraft models such as the Boeing 787 and Airbus A350 already integrate more electric architectures, driving continued outsourcing of system development. The focus lies on electric actuation, power conversion, and high-voltage distribution technologies. OEMs are gradually extending these architectures across new-generation regional and narrow-body aircraft. This segment serves as a bridge toward hybrid and fully electric designs, making it the largest and most established approach today.
  • Replacement of hydraulic subsystems with electric actuation lowers operational costs
  • More electric systems reduce maintenance complexity in commercial wide-body fleets
  • Segment growth benefits from adoption in both regional and narrow-body aircraft

Top Countries Innovating, Expanding, and Adopting in the Aircraft Electrification Market

Aircraft Electrification Market By Country

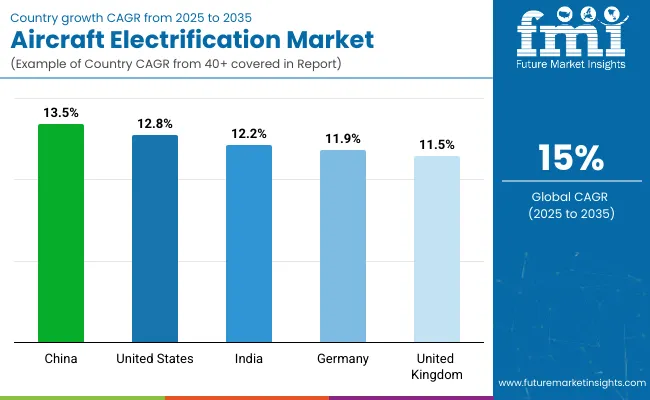
China is positioned at a CAGR of 13.5% from 2025 to 2035, which is −10% below the global benchmark of 15%. Growth in the country is tied to BRICS-led aircraft modernization programs, expanding domestic fleets, and government-backed initiatives in electric propulsion. The United States follows with 12.8%, −15% under the global rate, shaped by OECD-supported advances in hybrid-electric aviation, aerospace R&D, and integration of next-generation battery systems. India records 12.2%, −19% compared to the global CAGR, with expansion supported by fleet electrification programs and rising regional air traffic. Germany stands at 11.9%, −21% under the global average, reflecting strong aerospace manufacturing capabilities but slower adoption timelines due to regulatory alignment and infrastructure readiness. The United Kingdom posts 11.5%, −23% below the global benchmark, with activity centered on research partnerships and incremental technological integration. BRICS economies highlight scaling adoption, while OECD markets prioritize precision engineering, safety standards, and phased implementation.

Aircraft Electrification Market Outlook in China

The aircraft electrification market in China is forecast to expand at a CAGR of 13.5%, supported by state-backed aviation programs and domestic manufacturing capacity. The growth rate is driven by government funding for COMAC’s hybrid-electric aircraft, combined with strong demand for short-haul aviation in densely populated corridors. Local supply chain strength in batteries and power electronics accelerates development. Integration of electric taxiing at major hubs such as Shanghai Pudong cuts fuel costs and reduces emissions, further justifying investments. These factors together explain why China’s CAGR remains higher than other regions, as policy direction and manufacturing scale align with commercial demand.

  • COMAC advances in hybrid-electric prototypes with regional testing underway
  • Electric taxiing systems reduce ground fuel usage by nearly 7%
  • Domestic supply chain boosts availability of power electronics and batteries

Aircraft Electrification Market Growth in the United States

The United States market is projected to grow at a CAGR of 12.8%, reflecting strong innovation pipelines and public-private collaborations. Growth is driven by NASA and FAA initiatives promoting sustainable aviation, as well as Boeing and Honeywell’s focus on regional electric propulsion systems. Federal grants and ARPA-E funding ensure steady progress in lightweight motor design and thermal management, which lowers development barriers. Airport readiness programs, including charging installations at hubs like Dallas-Fort Worth, reinforce adoption potential. This CAGR is supported by large-scale R&D funding, mature aerospace infrastructure, and regulatory push, which collectively strengthen market expansion prospects.

  • Boeing and Honeywell lead research in electric propulsion for regional jets
  • ARPA-E funding supports lightweight motors and advanced thermal systems
  • Charging infrastructure pilot projects expand at large USA airports

Aircraft Electrification Market Trends in Germany

The demand of aircraft electrification in Germany is expected to register a CAGR of 11.9%, driven by Airbus-led innovation and federal research funding exceeding €300 million. The comparatively steady growth rate is influenced by Germany’s focus on gradual integration of hybrid and hydrogen-electric systems rather than rapid commercialization. Munich and Hamburg aerospace clusters nurture startups specializing in solid-state batteries, while airport electrification projects reduce fuel dependence. The strong automotive-electronics base supports engineering expertise, but cautious certification frameworks temper growth. Germany’s CAGR reflects the balance between ambitious innovation funding and regulatory conservatism, resulting in structured yet consistent expansion.

  • Airbus programs accelerate hybrid and hydrogen-electric testing in Germany
  • €300 million in federal funding allocated for electrification projects
  • Ground handling electrification reduces fuel dependence at major airports

Aircraft Electrification Market Prospects in the United Kingdom

The United Kingdom market is projected to grow at a CAGR of 11.5%, largely shaped by Rolls-Royce and BAE Systems projects in hybrid propulsion. The pace is influenced by funding programs from the Aerospace Technology Institute worth £250 million, which prioritize long-term R&D over immediate commercialization. Airports like Bristol and Glasgow test electric ground handling, showing operational readiness, yet regulatory caution slows deployment speed compared with China or the USA The CAGR reflects steady growth, where funding and innovation pipelines exist, but timelines for large-scale adoption extend further due to safety and certification procedures.

  • Rolls-Royce invests heavily in electric propulsion and hybrid drive systems
  • £250 million ATI funding supports aircraft electrification research projects
  • Regional airports deploy electric ground support units to reduce emissions

Aircraft Electrification Market Expansion in India

The aircraft electrification market in India is forecast to grow at a CAGR of 12.2%, supported by strong policy backing and regional aviation demand. The UDAN scheme encourages hybrid-electric adoption for short-haul connectivity, especially in under-served airports. HAL and DRDO’s R&D in electric UAVs and light aircraft provides local technological capability. The CAGR is explained by India’s expanding domestic battery production and collaborations with global energy firms, which enhance supply chain readiness. Rapid aviation growth, combined with government incentives, ensures a higher-than-average pace of electrification deployment, even though infrastructure is still in early development.
  • HAL and DRDO test electric propulsion for UAVs and light aircraft
  • UDAN scheme supports hybrid-electric deployment on short-haul routes
  • Major airports adopt charging and taxiing systems for electrification readiness

Leading Aircraft Electrification Manufacturers, Suppliers, Distributors

Aircraft Electrification Market By Company

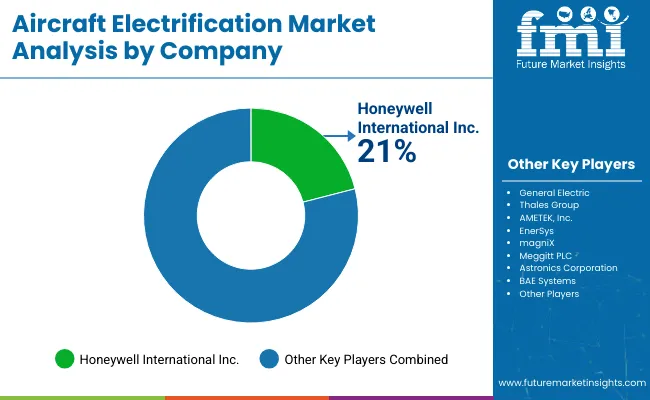
Competition in the aircraft electrification market is being defined by product innovation, system integration, and specialized solutions tailored for commercial and defense aircraft. Strong positioning is being reinforced through portfolios that include power electronics, energy storage units, electric propulsion, and high-efficiency distribution equipment. Strategies are built around differentiation, collaborations with manufacturers, and extensive validation of electric and hybrid-electric systems. Emphasis is placed on lightweight design, higher energy density, and performance reliability to meet operational requirements. AMETEK and Astronics are advancing in power conversion and distribution, while EnerSys and EaglePicher Technologies are strengthening rechargeable battery offerings with enhanced safety margins.

Electric propulsion is being delivered by magniX, with General Electric and Safran driving system-level integration. Thales Group and Honeywell are expanding avionics-focused electrification solutions with integrated control systems. Crane Aerospace & Electronics and BAE Systems are concentrating on actuation, power management, and advanced converters. Auxiliary systems are being provided by Radiant Power Corporation and PBS Aerospace to complement broader architectures. Product brochures highlight compact form, modular layouts, reduced weight, improved efficiency, and compliance with aviation standards. Extended service life, thermal performance, and adaptability with existing fleets are presented as key differentiators. Collective strategy across these companies is directed toward enhancing aircraft power capabilities while lowering reliance on traditional fuel-based systems, moving electrification closer to widespread adoption in aerospace.

Leading Players

  • Honeywell International Inc.
  • General Electric
  • Thales Group
  • AMETEK, Inc.
  • EnerSys
  • magniX
  • Meggitt PLC
  • Astronics Corporation
  • BAE Systems
  • Crane Aerospace & Electronics
  • EaglePicher Technologies LLC
  • PBS Aerospace
  • Radiant Power Corporation
  • Raytheon Technologies
  • Safran
  • Lee Air, Inc.

Report Scope

Report Attributes Details
Market Size (2025) USD 11.5 billion
Projected Market Size (2035) USD 46.8 billion
CAGR (2025 to 2035) 15%
Base Year for Estimation 2024
Historical Period 2020 to 2024
Projection Period 2025 to 2035
Quantitative Units USD billion for value
Component Segments Batteries, Fuel Cells, Electric Actuators, Generators, Motors, Power Electronics, Distribution Devices, Others
Application Segments Power Generation, Power Distribution, Power Conversion, Energy Storage
Phase Segments More Electric, Hybrid Electric, Fully Electric
Regions Covered North America, Latin America, Europe, South Asia, East Asia, Oceania, Middle East and Africa (MEA)
Countries Covered United States, Canada, Brazil, Mexico, Germany, United Kingdom, France, Italy, China, Japan, India, Australia, Saudi Arabia, United Arab Emirates, South Africa
Leading Players Honeywell International Inc., General Electric, Thales Group, AMETEK Inc., EnerSys, magniX, Meggitt PLC, Astronics Corporation, BAE Systems, Crane Aerospace & Electronics, EaglePicher Technologies, PBS Aerospace, Radiant Power Corporation, Raytheon Technologies, Safran, Lee Air Inc.
Additional Attributes Dollar sales by component and aircraft type, demand dynamics across commercial, defense, and regional aircraft, regional adoption trends, innovation in hybrid and fully electric propulsion, environmental impact of reduced emissions and fuel use, and emerging use in urban air mobility and next-generation electric aircraft.

Aircraft Electrification Market Analyzed by Key Investment Segments 

By Component:

  • Batteries
  • Fuel Cells
  • Electric Actuators
  • Generators
  • Motors
  • Power Electronics
  • Distribution Devices
  • Others

By Application:

  • Power Generation
  • Power Distribution
  • Power Conversion
  • Energy Storage

By Phase:

  • More Electric
  • Hybrid Electric
  • Fully Electric

By Region:

  • North America
  • Latin America
  • Europe
  • South Asia
  • East Asia
  • Oceania
  • Middle East and Africa (MEA)

Table of Content

  1. Executive Summary
    • Global Market Outlook
    • Demand-side Trends
    • Supply-side Trends
    • Technology Roadmap Analysis
    • Analysis and Recommendations
  2. Market Overview
    • Market Coverage / Taxonomy
    • Market Definition / Scope / Limitations
  3. Market Background
    • Market Dynamics
      • Drivers
      • Restraints
      • Opportunity
      • Trends
    • Scenario Forecast
      • Demand in Optimistic Scenario
      • Demand in Likely Scenario
      • Demand in Conservative Scenario
    • Opportunity Map Analysis
    • Product Life Cycle Analysis
    • Supply Chain Analysis
      • Supply Side Participants and their Roles
        • Producers
        • Mid-Level Participants (Traders/ Agents/ Brokers)
        • Wholesalers and Distributors
      • Value Added and Value Created at Node in the Supply Chain
      • List of Raw Material Suppliers
      • List of Existing and Potential Buyer’s
    • Investment Feasibility Matrix
    • Value Chain Analysis
      • Profit Margin Analysis
      • Wholesalers and Distributors
      • Retailers
    • PESTLE and Porter’s Analysis
    • Regulatory Landscape
      • By Key Regions
      • By Key Countries
    • Regional Parent Market Outlook
    • Production and Consumption Statistics
    • Import and Export Statistics
  4. Global Market Analysis 2020 to 2024 and Forecast, 2025 to 2035
    • Historical Market Size Value (USD Billion) & Volume (Thousand Units) Analysis, 2020 to 2024
    • Current and Future Market Size Value (USD Billion) & Volume (Thousand Units) Projections, 2025 to 2035
      • Y-o-Y Growth Trend Analysis
      • Absolute $ Opportunity Analysis
  5. Global Market Pricing Analysis 2020 to 2024 and Forecast 2025 to 2035
  6. Global Market Analysis 2020 to 2024 and Forecast 2025 to 2035, By Component
    • Introduction / Key Findings
    • Historical Market Size Value (USD Billion) & Volume (Thousand Units) Analysis By Component, 2020 to 2024
    • Current and Future Market Size Value (USD Billion) & Volume (Thousand Units) Analysis and Forecast By Component, 2025 to 2035
      • Batteries
      • Power Electronics
      • Motors
      • Generators
      • Electric Actuators
      • Distribution Devices
      • Fuel Cells
      • Others
    • Y-o-Y Growth Trend Analysis By Component, 2020 to 2024
    • Absolute $ Opportunity Analysis By Component, 2025 to 2035
  7. Global Market Analysis 2020 to 2024 and Forecast 2025 to 2035, By Application
    • Introduction / Key Findings
    • Historical Market Size Value (USD Billion) & Volume (Thousand Units) Analysis By Application, 2020 to 2024
    • Current and Future Market Size Value (USD Billion) & Volume (Thousand Units) Analysis and Forecast By Application, 2025 to 2035
      • Power Generation
      • Power Distribution
      • Power Conversion
      • Energy Storage
    • Y-o-Y Growth Trend Analysis By Application, 2020 to 2024
    • Absolute $ Opportunity Analysis By Application, 2025 to 2035
  8. Global Market Analysis 2020 to 2024 and Forecast 2025 to 2035, By Phase
    • Introduction / Key Findings
    • Historical Market Size Value (USD Billion) & Volume (Thousand Units) Analysis By Phase, 2020 to 2024
    • Current and Future Market Size Value (USD Billion) & Volume (Thousand Units) Analysis and Forecast By Phase, 2025 to 2035
      • More Electric
      • Hybrid Electric
      • Fully Electric
    • Y-o-Y Growth Trend Analysis By Phase, 2020 to 2024
    • Absolute $ Opportunity Analysis By Phase, 2025 to 2035
  9. Global Market Analysis 2020 to 2024 and Forecast 2025 to 2035, By Region
    • Introduction
    • Historical Market Size Value (USD Billion) & Volume (Thousand Units) Analysis By Region, 2020 to 2024
    • Current Market Size Value (USD Billion) & Volume (Thousand Units) Analysis and Forecast By Region, 2025 to 2035
      • North America
      • Latin America
      • Western Europe
      • Eastern Europe
      • East Asia
      • South Asia & Pacific
      • Middle East and Africa
    • Market Attractiveness Analysis By Region
  10. North America Market Analysis 2020 to 2024 and Forecast 2025 to 2035, By Country
    • Historical Market Size Value (USD Billion) & Volume (Thousand Units) Trend Analysis By Market Taxonomy, 2020 to 2024
    • Market Size Value (USD Billion) & Volume (Thousand Units) Forecast By Market Taxonomy, 2025 to 2035
      • By Country
        • USA
        • Canada
        • Mexico
      • By Component
      • By Application
      • By Phase
    • Market Attractiveness Analysis
      • By Country
      • By Component
      • By Application
      • By Phase
    • Key Takeaways
  11. Latin America Market Analysis 2020 to 2024 and Forecast 2025 to 2035, By Country
    • Historical Market Size Value (USD Billion) & Volume (Thousand Units) Trend Analysis By Market Taxonomy, 2020 to 2024
    • Market Size Value (USD Billion) & Volume (Thousand Units) Forecast By Market Taxonomy, 2025 to 2035
      • By Country
        • Brazil
        • Argentina
        • Rest of LATAM
      • By Component
      • By Application
      • By Phase
    • Market Attractiveness Analysis
      • By Country
      • By Component
      • By Application
      • By Phase
    • Key Takeaways
  12. Western Europe Market Analysis 2020 to 2024 and Forecast 2025 to 2035, By Country
    • Historical Market Size Value (USD Billion) & Volume (Thousand Units) Trend Analysis By Market Taxonomy, 2020 to 2024
    • Market Size Value (USD Billion) & Volume (Thousand Units) Forecast By Market Taxonomy, 2025 to 2035
      • By Country
        • Germany
        • Italy
        • France
        • UK
        • Spain
        • BENELUX
        • Nordic
        • Rest of W.Europe
      • By Component
      • By Application
      • By Phase
    • Market Attractiveness Analysis
      • By Country
      • By Component
      • By Application
      • By Phase
    • Key Takeaways
  13. Eastern Europe Market Analysis 2020 to 2024 and Forecast 2025 to 2035, By Country
    • Historical Market Size Value (USD Billion) & Volume (Thousand Units) Trend Analysis By Market Taxonomy, 2020 to 2024
    • Market Size Value (USD Billion) & Volume (Thousand Units) Forecast By Market Taxonomy, 2025 to 2035
      • By Country
        • Russia
        • Hungary
        • Poland
        • Balkan & Baltics
        • Rest of E. Europe
      • By Component
      • By Application
      • By Phase
    • Market Attractiveness Analysis
      • By Country
      • By Component
      • By Application
      • By Phase
    • Key Takeaways
  14. East Asia Market Analysis 2020 to 2024 and Forecast 2025 to 2035, By Country
    • Historical Market Size Value (USD Billion) & Volume (Thousand Units) Trend Analysis By Market Taxonomy, 2020 to 2024
    • Market Size Value (USD Billion) & Volume (Thousand Units) Forecast By Market Taxonomy, 2025 to 2035
      • By Country
        • China
        • Japan
        • South Korea
      • By Component
      • By Application
      • By Phase
    • Market Attractiveness Analysis
      • By Country
      • By Component
      • By Application
      • By Phase
    • Key Takeaways
  15. South Asia & Pacific Market Analysis 2020 to 2024 and Forecast 2025 to 2035, By Country
    • Historical Market Size Value (USD Billion) & Volume (Thousand Units) Trend Analysis By Market Taxonomy, 2020 to 2024
    • Market Size Value (USD Billion) & Volume (Thousand Units) Forecast By Market Taxonomy, 2025 to 2035
      • By Country
        • India
        • Australia & New Zealand
        • ASEAN
        • Rest of SAP
      • By Component
      • By Application
      • By Phase
    • Market Attractiveness Analysis
      • By Country
      • By Component
      • By Application
      • By Phase
    • Key Takeaways
  16. Middle East and Africa Market Analysis 2020 to 2024 and Forecast 2025 to 2035, By Country
    • Historical Market Size Value (USD Billion) & Volume (Thousand Units) Trend Analysis By Market Taxonomy, 2020 to 2024
    • Market Size Value (USD Billion) & Volume (Thousand Units) Forecast By Market Taxonomy, 2025 to 2035
      • By Country
        • GCC Countries
        • Northern Africa
        • South Africa
        • Turkiye
        • Rest of MEA
      • By Component
      • By Application
      • By Phase
    • Market Attractiveness Analysis
      • By Country
      • By Component
      • By Application
      • By Phase
    • Key Takeaways
  17. Key Countries Market Analysis
    • USA
      • Pricing Analysis
      • Market Share Analysis, 2024
        • By Component
        • By Application
        • By Phase
    • Canada
      • Pricing Analysis
      • Market Share Analysis, 2024
        • By Component
        • By Application
        • By Phase
    • Brazil
      • Pricing Analysis
      • Market Share Analysis, 2024
        • By Component
        • By Application
        • By Phase
    • Mexico
      • Pricing Analysis
      • Market Share Analysis, 2024
        • By Component
        • By Application
        • By Phase
    • Argentina
      • Pricing Analysis
      • Market Share Analysis, 2024
        • By Component
        • By Application
        • By Phase
  18. Market Structure Analysis
    • Competition Dashboard
    • Competition Benchmarking
    • Market Share Analysis of Top Players
      • By Regional
      • By Component
      • By Application
      • By Phase
  19. Competition Analysis
    • Competition Deep Dive
      • Honeywell International Inc.
        • Overview
        • Product Portfolio
        • Profitability by Market Segments (Product/Age /Sales Channel/Region)
        • Sales Footprint
        • Strategy Overview
          • Marketing Strategy
          • Product Strategy
          • Channel Strategy
      • General Electric
        • Overview
        • Product Portfolio
        • Profitability by Market Segments (Product/Age /Sales Channel/Region)
        • Sales Footprint
        • Strategy Overview
          • Marketing Strategy
          • Product Strategy
          • Channel Strategy
      • Thales Group
        • Overview
        • Product Portfolio
        • Profitability by Market Segments (Product/Age /Sales Channel/Region)
        • Sales Footprint
        • Strategy Overview
          • Marketing Strategy
          • Product Strategy
          • Channel Strategy
      • AMETEK, Inc.
        • Overview
        • Product Portfolio
        • Profitability by Market Segments (Product/Age /Sales Channel/Region)
        • Sales Footprint
        • Strategy Overview
          • Marketing Strategy
          • Product Strategy
          • Channel Strategy
      • EnerSys
        • Overview
        • Product Portfolio
        • Profitability by Market Segments (Product/Age /Sales Channel/Region)
        • Sales Footprint
        • Strategy Overview
          • Marketing Strategy
          • Product Strategy
          • Channel Strategy
      • magniX
        • Overview
        • Product Portfolio
        • Profitability by Market Segments (Product/Age /Sales Channel/Region)
        • Sales Footprint
        • Strategy Overview
          • Marketing Strategy
          • Product Strategy
          • Channel Strategy
      • Meggitt PLC
        • Overview
        • Product Portfolio
        • Profitability by Market Segments (Product/Age /Sales Channel/Region)
        • Sales Footprint
        • Strategy Overview
          • Marketing Strategy
          • Product Strategy
          • Channel Strategy
      • Astronics Corporation
        • Overview
        • Product Portfolio
        • Profitability by Market Segments (Product/Age /Sales Channel/Region)
        • Sales Footprint
        • Strategy Overview
          • Marketing Strategy
          • Product Strategy
          • Channel Strategy
      • BAE Systems
        • Overview
        • Product Portfolio
        • Profitability by Market Segments (Product/Age /Sales Channel/Region)
        • Sales Footprint
        • Strategy Overview
          • Marketing Strategy
          • Product Strategy
          • Channel Strategy
      • Crane Aerospace & Electronics
        • Overview
        • Product Portfolio
        • Profitability by Market Segments (Product/Age /Sales Channel/Region)
        • Sales Footprint
        • Strategy Overview
          • Marketing Strategy
          • Product Strategy
          • Channel Strategy
      • EaglePicher Technologies LLC
        • Overview
        • Product Portfolio
        • Profitability by Market Segments (Product/Age /Sales Channel/Region)
        • Sales Footprint
        • Strategy Overview
          • Marketing Strategy
          • Product Strategy
          • Channel Strategy
      • PBS Aerospace
        • Overview
        • Product Portfolio
        • Profitability by Market Segments (Product/Age /Sales Channel/Region)
        • Sales Footprint
        • Strategy Overview
          • Marketing Strategy
          • Product Strategy
          • Channel Strategy
      • Radiant Power Corporation
        • Overview
        • Product Portfolio
        • Profitability by Market Segments (Product/Age /Sales Channel/Region)
        • Sales Footprint
        • Strategy Overview
          • Marketing Strategy
          • Product Strategy
          • Channel Strategy
      • Raytheon Technologies
        • Overview
        • Product Portfolio
        • Profitability by Market Segments (Product/Age /Sales Channel/Region)
        • Sales Footprint
        • Strategy Overview
          • Marketing Strategy
          • Product Strategy
          • Channel Strategy
      • Safran
        • Overview
        • Product Portfolio
        • Profitability by Market Segments (Product/Age /Sales Channel/Region)
        • Sales Footprint
        • Strategy Overview
          • Marketing Strategy
          • Product Strategy
          • Channel Strategy
      • Lee Air, Inc.
        • Overview
        • Product Portfolio
        • Profitability by Market Segments (Product/Age /Sales Channel/Region)
        • Sales Footprint
        • Strategy Overview
          • Marketing Strategy
          • Product Strategy
          • Channel Strategy
  20. Assumptions & Acronyms Used
  21. Research Methodology

List of Tables

  • Table 1: Global Market Value (USD Billion) Forecast by Region, 2020-2035
  • Table 2: Global Market Volume (Thousand Units) Forecast by Region, 2020-2035
  • Table 3: Global Market Value (USD Billion) Forecast by Component, 2020-2035
  • Table 4: Global Market Volume (Thousand Units) Forecast by Component, 2020-2035
  • Table 5: Global Market Value (USD Billion) Forecast by Application, 2020-2035
  • Table 6: Global Market Volume (Thousand Units) Forecast by Application, 2020-2035
  • Table 7: Global Market Value (USD Billion) Forecast by Phase, 2020-2035
  • Table 8: Global Market Volume (Thousand Units) Forecast by Phase, 2020-2035
  • Table 9: North America Market Value (USD Billion) Forecast by Country, 2020-2035
  • Table 10: North America Market Volume (Thousand Units) Forecast by Country, 2020-2035
  • Table 11: North America Market Value (USD Billion) Forecast by Component, 2020-2035
  • Table 12: North America Market Volume (Thousand Units) Forecast by Component, 2020-2035
  • Table 13: North America Market Value (USD Billion) Forecast by Application, 2020-2035
  • Table 14: North America Market Volume (Thousand Units) Forecast by Application, 2020-2035
  • Table 15: North America Market Value (USD Billion) Forecast by Phase, 2020-2035
  • Table 16: North America Market Volume (Thousand Units) Forecast by Phase, 2020-2035
  • Table 17: Latin America Market Value (USD Billion) Forecast by Country, 2020-2035
  • Table 18: Latin America Market Volume (Thousand Units) Forecast by Country, 2020-2035
  • Table 19: Latin America Market Value (USD Billion) Forecast by Component, 2020-2035
  • Table 20: Latin America Market Volume (Thousand Units) Forecast by Component, 2020-2035
  • Table 21: Latin America Market Value (USD Billion) Forecast by Application, 2020-2035
  • Table 22: Latin America Market Volume (Thousand Units) Forecast by Application, 2020-2035
  • Table 23: Latin America Market Value (USD Billion) Forecast by Phase, 2020-2035
  • Table 24: Latin America Market Volume (Thousand Units) Forecast by Phase, 2020-2035
  • Table 25: Western Europe Market Value (USD Billion) Forecast by Country, 2020-2035
  • Table 26: Western Europe Market Volume (Thousand Units) Forecast by Country, 2020-2035
  • Table 27: Western Europe Market Value (USD Billion) Forecast by Component, 2020-2035
  • Table 28: Western Europe Market Volume (Thousand Units) Forecast by Component, 2020-2035
  • Table 29: Western Europe Market Value (USD Billion) Forecast by Application, 2020-2035
  • Table 30: Western Europe Market Volume (Thousand Units) Forecast by Application, 2020-2035
  • Table 31: Western Europe Market Value (USD Billion) Forecast by Phase, 2020-2035
  • Table 32: Western Europe Market Volume (Thousand Units) Forecast by Phase, 2020-2035
  • Table 33: Eastern Europe Market Value (USD Billion) Forecast by Country, 2020-2035
  • Table 34: Eastern Europe Market Volume (Thousand Units) Forecast by Country, 2020-2035
  • Table 35: Eastern Europe Market Value (USD Billion) Forecast by Component, 2020-2035
  • Table 36: Eastern Europe Market Volume (Thousand Units) Forecast by Component, 2020-2035
  • Table 37: Eastern Europe Market Value (USD Billion) Forecast by Application, 2020-2035
  • Table 38: Eastern Europe Market Volume (Thousand Units) Forecast by Application, 2020-2035
  • Table 39: Eastern Europe Market Value (USD Billion) Forecast by Phase, 2020-2035
  • Table 40: Eastern Europe Market Volume (Thousand Units) Forecast by Phase, 2020-2035
  • Table 41: East Asia Market Value (USD Billion) Forecast by Country, 2020-2035
  • Table 42: East Asia Market Volume (Thousand Units) Forecast by Country, 2020-2035
  • Table 43: East Asia Market Value (USD Billion) Forecast by Component, 2020-2035
  • Table 44: East Asia Market Volume (Thousand Units) Forecast by Component, 2020-2035
  • Table 45: East Asia Market Value (USD Billion) Forecast by Application, 2020-2035
  • Table 46: East Asia Market Volume (Thousand Units) Forecast by Application, 2020-2035
  • Table 47: East Asia Market Value (USD Billion) Forecast by Phase, 2020-2035
  • Table 48: East Asia Market Volume (Thousand Units) Forecast by Phase, 2020-2035
  • Table 49: South Asia & Pacific Market Value (USD Billion) Forecast by Country, 2020-2035
  • Table 50: South Asia & Pacific Market Volume (Thousand Units) Forecast by Country, 2020-2035
  • Table 51: South Asia & Pacific Market Value (USD Billion) Forecast by Component, 2020-2035
  • Table 52: South Asia & Pacific Market Volume (Thousand Units) Forecast by Component, 2020-2035
  • Table 53: South Asia & Pacific Market Value (USD Billion) Forecast by Application, 2020-2035
  • Table 54: South Asia & Pacific Market Volume (Thousand Units) Forecast by Application, 2020-2035
  • Table 55: South Asia & Pacific Market Value (USD Billion) Forecast by Phase, 2020-2035
  • Table 56: South Asia & Pacific Market Volume (Thousand Units) Forecast by Phase, 2020-2035
  • Table 57: Middle East and Africa Market Value (USD Billion) Forecast by Country, 2020-2035
  • Table 58: Middle East and Africa Market Volume (Thousand Units) Forecast by Country, 2020-2035
  • Table 59: Middle East and Africa Market Value (USD Billion) Forecast by Component, 2020-2035
  • Table 60: Middle East and Africa Market Volume (Thousand Units) Forecast by Component, 2020-2035
  • Table 61: Middle East and Africa Market Value (USD Billion) Forecast by Application, 2020-2035
  • Table 62: Middle East and Africa Market Volume (Thousand Units) Forecast by Application, 2020-2035
  • Table 63: Middle East and Africa Market Value (USD Billion) Forecast by Phase, 2020-2035
  • Table 64: Middle East and Africa Market Volume (Thousand Units) Forecast by Phase, 2020-2035

List of Figures

  • Figure 1: Global Market Volume (Thousand Units) Forecast 2020-2035
  • Figure 2: Global Market Pricing Analysis
  • Figure 3: Global Market Value (USD Billion) Forecast 2020-2035
  • Figure 4: Global Market Value Share and BPS Analysis by Component, 2025 and 2035
  • Figure 5: Global Market Y-o-Y Growth Comparison by Component, 2025-2035
  • Figure 6: Global Market Attractiveness Analysis by Component
  • Figure 7: Global Market Value Share and BPS Analysis by Application, 2025 and 2035
  • Figure 8: Global Market Y-o-Y Growth Comparison by Application, 2025-2035
  • Figure 9: Global Market Attractiveness Analysis by Application
  • Figure 10: Global Market Value Share and BPS Analysis by Phase, 2025 and 2035
  • Figure 11: Global Market Y-o-Y Growth Comparison by Phase, 2025-2035
  • Figure 12: Global Market Attractiveness Analysis by Phase
  • Figure 13: Global Market Value (USD Billion) Share and BPS Analysis by Region, 2025 and 2035
  • Figure 14: Global Market Y-o-Y Growth Comparison by Region, 2025-2035
  • Figure 15: Global Market Attractiveness Analysis by Region
  • Figure 16: North America Market Incremental $ Opportunity, 2025-2035
  • Figure 17: Latin America Market Incremental $ Opportunity, 2025-2035
  • Figure 18: Western Europe Market Incremental $ Opportunity, 2025-2035
  • Figure 19: Eastern Europe Market Incremental $ Opportunity, 2025-2035
  • Figure 20: East Asia Market Incremental $ Opportunity, 2025-2035
  • Figure 21: South Asia & Pacific Market Incremental $ Opportunity, 2025-2035
  • Figure 22: Middle East and Africa Market Incremental $ Opportunity, 2025-2035
  • Figure 23: North America Market Value Share and BPS Analysis by Country, 2025 and 2035
  • Figure 24: North America Market Value Share and BPS Analysis by Component, 2025 and 2035
  • Figure 25: North America Market Y-o-Y Growth Comparison by Component, 2025-2035
  • Figure 26: North America Market Attractiveness Analysis by Component
  • Figure 27: North America Market Value Share and BPS Analysis by Application, 2025 and 2035
  • Figure 28: North America Market Y-o-Y Growth Comparison by Application, 2025-2035
  • Figure 29: North America Market Attractiveness Analysis by Application
  • Figure 30: North America Market Value Share and BPS Analysis by Phase, 2025 and 2035
  • Figure 31: North America Market Y-o-Y Growth Comparison by Phase, 2025-2035
  • Figure 32: North America Market Attractiveness Analysis by Phase
  • Figure 33: Latin America Market Value Share and BPS Analysis by Country, 2025 and 2035
  • Figure 34: Latin America Market Value Share and BPS Analysis by Component, 2025 and 2035
  • Figure 35: Latin America Market Y-o-Y Growth Comparison by Component, 2025-2035
  • Figure 36: Latin America Market Attractiveness Analysis by Component
  • Figure 37: Latin America Market Value Share and BPS Analysis by Application, 2025 and 2035
  • Figure 38: Latin America Market Y-o-Y Growth Comparison by Application, 2025-2035
  • Figure 39: Latin America Market Attractiveness Analysis by Application
  • Figure 40: Latin America Market Value Share and BPS Analysis by Phase, 2025 and 2035
  • Figure 41: Latin America Market Y-o-Y Growth Comparison by Phase, 2025-2035
  • Figure 42: Latin America Market Attractiveness Analysis by Phase
  • Figure 43: Western Europe Market Value Share and BPS Analysis by Country, 2025 and 2035
  • Figure 44: Western Europe Market Value Share and BPS Analysis by Component, 2025 and 2035
  • Figure 45: Western Europe Market Y-o-Y Growth Comparison by Component, 2025-2035
  • Figure 46: Western Europe Market Attractiveness Analysis by Component
  • Figure 47: Western Europe Market Value Share and BPS Analysis by Application, 2025 and 2035
  • Figure 48: Western Europe Market Y-o-Y Growth Comparison by Application, 2025-2035
  • Figure 49: Western Europe Market Attractiveness Analysis by Application
  • Figure 50: Western Europe Market Value Share and BPS Analysis by Phase, 2025 and 2035
  • Figure 51: Western Europe Market Y-o-Y Growth Comparison by Phase, 2025-2035
  • Figure 52: Western Europe Market Attractiveness Analysis by Phase
  • Figure 53: Eastern Europe Market Value Share and BPS Analysis by Country, 2025 and 2035
  • Figure 54: Eastern Europe Market Value Share and BPS Analysis by Component, 2025 and 2035
  • Figure 55: Eastern Europe Market Y-o-Y Growth Comparison by Component, 2025-2035
  • Figure 56: Eastern Europe Market Attractiveness Analysis by Component
  • Figure 57: Eastern Europe Market Value Share and BPS Analysis by Application, 2025 and 2035
  • Figure 58: Eastern Europe Market Y-o-Y Growth Comparison by Application, 2025-2035
  • Figure 59: Eastern Europe Market Attractiveness Analysis by Application
  • Figure 60: Eastern Europe Market Value Share and BPS Analysis by Phase, 2025 and 2035
  • Figure 61: Eastern Europe Market Y-o-Y Growth Comparison by Phase, 2025-2035
  • Figure 62: Eastern Europe Market Attractiveness Analysis by Phase
  • Figure 63: East Asia Market Value Share and BPS Analysis by Country, 2025 and 2035
  • Figure 64: East Asia Market Value Share and BPS Analysis by Component, 2025 and 2035
  • Figure 65: East Asia Market Y-o-Y Growth Comparison by Component, 2025-2035
  • Figure 66: East Asia Market Attractiveness Analysis by Component
  • Figure 67: East Asia Market Value Share and BPS Analysis by Application, 2025 and 2035
  • Figure 68: East Asia Market Y-o-Y Growth Comparison by Application, 2025-2035
  • Figure 69: East Asia Market Attractiveness Analysis by Application
  • Figure 70: East Asia Market Value Share and BPS Analysis by Phase, 2025 and 2035
  • Figure 71: East Asia Market Y-o-Y Growth Comparison by Phase, 2025-2035
  • Figure 72: East Asia Market Attractiveness Analysis by Phase
  • Figure 73: South Asia & Pacific Market Value Share and BPS Analysis by Country, 2025 and 2035
  • Figure 74: South Asia & Pacific Market Value Share and BPS Analysis by Component, 2025 and 2035
  • Figure 75: South Asia & Pacific Market Y-o-Y Growth Comparison by Component, 2025-2035
  • Figure 76: South Asia & Pacific Market Attractiveness Analysis by Component
  • Figure 77: South Asia & Pacific Market Value Share and BPS Analysis by Application, 2025 and 2035
  • Figure 78: South Asia & Pacific Market Y-o-Y Growth Comparison by Application, 2025-2035
  • Figure 79: South Asia & Pacific Market Attractiveness Analysis by Application
  • Figure 80: South Asia & Pacific Market Value Share and BPS Analysis by Phase, 2025 and 2035
  • Figure 81: South Asia & Pacific Market Y-o-Y Growth Comparison by Phase, 2025-2035
  • Figure 82: South Asia & Pacific Market Attractiveness Analysis by Phase
  • Figure 83: Middle East and Africa Market Value Share and BPS Analysis by Country, 2025 and 2035
  • Figure 84: Middle East and Africa Market Value Share and BPS Analysis by Component, 2025 and 2035
  • Figure 85: Middle East and Africa Market Y-o-Y Growth Comparison by Component, 2025-2035
  • Figure 86: Middle East and Africa Market Attractiveness Analysis by Component
  • Figure 87: Middle East and Africa Market Value Share and BPS Analysis by Application, 2025 and 2035
  • Figure 88: Middle East and Africa Market Y-o-Y Growth Comparison by Application, 2025-2035
  • Figure 89: Middle East and Africa Market Attractiveness Analysis by Application
  • Figure 90: Middle East and Africa Market Value Share and BPS Analysis by Phase, 2025 and 2035
  • Figure 91: Middle East and Africa Market Y-o-Y Growth Comparison by Phase, 2025-2035
  • Figure 92: Middle East and Africa Market Attractiveness Analysis by Phase
  • Figure 93: Global Market - Tier Structure Analysis
  • Figure 94: Global Market - Company Share Analysis

Frequently Asked Questions

What is the market size of the aircraft electrification market in 2025?

The market size is valued at USD 11.5 billion in 2025.

How much will the aircraft electrification market reach by 2035?

It is projected to reach USD 46.8 billion by 2035.

What is the forecast CAGR for the aircraft electrification market from 2025 to 2035?

The market is expected to grow at a CAGR of 15% during 2025-2035.

Which component holds the largest share in the aircraft electrification market?

Batteries hold the largest share with 22% in 2025.

Who is the leading player in the aircraft electrification market?

Honeywell International Inc. is the leading player with 21% share.

Explore Similar Insights

Future Market Insights

Aircraft Electrification Market

Chat With

MaRIA

Hi There, I am MaRIA, Your Market Research Intelligence Assistant. How may I help you?