

- Market Size (2026)
- USD 260.0 Mn
- Forecast (2036)
- USD 3584.0 Mn
- CAGR (2026 to 2036)
- 30.0%
How big is the Airport Ground Support Autonomy Market in 2026?
USD 260.0 million in 2026 and USD 3,584.0 million by 2036 at a 30.0% CAGR.
Demand for airport ground support autonomy is forecast to record 30.0% CAGR between 2026 and 2036, driving value to increase from USD 260.0 million in 2026 to USD 3,584.0 million by 2036, supported by autonomous towing on approved airport routes. Aurrigo International plc reported in May 2025 that ten autonomous vehicles were operating at sites worldwide. The count shows commercial activity has moved beyond isolated one-site demonstrations into a wider deployment base. Adoption remains tied to the wider aircraft ground support equipment fleet because every autonomous system still depends on a road-ready vehicle platform.
China is expected to remain a key market for autonomous airport ground support operations, supported by continued investment in cargo facilities and the opportunity to incorporate autonomous vehicle routes into new infrastructure designs. Japan is advancing through practical deployments of autonomous towing and airside vehicle technologies at established airports, demonstrating how automation can be integrated within complex operational environments. Across both markets, successful implementation depends on robust procedures for exception handling, including blocked routes and safe intervention when systems encounter operational disruptions. Reliable 5G in aviation can strengthen low-latency communication between fleet control and airside vehicles during active shifts. Commercial returns depend on mission completion across normal shifts rather than a successful demonstration day.
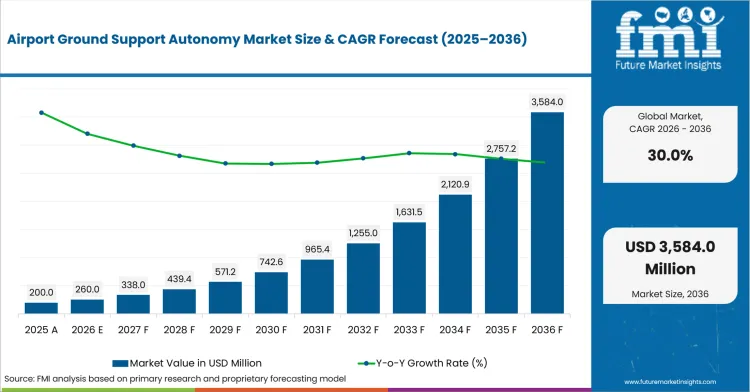
| Metric | Value |
|---|---|
| 2025 Market Size | USD 200.0 million |
| 2026 Market Size | USD 260.0 million |
| 2036 Market Size | USD 3,584.0 million |
| Forecast CAGR (2026-2036) | 30.0% |
| Equipment Focus | Autonomous Baggage Tractors |
| Autonomous Baggage Tractors Share (2026) | 42.0% |
| Application Focus | Baggage Transfer |
| Baggage Transfer Share (2026) | 44.0% |
| Component Focus | Vehicles |
| Vehicles Share (2026) | 56.0% |
Summary of the Airport Ground Support Autonomy Market
| Market Signal | Commercial Impact |
|---|---|
| Demand and Growth Drivers | Fixed airport routes create a practical operating case for autonomous baggage and cargo movement under a repeatable control plan.
|
| Product and Segment View | Vehicle design and mission design must be evaluated together before an airport commits capital to a fleet program.
|
| Geography and Growth Outlook | Country growth reflects airport construction patterns and the local approval path for autonomous ground vehicles.
|
| Competitive Landscape | Competition separates vehicle manufacturing from autonomy software and managed airport operations that keep daily missions available.
|
| Analyst Perspective | Mission completion and exception handling matter more than an autonomy label during airport supplier selection and contract review.
|
Source: FMI's proprietary forecasting model and primary research
How is the airport ground support autonomy market segmented?
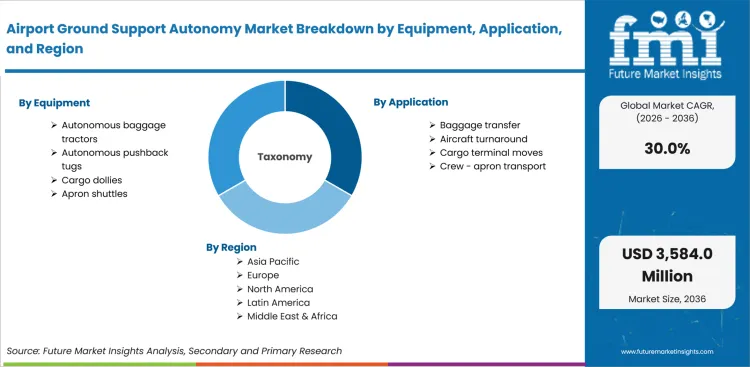
The airport ground support autonomy industry is segmented by equipment, application, component, end use, business model, and region.
The market is segmented by equipment and application so readers can compare each vehicle with its mission. Component analysis separates vehicles from autonomy software and services with different cost and support profiles. End-use analysis identifies the organization that controls airport access and directly accepts daily operating responsibility. Business models compare direct ownership with managed services and leases that distribute integration risk differently. Regional coverage examines approval systems and airport investment cycles that shape commercial deployment at each site. Related airport robots address terminal or passenger tasks entirely outside the defined airside transport scope. Smart baggage handling systems provide an adjacent view of baggage data and sorting before an airside vehicle begins its mission. The segment structure connects route requirements with responsibility for each ground movement and its support model.
How does autonomous baggage tractor demand shape the equipment category?
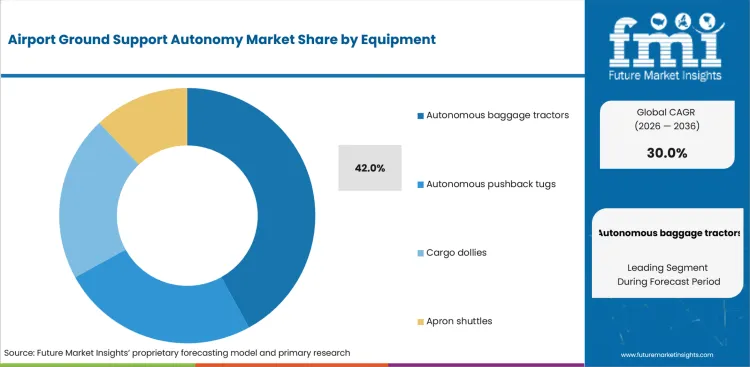
Autonomous baggage tractors fit routes that repeat between baggage facilities and aircraft stands throughout each operating day. UISEE reported in March 2026 that more than 40 autonomous baggage tractors were in regular operation at a new airport terminal area opened during 2025. The deployment shows how fleet size can rise once one mapped corridor becomes part of routine work. Airport towing remains connected to broader conveyor systems because baggage flow depends on coordinated transfer between fixed and mobile equipment.
- In 2026, autonomous baggage tractors are estimated to hold 42.0% share, driven by frequent movements along known service roads. Tractor missions avoid the direct aircraft-contact demands faced by pushback equipment during every operating cycle. Their commercial value comes from replacing repeated driver trips with scheduled fleet tasks that one control room can supervise across several mapped routes.
- Ground handling companies favor autonomous baggage tractors for routes with stable pickup and delivery points during each shift. A mapped towing loop gives engineering teams a clear boundary for route safety validation and repeatable performance testing. The format still requires reliable coupling and obstacle recovery during normal operations with mixed airside traffic. Airport managers therefore compare mission completion and field support records before approving wider fleet use across additional routes.
What supports demand for baggage transfer within the application category?
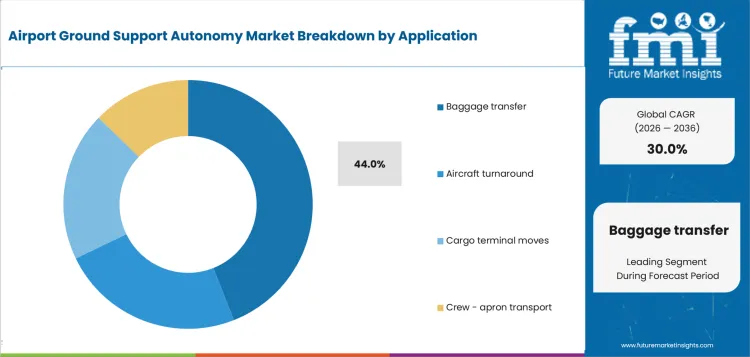
Baggage transfer combines high mission frequency with clear endpoints between sorting areas and aircraft stands. Aurrigo International plc and Swissport launched an autonomous ground handling pilot at Zurich Airport in May 2025. The program placed Auto-DollyTug vehicles inside a live handling environment rather than a closed technology showcase. The application links vehicle dispatch with freight management software because each movement must match a flight and a handling deadline.
- By application, baggage transfer is projected to hold 44.0% share in 2026, supported by repeated collection and delivery tasks across every flight schedule. Delayed inbound baggage can compress the next departure window and raise the cost of any missed vehicle movement. Autonomous dispatch can protect consistency if the vehicle reaches the correct loading point and hands the load to the next process without interruption.
- Airlines and ground handlers favor baggage transfer automation on routes that provide measurable cycle times across operating shifts. The application allows operations teams to compare completed missions with manual output under the same flight schedule. Commercial approval still depends on reliable integration with baggage records and aircraft stand assignments during operations. A vehicle that moves reliably but reaches the wrong endpoint cannot improve turnaround performance or protect the departure window.
How are vehicles positioned within the component category?
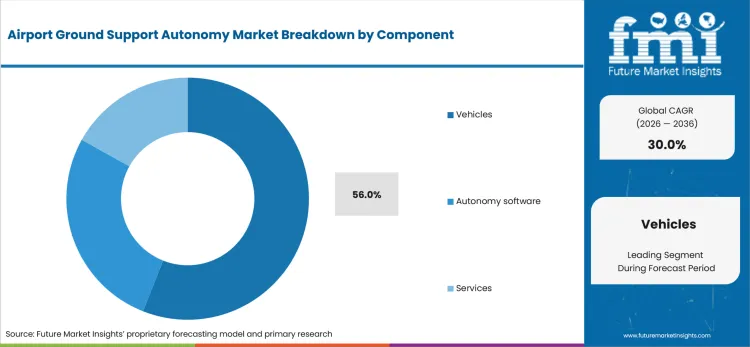
Vehicles carry the steering and braking interfaces that make each autonomous airport mission physically possible. Westwell announced an autonomous driving agreement with Hong Kong International Airport in July 2025 for its electric Q-Tractor. The planned work covers automated baggage and cargo transport inside a major airport cargo hub with demanding traffic conditions. Vehicle value also depends on connected sensors and onboard data that support control-room visibility across every mission. The link with IoT in aviation becomes commercially relevant as fleets report location and system health to a control room.
- Vehicles are forecast to represent 56.0% share in 2026, attributable to the chassis and energy system carried by every operating unit. Sensors and control hardware add further cost before a mission begins and remain tied to each physical asset.
- Airport engineering teams evaluate vehicle durability and aircraft-side clearance before reviewing software features or control-room interfaces. A service road exposes equipment to weather and mixed traffic during long operating shifts throughout each season. Maintenance access therefore affects vehicle availability across the fleet and the number of missions completed each day.
What makes airports and operators central to the end-use category?
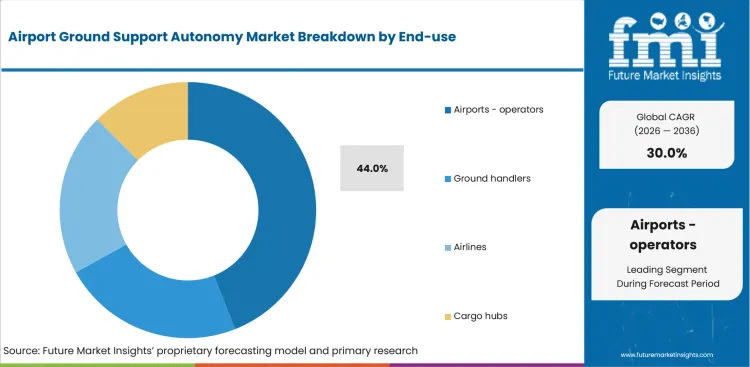
Airport operators control service-road access and stand restrictions even when a ground handler performs the daily mission. Airports Council International Asia-Pacific and Middle East reported in January 2026 that Changi Airport had rolled out autonomous tractors for airside operations. The move shows how an airport can convert an earlier trial into a standing operating program. Internal oversight must align with aviation compliance monitoring software so route permissions and incident records remain visible during routine use.
- Airports or operators are projected to account for 44.0% share in 2026, underpinned by their authority over airside roads and safety procedures. Ground handling companies may own or operate the vehicles under an airport-approved operating plan during routine service.
- Airport authorities favor programs that define responsibility for route approval and emergency response from commercial planning. A single operating plan can reduce disputes between vehicle developers and ground handling companies during testing and routine service. The end-use decision therefore covers governance and operating accountability alongside the physical equipment used for commercial deployment. Weak role definitions can delay deployment even after the vehicle completes technical testing under controlled conditions.
How does direct sale influence purchasing within the business model category?
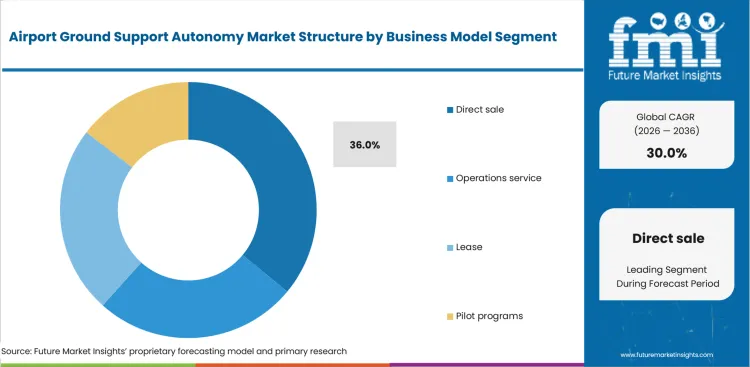
Direct sale gives an airport or handling company long-term control over the vehicle asset and its replacement schedule. EasyMile revealed a serial-ready EZDolly in September 2025 for repeatable airport cargo movement across defined routes. Serial readiness matters because direct ownership depends on consistent specifications and serviceable parts across several units. Airport commercial teams may compare the offer with advanced airport technologies that use subscription or managed service structures for software and operational support.
- Direct sale is projected to account for 36.0% share in 2026, owing to established ground equipment purchasing practices at larger airports. Ownership allows internal engineering teams to control maintenance planning and vehicle availability across the asset life. The model creates more integration work because the airport must coordinate software support and operational procedures with the owned fleet.
- Large airport groups favor direct ownership when they already maintain mixed ground support fleets and technical workshops. Smaller sites may prefer an operations service that places more responsibility with the technology provider throughout daily use. The commercial choice therefore depends on internal engineering capacity and the airport group's preferred level of operating control.
What are the drivers, restraints, and opportunities in the airport ground support autonomy market?
Standardized airport routes support automation adoption, while regulatory approvals and outsourced fleet management shape deployment and scalability.
- Driver: Fixed baggage and cargo corridors support automation economics through repeated mapped movements across each operating shift.
- Restraint: Airport-specific approval extends project schedules through safety reviews and controls for the defined operating area.
- Opportunity: Managed operations contracts give airports one accountable organization for vehicles and remote fleet support.
Repeated cargo missions are a factor supporting growth since they create measurable output across a normal operating day. EasyMile reported in April 2026 that two EZTow vehicles were completing about 120 daily autonomous missions for Lufthansa Cargo in Frankfurt. The operating rate gives airport managers a direct benchmark for fleet availability and route throughput. Commercial value rises once the mission can run through mixed traffic and scheduled gates without repeated manual recovery.
Airport approval duties are a factor limiting growth as every operating area carries local hazards and emergency procedures. The Federal Aviation Administration stated in May 2025 that airport sponsors may approve or reject autonomous ground vehicle demonstrations at federally obligated airports. Sponsors retain financial and operational risk during testing that occurs on airport property and controlled service roads. Vehicle developers therefore need an airport-specific safety case before a successful trial can become recurring service.
Managed cargo operations represent an emerging opportunity because one contract can combine equipment with software and daily support. TractEasy reported in June 2026 that it completed a live autonomous cargo operation with Turkish Cargo at Istanbul Airport. The project placed towing technology inside a working cargo process at a major international hub with active handling schedules. Similar contracts can reduce coordination gaps if one organization accepts responsibility for route updates and field response throughout daily operations.
Which country CAGRs are profiled in the airport ground support autonomy market?
| Country | CAGR |
|---|---|
| China | 33.0% |
| India | 32.0% |
| United States | 31.0% |
| European Union | 29.0% |
| Japan | 27.0% |
Source: FMI's proprietary forecasting model and primary research
How do country-level CAGRs compare in the airport ground support autonomy market?
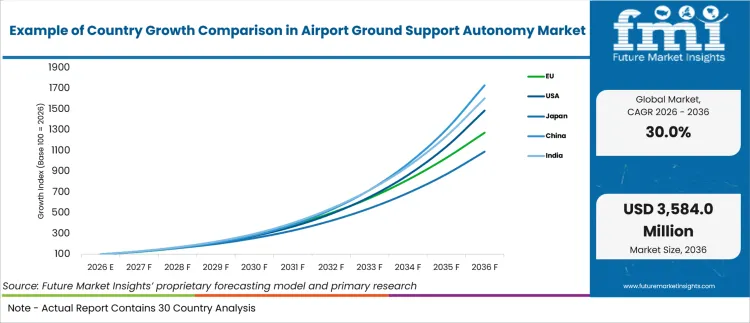
The country comparison spans six percentage points and reflects different levels of route readiness across airport operating environments. China and India form a closely spaced upper group supported by cargo activity and new infrastructure development. The United States follows with comparable momentum across airports that already manage complex ground service operations. The European Union and Japan show more measured expansion as existing airports require additional route approval and operating changes. The European Union figure represents a regional average and therefore conceals differences across individual member states.
- China shows notable momentum as cargo hubs are expected to create recurring towing missions across mapped service roads.
- India remains close to China as new airport projects are anticipated to include autonomous vehicle routes during initial infrastructure planning.
- The United States reflects considerable opportunity across established airports that require autonomous units to operate within mixed ground traffic.
- European Union adoption is expected to depend on route-specific approvals and coordinated safety procedures across separate national aviation systems.
- Japan shows a measured outlook as space constraints and established airport layouts require precise vehicle control across restricted operating areas.
Markets with similar CAGRs are expected to follow different commercial paths based on airport design and approval readiness. Investment decisions will depend on daily mission output and endpoint reliability as well as recurring funds for fleet operation. The full report provides country-level CAGR analysis across North America, Latin America, Europe, East Asia, South Asia, Oceania and the Middle East and Africa.
- China has a direct airport cargo use case because large hubs combine high handling volume with new airside infrastructure. Autonomous ground support demand in China is forecast to rise at 33.0% CAGR over the forecast period, driven by cargo hubs adding mapped routes during expansion. Airport Authority Hong Kong reported cargo throughput of 5.0 million tonnes in July 2025 for the fiscal year ending March 2025. The volume creates repeated tractor missions across defined cargo corridors and supports investment in route automation. Airport Authority Hong Kong must align vehicle paths with cargo terminal handoff points and active apron controls before expanding a fleet. Investment decisions should compare towing throughput with infrastructure changes and local support coverage across each cargo corridor.
- India combines airport expansion with a broad ground-handling network that spans large hubs and smaller operating sites. Ground support autonomy in India is anticipated to advance at 32.0% CAGR through 2036, supported by rising pressure to standardize repetitive ramp work. The Ministry of Civil Aviation reported in March 2025 that AI Airport Services Limited offered ground-handling services at about 150 airports. The footprint shows how one operating organization can influence equipment standards across a wide network of airport locations. Indian airports still differ in road layout and charging readiness across their existing ground support fleets.
- United States adoption is shaped by a broad certified airport base and airport-specific safety systems. The United States is projected to record 31.0% CAGR during the forecast period, underpinned by established FAA certification and emergency-response requirements. The Federal Aviation Administration reported in March 2026 that it certified approximately 520 airports under Part 139. The figure identifies a large regulated airport base but does not create automatic approval for autonomous ground vehicles. Part 139 provides established safety and emergency-response controls that local programs must integrate with route-specific operating plans.
- European Union airports operate under common aviation rules but keep local responsibility for ground handling procedures and airport access. Airport ground support autonomy in the European Union is estimated to expand at 29.0% CAGR by 2036, shaped by a common oversight framework and national implementation. The European Union Aviation Safety Agency reported in November 2025 that its ground handling rules incorporated two EU regulations. The framework covers competent authority oversight and safe service provision across ground handling organizations and airport operators. Autonomous vehicles remain inside the regulatory structure even without onboard drivers performing the daily transport mission. Airport groups need contract terms that divide operating duties between airport operators and ground handling companies throughout deployment. Commercial progress depends on evidence that remains useful across different national authorities and airport procedures.
- Japan provides a practical deployment reference through major airports that are testing fully unmanned towing under defined conditions. Operating evidence has begun to influence airport planning and workforce design across established ground handling programs. Ground support autonomy in Japan is forecast to reach 27.0% CAGR from 2026 to 2036, aided by established airport programs and labor-saving priorities. Japan Airlines reported in February 2026 that practical Level 4 towing began at two Tokyo airports on December 15, 2025. The operating program covers both Haneda Airport and Narita International Airport under defined route conditions. ;
Who are the notable companies in the airport ground support autonomy market?
TractEasy, EasyMile, TLD, Aurrigo International plc, UISEE, and Westwell are notable companies active in airport ground support autonomy.
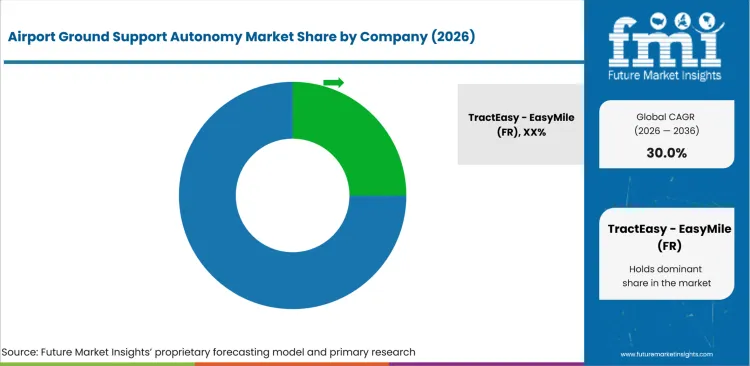
Competition separates physical ground equipment from autonomy software and fleet operations that keep airport missions available. TractEasy combines TLD engineering with EasyMile driving software for mapped towing missions and remote fleet oversight. Aurrigo International plc develops autonomous airside vehicles and simulation tools for baggage or cargo missions at airports. UISEE and Westwell bring operating references from Asian airports that use autonomous tractors for cargo or baggage movement. The comparison differs from broader aviation analytics because vehicle movement requires direct control of braking and route behavior. Airport customers therefore compare endpoint handling and local support coverage alongside each vehicle specification during commercial evaluation. Commercial advantage comes from reducing coordination risk across the complete ground mission and its daily support requirements.
- TractEasy and EasyMile focus on autonomous towing software plus fleet supervision and mission support for mapped airport routes. TLD adds a ground equipment manufacturing base and an established service network for physical assets. The combined offer suits airports that want one technical path from the vehicle platform to fleet supervision across baggage or cargo missions.
- Aurrigo International plc differentiates its offer through Auto-DollyTug and related simulation tools for planned airside movement. The company has worked with airport and ground handling organizations across Europe and Asia on defined baggage programs. Its commercial case depends on integrating robotic load transfer with the timing requirements of baggage and cargo operations.
- UISEE and Westwell bring autonomous tractors and fleet systems into airport cargo settings across China and other Asian markets. Their deployments provide operating evidence that airport groups can examine before considering a larger vehicle program. Airport customers still need local support and safety documentation before transferring a program into another operating environment.
Competitive Benchmarking: Airport Ground Support Autonomy Market
| Company | Airport Vehicle Scope | Autonomy Software | Fleet Operations | Endpoint Handling | Geographic Reach |
|---|---|---|---|---|---|
| TractEasy | High | High | High | Medium | Europe, Asia, and Middle East airport programs |
| EasyMile | Low | High | High | Medium | Europe, Asia, and North America through partners |
| TLD | High | Medium | Medium | Medium | Global ground support equipment network |
| Aurrigo International plc | High | High | Medium | High | Europe, Asia, and North America airport pilots |
| UISEE | High | High | High | Medium | China, Middle East, and selected global airports |
| Westwell | High | High | High | Medium | China and international cargo hub programs |
Scoring basis: A High rating indicates substantial direct capability documented for the stated airport workflow dimension. A Medium rating reflects relevant capability that depends partly on a partner or covers fewer airport tasks. A Low rating reflects limited direct evidence for the named capability within airport ground support autonomy.
Source: Future Market Insights competitive analysis, 2026. Ratings reflect verified portfolio relevance and airport workflow fit.
Key Developments in the Airport Ground Support Autonomy Market
- In April 2025, Aurrigo entered a partnership with Aviation Solutions to commercialize autonomous baggage handling across airports. The agreement connected Aurrigo vehicle technology with operating experience developed through programs at Amsterdam Airport Schiphol. The commercial value lies in giving airport projects a route from local testing to wider deployment support. Airport customers still need site approval and operating integration before regular autonomous service begins across active airside routes.
- In July 2025, EasyMile introduced automated hooking and unhooking for autonomous towing missions at commercial airports. The feature reduces manual work at mission endpoints where a tractor connects with baggage or cargo dollies. Endpoint automation can improve mission continuity because a driverless route still loses value if staff must complete every coupling step. Airports must validate the feature against local equipment interfaces and handling procedures used during normal operating shifts.
- In December 2025, TractEasy announced a partnership with Munich Airport to advance autonomous cargo towing. The partners agreed to define a roadmap focused on operational learning and safety validation for airside cargo routes. Munich Airport gains a named technology partner for assessing driverless towing within its ground-handling environment. Wider deployment depends on consistent route performance and clearly assigned incident response during normal cargo operations.
Key Players in the Airport Ground Support Autonomy Market
Autonomous towing and software integrators
- TractEasy
- EasyMile
Ground support equipment manufacturers
- TLD
Autonomous airside vehicle developers
- Aurrigo International plc
- UISEE
- Westwell
Airport Ground Support Autonomy Market - Report Scope
| Coverage field | Report scope |
|---|---|
| Market breakdown | Equipment, application, component, end use, business model, and region. |
| Quantitative Units | Revenue in USD Million, CAGR in %. |
| Market Definition | Autonomous airside vehicles plus software and services that control baggage, cargo, towing, or apron transport missions with reduced onboard supervision. |
| Regions Covered | North America, Latin America, Europe, East Asia, South Asia, Oceania, and Middle East and Africa. |
| Countries Covered | China, India, the United States, Japan, and the European Union benchmark across 5+ profiled markets. |
| Key Companies Profiled | TractEasy, EasyMile, TLD, Aurrigo International plc, UISEE, and Westwell. |
| Forecast Period | 2026 to 2036. |
| Approach | Hybrid bottom-up and top-down market sizing supported by primary interviews and official desk research. |
Airport Ground Support Autonomy Market - Research Methodology
| Method | Approach |
|---|---|
| Primary Research | FMI analysts gathered input from manufacturers, service providers, technology developers, distributors, end users, procurement teams, and subject-matter experts. Interviews examined purchasing decisions, product or service evaluation, adoption barriers, approval requirements, pricing considerations, and expectations for technical or commercial support. Respondents were also asked what evidence is required before a trial, pilot, or initial order develops into regular purchasing. |
| Desk Research | Desk research covered government statistics, regulatory publications, trade data, industry associations, technical literature, standards, company filings, product information, and official corporate announcements. Sources were reviewed for relevance, publication date, geographic coverage, and consistency with the defined market scope. Claims relating to performance, applications, approvals, capacity, investment, and commercial activity were retained only when supported by credible public evidence. |
| Market Sizing and Forecasting | The market model combined the baseline value with historical performance, segment structure, pricing and volume indicators, adoption levels, company participation, and country-level demand conditions. Forecast assumptions considered economic activity, investment trends, regulatory developments, technology adoption, purchasing cycles, supply availability, and barriers to wider market use. Segment and regional estimates were reconciled before the final market total was calculated. |
| Data Validation | Estimates were checked against multiple independent indicators, including public data, company activity, trade patterns, industry developments, and findings from primary interviews. Validation also tested whether products, services, applications, and company revenues fell within the defined market boundaries. Adjacent categories, unsupported claims, overlapping revenues, and activities without direct market relevance were excluded to reduce double counting and maintain consistency across segments and countries. |
Source: Future Market Insights (FMI) analysis, based on proprietary forecasting model and primary research
Airport Ground Support Autonomy Market by Segments
Airport Ground Support Autonomy Market segmented by Equipment:
- Autonomous Baggage Tractors
- Autonomous Pushback Tugs
- Cargo Dollies
- Apron Shuttles
Airport Ground Support Autonomy Market segmented by Application:
- Baggage Transfer
- Aircraft Turnaround
- Cargo Terminal Moves
- Crew or Apron Transport
Airport Ground Support Autonomy Market segmented by Component:
- Vehicles
- Autonomy Software
- Services
Airport Ground Support Autonomy Market segmented by End Use:
- Airports or Operators
- Ground Handlers
- Airlines
- Cargo Hubs
Airport Ground Support Autonomy Market segmented by Business Model:
- Direct Sale
- Operations Service
- Lease
- Pilot Programs
Airport Ground Support Autonomy Market by Region:
- North America
- United States
- Canada
- Latin America
- Brazil
- Mexico
- Rest of Latin America
- Europe
- Germany
- France
- United Kingdom
- Italy
- Spain
- Rest of Europe
- East Asia
- China
- Japan
- South Korea
- South Asia
- India
- ASEAN Countries
- Rest of South Asia
- Oceania
- Australia
- New Zealand
- Middle East and Africa
- GCC Countries
- Türkiye
- South Africa
- Rest of Middle East and Africa
Research Sources and Bibliography
- Aurrigo International plc. (2025, May 19). Aurrigo International’s revenues take off with demand for its autonomous vehicles rising.
- UISEE. (2026, March 18). UISEE Signs Strategic Cooperation Agreement with Xinjiang Airport Group.
- Aurrigo International plc. (2025, May 21). SWISSPORT AND AURRIGO LAUNCH FIRST GLOBAL PILOT OF AUTONOMOUS GROUND HANDLING SOLUTIONS AT ZURICH AIRPORT.
- Westwell. (2025, July 22). Westwell Signed Landmark Autonomous Driving Deal with World's Top Cargo Hub Hong Kong International Airport.
- Airports Council International Asia-Pacific and Middle East. (2026, January 20). Changi Airport rolls out autonomous tractors in a major step towards airside automation.
- EasyMile. (2025, September 16). Serial-Ready EZDolly Revealed.
- EasyMile. (2026, April 7). EasyMile powers 120 daily autonomous missions at Lufthansa Cargo Frankfurt.
- Federal Aviation Administration. (2025, May 21). Emerging Entrants Bulletin 25-02, Testing and Demonstrating Autonomous Ground Vehicle Systems (AGVS) at Federally Obligated Airports.
- TractEasy. (2026, June 3). TractEasy Deploys Autonomous Cargo Operations at Istanbul Airport.
- Airport Authority Hong Kong. (2025, July 16). Solid Air Traffic Growth Recorded in 2024/25 as AAHK Delivers Sound Financial Performance.
- Ministry of Civil Aviation, Government of India. (2025, March). Annual Report 2024.
- Federal Aviation Administration. (2026, March 24). Part 139 Airport Certification.
- European Union Aviation Safety Agency. (2025, November 5). Easy Access Rules for Ground Handling (GH) (Regulations (EU) 2025/23 and 2025/20).
- Japan Airlines Co., Ltd. (2026, February 3). Consolidated Financial Results for the Nine Months Ended December 31, 2025 [IFRS].
- Aurrigo International plc. (2025, April 8). Aurrigo and Aviation Solutions join forces to commercialise autonomous baggage handling at airports.
- EasyMile. (2025, July 10). New feature: Automated hooking and unhooking.
- TractEasy. (2025, December 15). TractEasy Announces Partnership with Munich Airport to Advance Autonomous Cargo Towing.
- UISEE. (2026, January 16). Airport Autonomous Driving Q&A: How UISEE’s AI Driver Power 21 Airports from Hong Kong to Urumqi and Singapore.
- TLD. (n.d.). EZTow.
This bibliography is provided for reader reference and uses primary government, standards-body, official trade body, and company sources.
This Report Answers
- What market value is recorded for 2026 and what value is projected for 2036?
- What CAGR connects the 2026 market value with the 2036 forecast?
- Why do autonomous baggage tractors account for 42.0% share in 2026?
- Why does baggage transfer represent 44.0% share in 2026?
- Why do vehicles account for 56.0% share within the component category?
- How do China and India compare with the United States in country CAGR?
- Which airport approval duties can delay autonomous ground vehicle deployment?
- Which companies combine vehicles with autonomy software or fleet operations?
- How do direct sale and managed operations change responsibility for integration?
- What evidence distinguishes recurring airport operations from a bounded pilot?
Frequently Asked Questions
What is driving growth in the Airport Ground Support Autonomy Market?
Repeated baggage and cargo routes create measurable demand for autonomous towing across busy airport operating schedules. Airports gain a clearer investment case once route approval and field support responsibilities are defined.
Who are the key players in the Airport Ground Support Autonomy Market?
TractEasy and EasyMile are profiled alongside TLD and Aurrigo International plc for airport autonomy programs. UISEE and Westwell add autonomous airside vehicles plus software capabilities for baggage and cargo operations.
What is a notable restraint in the Airport Ground Support Autonomy Market?
Airport-specific safety approval can delay recurring passenger-free service beyond a successful technical trial at one site. Each airport must define operating areas and assign responsibility for route exceptions before routine deployment begins.
Why should executives track the Airport Ground Support Autonomy Market?
Autonomous ground vehicles can change labor planning and equipment ownership across baggage and cargo operations. Early contracts may influence fleet standards and software support terms across airport groups evaluating wider deployment.
What business problem does the Airport Ground Support Autonomy Market address?
The market addresses repetitive baggage and cargo movements that depend on scarce airside driving staff. Autonomous fleets can support consistent mission completion across approved routes through centralized supervision and field response.
What should airport managers evaluate in the Airport Ground Support Autonomy Market?
Airport managers should compare mission completion and endpoint handling across routes with similar traffic conditions. Contracts must assign software updates and field response duties throughout the agreed commercial service period.
What limits return on investment in the Airport Ground Support Autonomy Market?
Idle vehicles weaken returns if route approval or systems integration extends beyond the planned commercial schedule. Charging capacity and remote support costs must remain within the operating budget for each approved route.
What supports long-term commercial confidence in the Airport Ground Support Autonomy Market?
Consistent mission output across mixed airport traffic supports confidence in autonomous ground support fleet operations. Documented maintenance and incident procedures give airport groups a practical basis for expanding approved routes.
Preview the report firsthand - request a free sample
Get SampleGet the brochure for pricing and purchase details.
Get PDFTable of Content
- Key Takeaways
- Market Size and CAGR
- Top Growth Driver
- Fastest Growing Segment
- Leading Region
- Key Companies
- Emerging Opportunities
- Executive Summary
- Global Market Outlook
- Demand-side Trends
- Supply-side Trends
- Technology Roadmap Analysis
- Analysis and Recommendations
- Analyst Perspective (What is happening? Why now? What should investors know?)
- Key Questions Answered
- How large is the market?
- What is the CAGR?
- What are key trends?
- Which region dominates?
- Who are the leaders?
- Market Overview
- Market Coverage / Taxonomy
- Market Definition / Scope / Limitations
- Research Methodology
- Chapter Orientation
- Analytical Lens and Working Hypotheses
- Market Structure, Signals, and Trend Drivers
- Benchmarking and Cross-market Comparability
- Market Sizing, Forecasting, and Opportunity Mapping
- Research Design and Evidence Framework
- Desk Research Programme (Secondary Evidence)
- Expert Input and Fieldwork (Primary Evidence)
- Tooling, Models, and Reference Databases
- Data Engineering and Model Build
- Quality Assurance and Audit Trail
- Market Background
- Market Dynamics (Drivers, Restraints, Opportunity, Trends)
- Scenario Forecast (Optimistic, Likely, Conservative)
- Impact Analysis
- AI Impact
- Sustainability Impact
- Regulatory Impact
- Technology Impact
- Consumer / Buyer Analysis
- Purchase Drivers
- Adoption Barriers
- Buyer Journey
- Opportunity Map Analysis
- Product Life Cycle Analysis
- Supply Chain Analysis
- Investment Feasibility Matrix
- Value Chain Analysis
- PESTLE and Porter's Analysis
- Regulatory Landscape
- Regional Parent Market Outlook
- Production and Consumption Statistics
- Import and Export Statistics
- Global Market Analysis and Forecast, 2021 to 2036
- Historical Market Size Value (USD Mn) Analysis, 2021 to 2025
- Current and Future Market Size Value (USD Mn) Projections, 2026 to 2036
- Y-o-Y Growth Trend Analysis
- Absolute $ Opportunity Analysis
- Global Market Pricing Analysis, 2021 to 2036
- Global Market Analysis and Forecast, By Equipment, 2021 to 2036
- Introduction / Key Findings
- Historical Market Size Value (USD Mn) Analysis By Equipment, 2021 to 2025
- Current and Future Market Size Value (USD Mn) Analysis and Forecast By Equipment, 2026 to 2036
- Autonomous baggage tractors
- Autonomous pushback tugs
- Cargo dollies
- Apron shuttles
- Autonomous baggage tractors
- Y-o-Y Growth Trend Analysis By Equipment, 2021 to 2025
- Absolute $ Opportunity Analysis By Equipment, 2026 to 2036
- Global Market Analysis and Forecast, By Application, 2021 to 2036
- Introduction / Key Findings
- Historical Market Size Value (USD Mn) Analysis By Application, 2021 to 2025
- Current and Future Market Size Value (USD Mn) Analysis and Forecast By Application, 2026 to 2036
- Baggage transfer
- Aircraft turnaround
- Cargo terminal moves
- Crew - apron transport
- Baggage transfer
- Y-o-Y Growth Trend Analysis By Application, 2021 to 2025
- Absolute $ Opportunity Analysis By Application, 2026 to 2036
- Global Market Analysis and Forecast, By Component, 2021 to 2036
- Introduction / Key Findings
- Historical Market Size Value (USD Mn) Analysis By Component, 2021 to 2025
- Current and Future Market Size Value (USD Mn) Analysis and Forecast By Component, 2026 to 2036
- Vehicles
- Autonomy software
- Services
- Vehicles
- Y-o-Y Growth Trend Analysis By Component, 2021 to 2025
- Absolute $ Opportunity Analysis By Component, 2026 to 2036
- Global Market Analysis and Forecast, By End-use, 2021 to 2036
- Introduction / Key Findings
- Historical Market Size Value (USD Mn) Analysis By End-use, 2021 to 2025
- Current and Future Market Size Value (USD Mn) Analysis and Forecast By End-use, 2026 to 2036
- Airports - operators
- Ground handlers
- Airlines
- Cargo hubs
- Airports - operators
- Y-o-Y Growth Trend Analysis By End-use, 2021 to 2025
- Absolute $ Opportunity Analysis By End-use, 2026 to 2036
- Global Market Analysis and Forecast, By Business Model, 2021 to 2036
- Introduction / Key Findings
- Historical Market Size Value (USD Mn) Analysis By Business Model, 2021 to 2025
- Current and Future Market Size Value (USD Mn) Analysis and Forecast By Business Model, 2026 to 2036
- Direct sale
- Operations service
- Lease
- Pilot programs
- Direct sale
- Y-o-Y Growth Trend Analysis By Business Model, 2021 to 2025
- Absolute $ Opportunity Analysis By Business Model, 2026 to 2036
- Global Market Analysis and Forecast, By Region, 2021 to 2036
- Introduction
- Historical Market Size Value (USD Mn) Analysis By Region, 2021 to 2025
- Current Market Size Value (USD Mn) Analysis and Forecast By Region, 2026 to 2036
- North America
- Latin America
- Western Europe
- Eastern Europe
- East Asia
- South Asia and Pacific
- Middle East & Africa
- Market Attractiveness Analysis By Region
- North America Market Analysis and Forecast, By Country, 2021 to 2036
- Historical Market Size Value (USD Mn) Trend Analysis By Market Taxonomy, 2021 to 2025
- Market Size Value (USD Mn) Forecast By Market Taxonomy, 2026 to 2036
- By Country
- USA
- Canada
- By Equipment
- By Application
- By Component
- By End-use
- By Business Model
- By Country
- Market Attractiveness Analysis
- By Country
- By Equipment
- By Application
- By Component
- By End-use
- By Business Model
- Key Takeaways
- Latin America Market Analysis and Forecast, By Country
- Historical Market Size Value (USD Mn) Trend Analysis By Market Taxonomy, 2021 to 2025
- Market Size Value (USD Mn) Forecast By Market Taxonomy, 2026 to 2036
- By Country
- Brazil
- Mexico
- Chile
- Rest of Latin America
- By Equipment
- By Application
- By Component
- By End-use
- By Business Model
- By Country
- Market Attractiveness Analysis
- By Country
- By Equipment
- By Application
- By Component
- By End-use
- By Business Model
- Key Takeaways
- Western Europe Market Analysis and Forecast, By Country
- Historical Market Size Value (USD Mn) Trend Analysis By Market Taxonomy, 2021 to 2025
- Market Size Value (USD Mn) Forecast By Market Taxonomy, 2026 to 2036
- By Country
- Germany
- UK
- Italy
- Spain
- France
- Nordic
- BENELUX
- Rest of Western Europe
- By Equipment
- By Application
- By Component
- By End-use
- By Business Model
- By Country
- Market Attractiveness Analysis
- By Country
- By Equipment
- By Application
- By Component
- By End-use
- By Business Model
- Key Takeaways
- Eastern Europe Market Analysis and Forecast, By Country
- Historical Market Size Value (USD Mn) Trend Analysis By Market Taxonomy, 2021 to 2025
- Market Size Value (USD Mn) Forecast By Market Taxonomy, 2026 to 2036
- By Country
- Russia
- Poland
- Hungary
- Balkan & Baltic
- Rest of Eastern Europe
- By Equipment
- By Application
- By Component
- By End-use
- By Business Model
- By Country
- Market Attractiveness Analysis
- By Country
- By Equipment
- By Application
- By Component
- By End-use
- By Business Model
- Key Takeaways
- East Asia Market Analysis and Forecast, By Country
- Historical Market Size Value (USD Mn) Trend Analysis By Market Taxonomy, 2021 to 2025
- Market Size Value (USD Mn) Forecast By Market Taxonomy, 2026 to 2036
- By Country
- China
- Japan
- South Korea
- By Equipment
- By Application
- By Component
- By End-use
- By Business Model
- By Country
- Market Attractiveness Analysis
- By Country
- By Equipment
- By Application
- By Component
- By End-use
- By Business Model
- Key Takeaways
- South Asia and Pacific Market Analysis and Forecast, By Country
- Historical Market Size Value (USD Mn) Trend Analysis By Market Taxonomy, 2021 to 2025
- Market Size Value (USD Mn) Forecast By Market Taxonomy, 2026 to 2036
- By Country
- India
- ASEAN
- Australia & New Zealand
- Rest of South Asia and Pacific
- By Equipment
- By Application
- By Component
- By End-use
- By Business Model
- By Country
- Market Attractiveness Analysis
- By Country
- By Equipment
- By Application
- By Component
- By End-use
- By Business Model
- Key Takeaways
- Middle East & Africa Market Analysis and Forecast, By Country
- Historical Market Size Value (USD Mn) Trend Analysis By Market Taxonomy, 2021 to 2025
- Market Size Value (USD Mn) Forecast By Market Taxonomy, 2026 to 2036
- By Country
- Kingdom of Saudi Arabia
- Other GCC Countries
- Türkiye
- South Africa
- Other African Union
- Rest of Middle East & Africa
- By Equipment
- By Application
- By Component
- By End-use
- By Business Model
- By Country
- Market Attractiveness Analysis
- By Country
- By Equipment
- By Application
- By Component
- By End-use
- By Business Model
- Key Takeaways
- Key Countries Market Analysis
- USA
- Pricing Analysis
- Market Share Analysis, 2025
- By Equipment
- By Application
- By Component
- By End-use
- By Business Model
- Canada
- Pricing Analysis
- Market Share Analysis, 2025
- By Equipment
- By Application
- By Component
- By End-use
- By Business Model
- Mexico
- Pricing Analysis
- Market Share Analysis, 2025
- By Equipment
- By Application
- By Component
- By End-use
- By Business Model
- Brazil
- Pricing Analysis
- Market Share Analysis, 2025
- By Equipment
- By Application
- By Component
- By End-use
- By Business Model
- Chile
- Pricing Analysis
- Market Share Analysis, 2025
- By Equipment
- By Application
- By Component
- By End-use
- By Business Model
- Germany
- Pricing Analysis
- Market Share Analysis, 2025
- By Equipment
- By Application
- By Component
- By End-use
- By Business Model
- UK
- Pricing Analysis
- Market Share Analysis, 2025
- By Equipment
- By Application
- By Component
- By End-use
- By Business Model
- Italy
- Pricing Analysis
- Market Share Analysis, 2025
- By Equipment
- By Application
- By Component
- By End-use
- By Business Model
- Spain
- Pricing Analysis
- Market Share Analysis, 2025
- By Equipment
- By Application
- By Component
- By End-use
- By Business Model
- France
- Pricing Analysis
- Market Share Analysis, 2025
- By Equipment
- By Application
- By Component
- By End-use
- By Business Model
- India
- Pricing Analysis
- Market Share Analysis, 2025
- By Equipment
- By Application
- By Component
- By End-use
- By Business Model
- ASEAN
- Pricing Analysis
- Market Share Analysis, 2025
- By Equipment
- By Application
- By Component
- By End-use
- By Business Model
- Australia & New Zealand
- Pricing Analysis
- Market Share Analysis, 2025
- By Equipment
- By Application
- By Component
- By End-use
- By Business Model
- China
- Pricing Analysis
- Market Share Analysis, 2025
- By Equipment
- By Application
- By Component
- By End-use
- By Business Model
- Japan
- Pricing Analysis
- Market Share Analysis, 2025
- By Equipment
- By Application
- By Component
- By End-use
- By Business Model
- South Korea
- Pricing Analysis
- Market Share Analysis, 2025
- By Equipment
- By Application
- By Component
- By End-use
- By Business Model
- Russia
- Pricing Analysis
- Market Share Analysis, 2025
- By Equipment
- By Application
- By Component
- By End-use
- By Business Model
- Poland
- Pricing Analysis
- Market Share Analysis, 2025
- By Equipment
- By Application
- By Component
- By End-use
- By Business Model
- Hungary
- Pricing Analysis
- Market Share Analysis, 2025
- By Equipment
- By Application
- By Component
- By End-use
- By Business Model
- Kingdom of Saudi Arabia
- Pricing Analysis
- Market Share Analysis, 2025
- By Equipment
- By Application
- By Component
- By End-use
- By Business Model
- Türkiye
- Pricing Analysis
- Market Share Analysis, 2025
- By Equipment
- By Application
- By Component
- By End-use
- By Business Model
- South Africa
- Pricing Analysis
- Market Share Analysis, 2025
- By Equipment
- By Application
- By Component
- By End-use
- By Business Model
- USA
- Market Structure Analysis
- Competition Dashboard
- Competition Benchmarking
- Market Share Analysis of Top Players
- By Regional
- By Equipment
- By Application
- By Component
- By End-use
- By Business Model
- Emerging Startups
- Innovation Benchmarking
- Competition Analysis
- Competition Deep Dive
- TractEasy - EasyMile (FR)
- Overview
- Product Portfolio
- Profitability by Market Segments
- Sales Footprint
- Strategy Overview
- Marketing Strategy
- Product Strategy
- Channel Strategy
- Aurrigo (UK)
- TLD - Alvest (FR)
- TractEasy - EasyMile (FR)
- Case Studies
- Success Stories
- Recent Developments
- Competition Deep Dive
- Assumptions & Acronyms Used


