Alcohol Packaging Market
A Sneak Peek into the Detailed Report on Alcohol Packaging Market – FMI Analysis
Alcohol Packaging Market by Material Type, Type, Alcoholic Beverages & Region - Forecast 2022 – 2032
Alcohol packaging market Outlook (2022-2032)
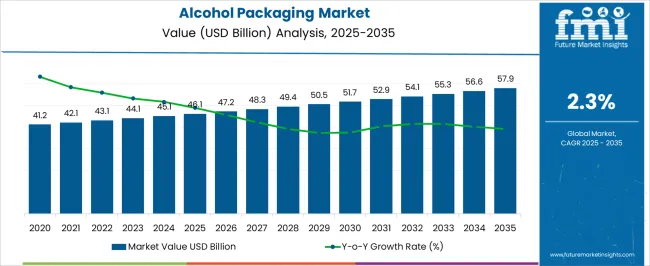
[306 Pages Report] Demand in the global alcohol packaging market is expected to be worth US$ 47,225.2 M in 2022 and is projected to rise at a CAGR of 3.9% and be worth US$ 69,235.6 M from 2022 to 2032. The increasing global demand for and consumption of alcoholic beverages has contributed to the expansion of the alcohol packaging market.
Report Attribute |
Details |
Alcohol packaging market Value (2022) |
US$ 47225.2 Million |
Alcohol packaging market Anticipated Value (2032) |
US$ 69234.6 Million |
Alcoholic Beverages Packaging Projected Growth Rate (2022-2032) |
3.9% |
The major factors impacting the trends of the alcohol packaging market are:
- The increasing demand for metal containers
- Beer production is being ramped up.
- The importance of eco-friendly packaging is becoming increasingly well-known.
- The instability of raw material costs
Let us know your requirement to get
100% FREE customization
Sustainability in Alcohol Packaging
Producers of distilled spirits are increasingly scrutinising their product packaging, looking for ways to improve it while also minimising its environmental impact by including new elements and using eco-friendly materials.
There has been an ongoing effort on the part of distilleries to provide environmentally friendly packaging options, from the bottle and box to the means of shipping. With the help of new technologies, both small and large manufacturers are making significant progress toward greater sustainability.
New developments are appearing all over the industry, from near-field communication tags to recyclable pouches that can contain litres of liquid and paper bottles to improved security systems. The alcohol packaging market is on a path of high growth.
Some sustainable innovations that alcohol packaging market players have adopted are:
- Avallen, a maker of Calvados, aims to become the world's most sustainable spirit by using sustainable packaging such recycled glass bottles and discarded apple pulp labels. The usual weight of a premium spirit bottle is roughly 900g, and Avallen's 540g bottle is significantly lighter than the norm. The wooden cork is undyed and unfinished, and the labels are screen printed with vegetable-based inks for a minimal environmental impact. The box used to transport Avallen is eco-friendly; it's created from recyclable materials and features a simple, one-color pattern. In order to provide Avallen in a plastic-free cardboard sleeve, the company collaborates with a Cornwall-based company called Flexi Hex.
- Spirits from major brands including Diageo, Pernod Ricard, and Bacardi will soon be available in environmentally friendly paper bottles. The first paper alcohol bottle, made by Frugalpac for Silent Pool Distillers' Green Man Woodland Gin, hit store shelves in April 2021. The bottle has a carbon footprint that is six times smaller than that of glass or polyethylene terephthalate plastic bottles, and it's also five times lighter than its glass counterparts. The bottle is completely recyclable thanks to the paperboard layer (made from 94% recycled paper) and the separate pouch (which may also be recycled).
- In terms of environmental responsibility, Pernod Ricard has likewise stepped up its performance. The firm has revealed the 2021 Absolut edition bottle, which is composed of 60% recycled glass and is the most environmentally friendly design for the vodka brand to date, in addition to its planned paper bottle. Beefeater London Dry gin also got a new eco-friendly label from the company.
What’s Next
Alcohol packaging market players are experimenting with different strategies to increase their market share. One of the major strategies is Direct to Customer. A lot of companies are still trying to figure out how to turn a profit from their direct-to-consumer efforts.
In order to test the waters before diving headfirst into direct-to-consumer sales, companies are resorting to launching limited versions of their products. To increase their visibility in more markets, they are trying to partner with similar products. With a short-term commitment aimed at raising brand awareness, they may gauge the ability to develop secure online transactions.
The packaging of alcoholic beverages plays a significant role in the brand promotion of alcohol. The alcoholic beverage industry highlights innovations, including enhanced branding and unconventional packaging formats, such as paper wine bottles, whiskey pouches, etc.
It was observed that the global consumption of alcoholic beverages has been increasing significantly over the decades. According to the study conducted by Lancet, alcohol per-capita consumption increased from 5·9 litres in 1990 to 6·5 litres in 2017 globally. Furthermore, in the following 13 years, alcohol per-capita consumption is expected to grow by 17%, reaching 7·6 litres in 2030. The rising alcoholic beverage consumption is regarded as the key factor driving its packaging market growth.
Rising demand for packaged beverage items for recreational activities is also driving the growth in the alcoholic beverage packaging market value. Attractive packaging formats offered by the packing and manufacturing industry to the beverages industry and growth and expansion of the food and beverages industry will further induce growth in the alcoholic beverage packaging market value.
Rising environmental concerns and stringent regulations pertaining to the use of plastic are some of the factors that are expected to impede the growth of the alcohol packaging market during the forecast period.
Find your sweet spots for generating winning opportunities in this market.
Talk to AnalystWhich are Some Prominent Drivers Spearheading Alcohol Packaging Market Growth?
- Rising Consumption
Rising demand and consumption of alcoholic beverages, growth, and expansion of packaging industry especially in the developing economies, and increased personal disposable income are the major factors that are expected to augment the growth of alcoholic beverage packaging market over the analysis period.
- Popularity of Craft Beers
Rising demand for premium alcoholic beverages including craft beer is prominently expected to accelerate the alcohol packaging market growth. The rising popularity of shim drinks is also said to have a positive impact on market growth over the forecast period.
- New Packaging Solutions
The advent of new and attractive packaging solutions in alcoholic drinks packaging, such as bag-in-box, ceramic glass bottles, bag-in-tube, and whiskey pouches, is also projected to support market growth. Moreover, extensive R&D to introduce biodegradable and sustainable packaging materials due to rising environmental concerns is anticipated to fuel the market development.
- Proliferating Online Business
On the other hand rising proliferation of e-commerce industry especially in the developing economies, rise in the consumer preferences for retail formats, increasing westernization, modernization, urbanization, ever-rising global population, and increasing personal disposable income are some of the indirect factors that are also expected to promote the alcoholic beverage packaging market growth rate. Growing awareness for the brands among consumers may also provide an opportunity for alcoholic beverage packaging market growth in the long run.
What are the Challenges Faced by the Alcoholic Beverages Packaging Industry?
- Environmental Concerns
Stringent government regulations on the use of hazardous and non-biodegradable products have limited the manufacturers to a few packaging materials. Furthermore, the increasing cost of production is also restricting the growth of the said market studied.
- Control on Alcoholic Drinks
Moreover, fluctuations in the cost and availability of raw materials used for packaging is expected to create hindrances for the alcoholic beverage packaging market growth rate. Growing health awareness and awareness regarding the side effects of over-consumption might further dampen the alcoholic beverage packaging market growth rate.

A unified Market Research Subscription Platform, built for today's disparate research needs.
How is North America Region Emerging as an Opportunistic Alcohol Packaging Market?
North America alcohol packaging market is expected to capture a 19% market share in the current year 2022.
Additionally, the alcohol packaging market in North America is expected to witness the highest growth in the future, and it is attributed to increased consumption of premium alcoholic beverages including spirits and wines. For instance, the U.S. has been witnessing a growing demand for vodka.
How is Europe Contributing to Growth of the Alcohol packaging market?
According to Future Market Insights, Europe is anticipated to accrue 16% revenue by 2022-end, owing to the increasing consumption of alcoholic beverages.
Europe has been witnessing high demand for flavoured beer as one of the premium drinks. Additionally, the increased consumption of premium alcoholic beverages such as French Beer and Whiskey is expected to create lucrative opportunities for the market growth over the analysis period.
How Start-ups are making their position in such a highly Competitive Market?
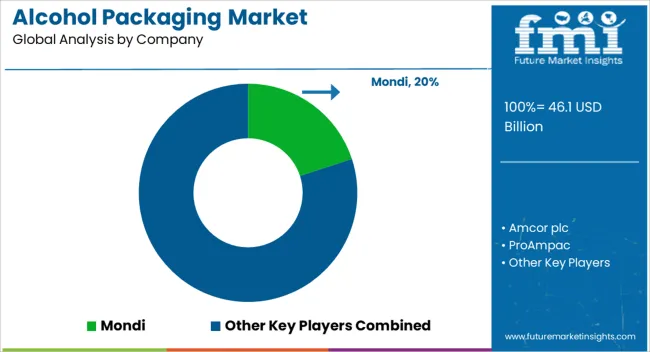
Attributed to the presence of such high number of participants, the market is highly consolidated and competitive at the same time. While global players such as Mondi, Amcor plc, ProAmpac, Crown, Ardagh Group S.A., BALL CORPORATION account for a considerable market size, several regional level players are also operating across key growth regions, particularly in the North America.
However, witnessing a promising future of the market several new market players have come with new technologies and revolutionary ideas to take over the existing players. For instance, Sustainable, a Hong Kong based home compostable food and beverage packaging company is aiming to create zero-waste lifestyle and household products, along with F&B packaging. The company’s primary product was a drinking straw made from natural sustainably sourced lepironia grass, a type of bamboo grass abundant in Southeast Asia.
Recent Developments
- In April 2019, Diageo PLC announced that it will not be using plastic packaging, globally, for its beer brand, Guinness, with a focus on minimizing plastic waste. The company is planning to invest EUR 16 million for this move and for the introduction of 100% recyclable and biodegradable cardboard to replace plastic.
- In March 2019, Amcor Ltd. acquired its rival Bemis Company Inc. The combination of these two market leaders, Amcor focuses to create a robust value proposition for shareholders, employees, customers, and the environment.
- In May 2022, Orora welcomes federal government grant to progress Australian first oxygen fuelled furnace project. The grant application will support planned construction of an oxygen fuelled furnace at the Orora Glass manufacturing plant in Gawler, South Australia.
Key Players
- Amcor plc.
- ProAmpac.
- Crown
- Ardagh Group S.A.
- Diageo PLC
- BALL CORPORATION
- Berry Global Inc.
- Tetra Pak Group
- Saint-Gobain Group.
- O-I Glass, Inc.
- Vetreria Etrusca
- Encore Glass
- Orora Packaging Australia Pvt Ltd
- Creative Glass
- Brick Packaging
- Bemis Manufacturing Company, Nampak Ltd.
- Krones AG
- Sidel Group
- Sonoco Products Company
Report Scope
Report Attribute |
Details |
Growth Rate |
CAGR of 3.9% from 2022 to 2032 |
Base Year for Estimation |
2021 |
Historical Data |
2016-2021 |
Forecast Period |
2022-2032 |
Quantitative Units |
Revenue in US$ Million and CAGR from 2022-2032 |
Report Coverage |
Revenue Forecast, Volume Forecast, Company Ranking, Competitive Landscape, Growth Factors, Trends and Pricing Analysis |
Segments Covered |
|
Regions Covered |
|
Key Countries Profiled |
|
Key Companies Profiled |
|
Customization |
Available Upon Request |
Key Segments
By Material Type:
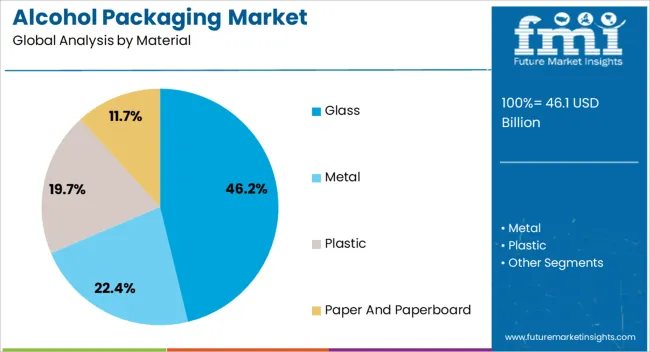
- Metal, Glass
- Plastic
- Paper
- Others
By Type:
- Cans
- Kegs
- Bottles
- Jars
- Others
By Alcoholic Beverages:
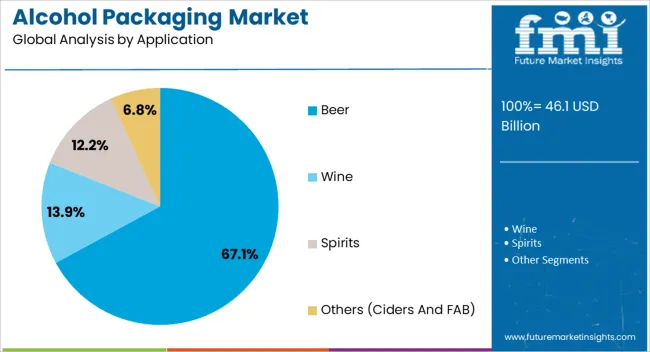
- Distilled
- Vodka
- Tequila
- Rum
- Whisky
- Gin
- Others
- Un-distilled Fermented
- Beer
- Wines
- Cider
By Region:
- North America
- Latin America
- Asia Pacific
- MEA
- Europe
Frequently Asked Questions
The alcohol packaging market is likely to grow at 3.9% through 2032.
The North American region is anticipated to lead the alcohol packaging market during the forecast period.
The alcohol packaging market is likely to be US$ 69234.6 Million by 2032.
Table of Content
1. Executive Summary
1.1. Global Market Outlook
1.2. Demand-side Trends
1.3. Supply-side Trends
1.4. Technology Roadmap Analysis
1.5. Analysis and Recommendations
2. Market Overview
2.1. Market Coverage / Taxonomy
2.2. Market Definition / Scope / Limitations
3. Market Background
3.1. Market Dynamics
3.1.1. Drivers
3.1.2. Restraints
3.1.3. Opportunity
3.1.4. Trends
3.2. Scenario Forecast
3.2.1. Demand in Optimistic Scenario
3.2.2. Demand in Likely Scenario
3.2.3. Demand in Conservative Scenario
3.3. Opportunity Map Analysis
3.4. Product Life Cycle Analysis
3.5. Supply Chain Analysis
3.5.1. Supply Side Participants and their Roles
3.5.1.1. Producers
3.5.1.2. Mid-Level Participants (Traders/ Agents/ Brokers)
3.5.1.3. Wholesalers and Distributors
3.5.2. Value Added and Value Created at Node in the Supply Chain
3.5.3. List of Raw Material Suppliers
3.5.4. List of Existing and Potential Buyer’s
3.6. Investment Feasibility Matrix
3.7. Value Chain Analysis
3.7.1. Profit Margin Analysis
3.7.2. Wholesalers and Distributors
3.7.3. Retailers
3.8. PESTLE and Porter’s Analysis
3.9. Regulatory Landscape
3.9.1. By Key Regions
3.9.2. By Key Countries
3.10. Regional Parent Market Outlook
3.11. Production and Consumption Statistics
3.12. Import and Export Statistics
4. Global Market Analysis 2017-2021 and Forecast, 2022-2032
4.1. Historical Market Size Value (US$ Mn) & Volume (Unit) Analysis, 2017-2021
4.2. Current and Future Market Size Value (US$ Mn) & Volume (Unit) Projections, 2022-2032
4.2.1. Y-o-Y Growth Trend Analysis
4.2.2. Absolute $ Opportunity Analysis
5. Global Market Analysis 2017-2021 and Forecast 2022-2032, By Material Used
5.1. Introduction / Key Findings
5.2. Historical Market Size Value (US$ Mn) & Volume (Unit) Analysis By Material Used, 2017-2021
5.3. Current and Future Market Size Value (US$ Mn) & Volume (Unit) Analysis and Forecast By Material Used, 2022-2032
5.3.1. Metal
5.3.2. Glass
5.3.3. Plastic
5.3.4. Paper
5.3.5. Other
5.4. Y-o-Y Growth Trend Analysis By Material Used, 2017-2021
5.5. Absolute $ Opportunity Analysis By Material Used, 2022-2032
6. Global Market Analysis 2017-2021 and Forecast 2022-2032, By Product Type
6.1. Introduction / Key Findings
6.2. Historical Market Size Value (US$ Mn) & Volume (Unit) Analysis By Product Type, 2017-2021
6.3. Current and Future Market Size Value (US$ Mn) & Volume (Unit) Analysis and Forecast By Product Type, 2022-2032
6.3.1. Cans
6.3.2. Kegs
6.3.3. Bottles
6.3.4. Jars
6.3.5. Other
6.4. Y-o-Y Growth Trend Analysis By Product Type, 2017-2021
6.5. Absolute $ Opportunity Analysis By Product Type, 2022-2032
7. Global Market Analysis 2017-2021 and Forecast 2022-2032, By Alcoholic Beverages
7.1. Introduction / Key Findings
7.2. Historical Market Size Value (US$ Mn) & Volume (Unit) Analysis By Alcoholic Beverages, 2017-2021
7.3. Current and Future Market Size Value (US$ Mn) & Volume (Unit) Analysis and Forecast By Alcoholic Beverages, 2022-2032
7.3.1. Un-distilled Fermented
7.3.1.1. Beer
7.3.1.2. Wines
7.3.1.3. Cider
7.3.2. Distilled
7.3.2.1. Vodka
7.3.2.2. Tequila
7.3.2.3. Rum
7.3.2.4. Whisky
7.3.2.5. Gin
7.3.2.6. Others
7.4. Y-o-Y Growth Trend Analysis By Alcoholic Beverages, 2017-2021
7.5. Absolute $ Opportunity Analysis By Alcoholic Beverages, 2022-2032
8. Global Market Analysis 2017-2021 and Forecast 2022-2032, By Region
8.1. Introduction
8.2. Historical Market Size Value (US$ Mn) & Volume (Unit) Analysis By Region, 2017-2021
8.3. Current Market Size Value (US$ Mn) & Volume (Unit) Analysis and Forecast By Region, 2022-2032
8.3.1. North America
8.3.2. Latin America
8.3.3. Europe
8.3.4. Asia Pacific
8.3.5. MEA
8.4. Market Attractiveness Analysis By Region
9. North America Market Analysis 2017-2021 and Forecast 2022-2032, By Country
9.1. Historical Market Size Value (US$ Mn) & Volume (Unit) Trend Analysis By Market Taxonomy, 2017-2021
9.2. Market Size Value (US$ Mn) & Volume (Unit) Forecast By Market Taxonomy, 2022-2032
9.2.1. By Country
9.2.1.1. U.S.
9.2.1.2. Canada
9.2.2. By Material Used
9.2.3. By Product Type
9.2.4. By Alcoholic Beverages
9.3. Market Attractiveness Analysis
9.3.1. By Country
9.3.2. By Material Used
9.3.3. By Product Type
9.3.4. By Alcoholic Beverages
9.4. Key Takeaways
10. Latin America Market Analysis 2017-2021 and Forecast 2022-2032, By Country
10.1. Historical Market Size Value (US$ Mn) & Volume (Unit) Trend Analysis By Market Taxonomy, 2017-2021
10.2. Market Size Value (US$ Mn) & Volume (Unit) Forecast By Market Taxonomy, 2022-2032
10.2.1. By Country
10.2.1.1. Brazil
10.2.1.2. Mexico
10.2.1.3. Rest of Latin America
10.2.2. By Material Used
10.2.3. By Product Type
10.2.4. By Alcoholic Beverages
10.3. Market Attractiveness Analysis
10.3.1. By Country
10.3.2. By Material Used
10.3.3. By Product Type
10.3.4. By Alcoholic Beverages
10.4. Key Takeaways
11. Europe Market Analysis 2017-2021 and Forecast 2022-2032, By Country
11.1. Historical Market Size Value (US$ Mn) & Volume (Unit) Trend Analysis By Market Taxonomy, 2017-2021
11.2. Market Size Value (US$ Mn) & Volume (Unit) Forecast By Market Taxonomy, 2022-2032
11.2.1. By Country
11.2.1.1. Germany
11.2.1.2. U.K.
11.2.1.3. France
11.2.1.4. Spain
11.2.1.5. Italy
11.2.1.6. Rest of Europe
11.2.2. By Material Used
11.2.3. By Product Type
11.2.4. By Alcoholic Beverages
11.3. Market Attractiveness Analysis
11.3.1. By Country
11.3.2. By Material Used
11.3.3. By Product Type
11.3.4. By Alcoholic Beverages
11.4. Key Takeaways
12. Asia Pacific Market Analysis 2017-2021 and Forecast 2022-2032, By Country
12.1. Historical Market Size Value (US$ Mn) & Volume (Unit) Trend Analysis By Market Taxonomy, 2017-2021
12.2. Market Size Value (US$ Mn) & Volume (Unit) Forecast By Market Taxonomy, 2022-2032
12.2.1. By Country
12.2.1.1. China
12.2.1.2. Japan
12.2.1.3. South Korea
12.2.1.4. Malaysia
12.2.1.5. Singapore
12.2.1.6. Australia
12.2.1.7. New Zealand
12.2.1.8. Rest of APAC
12.2.2. By Material Used
12.2.3. By Product Type
12.2.4. By Alcoholic Beverages
12.3. Market Attractiveness Analysis
12.3.1. By Country
12.3.2. By Material Used
12.3.3. By Product Type
12.3.4. By Alcoholic Beverages
12.4. Key Takeaways
13. MEA Market Analysis 2017-2021 and Forecast 2022-2032, By Country
13.1. Historical Market Size Value (US$ Mn) & Volume (Unit) Trend Analysis By Market Taxonomy, 2017-2021
13.2. Market Size Value (US$ Mn) & Volume (Unit) Forecast By Market Taxonomy, 2022-2032
13.2.1. By Country
13.2.1.1. GCC Countries
13.2.1.2. South Africa
13.2.1.3. Israel
13.2.1.4. Rest of MEA
13.2.2. By Material Used
13.2.3. By Product Type
13.2.4. By Alcoholic Beverages
13.3. Market Attractiveness Analysis
13.3.1. By Country
13.3.2. By Material Used
13.3.3. By Product Type
13.3.4. By Alcoholic Beverages
13.4. Key Takeaways
14. Key Countries Market Analysis
14.1. U.S.
14.1.1. Pricing Analysis
14.1.2. Market Share Analysis, 2021
14.1.2.1. By Material Used
14.1.2.2. By Product Type
14.1.2.3. By Alcoholic Beverages
14.2. Canada
14.2.1. Pricing Analysis
14.2.2. Market Share Analysis, 2021
14.2.2.1. By Material Used
14.2.2.2. By Product Type
14.2.2.3. By Alcoholic Beverages
14.3. Brazil
14.3.1. Pricing Analysis
14.3.2. Market Share Analysis, 2021
14.3.2.1. By Material Used
14.3.2.2. By Product Type
14.3.2.3. By Alcoholic Beverages
14.4. Mexico
14.4.1. Pricing Analysis
14.4.2. Market Share Analysis, 2021
14.4.2.1. By Material Used
14.4.2.2. By Product Type
14.4.2.3. By Alcoholic Beverages
14.5. Germany
14.5.1. Pricing Analysis
14.5.2. Market Share Analysis, 2021
14.5.2.1. By Material Used
14.5.2.2. By Product Type
14.5.2.3. By Alcoholic Beverages
14.6. U.K.
14.6.1. Pricing Analysis
14.6.2. Market Share Analysis, 2021
14.6.2.1. By Material Used
14.6.2.2. By Product Type
14.6.2.3. By Alcoholic Beverages
14.7. France
14.7.1. Pricing Analysis
14.7.2. Market Share Analysis, 2021
14.7.2.1. By Material Used
14.7.2.2. By Product Type
14.7.2.3. By Alcoholic Beverages
14.8. Spain
14.8.1. Pricing Analysis
14.8.2. Market Share Analysis, 2021
14.8.2.1. By Material Used
14.8.2.2. By Product Type
14.8.2.3. By Alcoholic Beverages
14.9. Italy
14.9.1. Pricing Analysis
14.9.2. Market Share Analysis, 2021
14.9.2.1. By Material Used
14.9.2.2. By Product Type
14.9.2.3. By Alcoholic Beverages
14.10. China
14.10.1. Pricing Analysis
14.10.2. Market Share Analysis, 2021
14.10.2.1. By Material Used
14.10.2.2. By Product Type
14.10.2.3. By Alcoholic Beverages
14.11. Japan
14.11.1. Pricing Analysis
14.11.2. Market Share Analysis, 2021
14.11.2.1. By Material Used
14.11.2.2. By Product Type
14.11.2.3. By Alcoholic Beverages
14.12. South Korea
14.12.1. Pricing Analysis
14.12.2. Market Share Analysis, 2021
14.12.2.1. By Material Used
14.12.2.2. By Product Type
14.12.2.3. By Alcoholic Beverages
14.13. Malaysia
14.13.1. Pricing Analysis
14.13.2. Market Share Analysis, 2021
14.13.2.1. By Material Used
14.13.2.2. By Product Type
14.13.2.3. By Alcoholic Beverages
14.14. Singapore
14.14.1. Pricing Analysis
14.14.2. Market Share Analysis, 2021
14.14.2.1. By Material Used
14.14.2.2. By Product Type
14.14.2.3. By Alcoholic Beverages
14.15. Australia
14.15.1. Pricing Analysis
14.15.2. Market Share Analysis, 2021
14.15.2.1. By Material Used
14.15.2.2. By Product Type
14.15.2.3. By Alcoholic Beverages
14.16. New Zealand
14.16.1. Pricing Analysis
14.16.2. Market Share Analysis, 2021
14.16.2.1. By Material Used
14.16.2.2. By Product Type
14.16.2.3. By Alcoholic Beverages
14.17. GCC Countries
14.17.1. Pricing Analysis
14.17.2. Market Share Analysis, 2021
14.17.2.1. By Material Used
14.17.2.2. By Product Type
14.17.2.3. By Alcoholic Beverages
14.18. South Africa
14.18.1. Pricing Analysis
14.18.2. Market Share Analysis, 2021
14.18.2.1. By Material Used
14.18.2.2. By Product Type
14.18.2.3. By Alcoholic Beverages
14.19. Israel
14.19.1. Pricing Analysis
14.19.2. Market Share Analysis, 2021
14.19.2.1. By Material Used
14.19.2.2. By Product Type
14.19.2.3. By Alcoholic Beverages
15. Market Structure Analysis
15.1. Competition Dashboard
15.2. Competition Benchmarking
15.3. Market Share Analysis of Top Players
15.3.1. By Regional
15.3.2. By Material Used
15.3.3. By Product Type
15.3.4. By Alcoholic Beverages
16. Competition Analysis
16.1. Competition Deep Dive
16.1.1. Amcor Plc.
16.1.1.1. Overview
16.1.1.2. Product Portfolio
16.1.1.3. Profitability by Market Segments
16.1.1.4. Sales Footprint
16.1.1.5. Strategy Overview
16.1.1.5.1. Marketing Strategy
16.1.1.5.2. Product Strategy
16.1.1.5.3. Channel Strategy
16.1.2. ProAmpac
16.1.2.1. Overview
16.1.2.2. Product Portfolio
16.1.2.3. Profitability by Market Segments
16.1.2.4. Sales Footprint
16.1.2.5. Strategy Overview
16.1.2.5.1. Marketing Strategy
16.1.2.5.2. Product Strategy
16.1.2.5.3. Channel Strategy
16.1.3. Crown
16.1.3.1. Overview
16.1.3.2. Product Portfolio
16.1.3.3. Profitability by Market Segments
16.1.3.4. Sales Footprint
16.1.3.5. Strategy Overview
16.1.3.5.1. Marketing Strategy
16.1.3.5.2. Product Strategy
16.1.3.5.3. Channel Strategy
16.1.4. Ardagh Group S.A.
16.1.4.1. Overview
16.1.4.2. Product Portfolio
16.1.4.3. Profitability by Market Segments
16.1.4.4. Sales Footprint
16.1.4.5. Strategy Overview
16.1.4.5.1. Marketing Strategy
16.1.4.5.2. Product Strategy
16.1.4.5.3. Channel Strategy
16.1.5. Berry Global Inc.
16.1.5.1. Overview
16.1.5.2. Product Portfolio
16.1.5.3. Profitability by Market Segments
16.1.5.4. Sales Footprint
16.1.5.5. Strategy Overview
16.1.5.5.1. Marketing Strategy
16.1.5.5.2. Product Strategy
16.1.5.5.3. Channel Strategy
16.1.6. Tetra Pak Group
16.1.6.1. Overview
16.1.6.2. Product Portfolio
16.1.6.3. Profitability by Market Segments
16.1.6.4. Sales Footprint
16.1.6.5. Strategy Overview
16.1.6.5.1. Marketing Strategy
16.1.6.5.2. Product Strategy
16.1.6.5.3. Channel Strategy
16.1.7. Saint-Gobain Group.
16.1.7.1. Overview
16.1.7.2. Product Portfolio
16.1.7.3. Profitability by Market Segments
16.1.7.4. Sales Footprint
16.1.7.5. Strategy Overview
16.1.7.5.1. Marketing Strategy
16.1.7.5.2. Product Strategy
16.1.7.5.3. Channel Strategy
16.1.8. O-I Glass, Inc.
16.1.8.1. Overview
16.1.8.2. Product Portfolio
16.1.8.3. Profitability by Market Segments
16.1.8.4. Sales Footprint
16.1.8.5. Strategy Overview
16.1.8.5.1. Marketing Strategy
16.1.8.5.2. Product Strategy
16.1.8.5.3. Channel Strategy
16.1.9. Vetreria Etrusca
16.1.9.1. Overview
16.1.9.2. Product Portfolio
16.1.9.3. Profitability by Market Segments
16.1.9.4. Sales Footprint
16.1.9.5. Strategy Overview
16.1.9.5.1. Marketing Strategy
16.1.9.5.2. Product Strategy
16.1.9.5.3. Channel Strategy
16.1.10. Encore Glas
16.1.10.1. Overview
16.1.10.2. Product Portfolio
16.1.10.3. Profitability by Market Segments
16.1.10.4. Sales Footprint
16.1.10.5. Strategy Overview
16.1.10.5.1. Marketing Strategy
16.1.10.5.2. Product Strategy
16.1.10.5.3. Channel Strategy
16.1.11. Orora Packaging Australia Pty Ltd
16.1.11.1. Overview
16.1.11.2. Product Portfolio
16.1.11.3. Profitability by Market Segments
16.1.11.4. Sales Footprint
16.1.11.5. Strategy Overview
16.1.11.5.1. Marketing Strategy
16.1.11.5.2. Product Strategy
16.1.11.5.3. Channel Strategy
16.1.12. Creative Glass
16.1.12.1. Overview
16.1.12.2. Product Portfolio
16.1.12.3. Profitability by Market Segments
16.1.12.4. Sales Footprint
16.1.12.5. Strategy Overview
16.1.12.5.1. Marketing Strategy
16.1.12.5.2. Product Strategy
16.1.12.5.3. Channel Strategy
16.1.13. Brick Packaging
16.1.13.1. Overview
16.1.13.2. Product Portfolio
16.1.13.3. Profitability by Market Segments
16.1.13.4. Sales Footprint
16.1.13.5. Strategy Overview
16.1.13.5.1. Marketing Strategy
16.1.13.5.2. Product Strategy
16.1.13.5.3. Channel Strategy
16.1.14. Bemis Manufacturing Company
16.1.14.1. Overview
16.1.14.2. Product Portfolio
16.1.14.3. Profitability by Market Segments
16.1.14.4. Sales Footprint
16.1.14.5. Strategy Overview
16.1.14.5.1. Marketing Strategy
16.1.14.5.2. Product Strategy
16.1.14.5.3. Channel Strategy
16.1.15. Nampak Ltd.
16.1.15.1. Overview
16.1.15.2. Product Portfolio
16.1.15.3. Profitability by Market Segments
16.1.15.4. Sales Footprint
16.1.15.5. Strategy Overview
16.1.15.5.1. Marketing Strategy
16.1.15.5.2. Product Strategy
16.1.15.5.3. Channel Strategy
16.1.16. Krones AG
16.1.16.1. Overview
16.1.16.2. Product Portfolio
16.1.16.3. Profitability by Market Segments
16.1.16.4. Sales Footprint
16.1.16.5. Strategy Overview
16.1.16.5.1. Marketing Strategy
16.1.16.5.2. Product Strategy
16.1.16.5.3. Channel Strategy
16.1.17. Sidel Group
16.1.17.1. Overview
16.1.17.2. Product Portfolio
16.1.17.3. Profitability by Market Segments
16.1.17.4. Sales Footprint
16.1.17.5. Strategy Overview
16.1.17.5.1. Marketing Strategy
16.1.17.5.2. Product Strategy
16.1.17.5.3. Channel Strategy
16.1.18. Sonoco Products Company
16.1.18.1. Overview
16.1.18.2. Product Portfolio
16.1.18.3. Profitability by Market Segments
16.1.18.4. Sales Footprint
16.1.18.5. Strategy Overview
16.1.18.5.1. Marketing Strategy
16.1.18.5.2. Product Strategy
16.1.18.5.3. Channel Strategy
16.1.19. Mondi
16.1.19.1. Overview
16.1.19.2. Product Portfolio
16.1.19.3. Profitability by Market Segments
16.1.19.4. Sales Footprint
16.1.19.5. Strategy Overview
16.1.19.5.1. Marketing Strategy
16.1.19.5.2. Product Strategy
16.1.19.5.3. Channel Strategy
16.1.20. BALL CORPORATION
16.1.20.1. Overview
16.1.20.2. Product Portfolio
16.1.20.3. Profitability by Market Segments
16.1.20.4. Sales Footprint
16.1.20.5. Strategy Overview
16.1.20.5.1. Marketing Strategy
16.1.20.5.2. Product Strategy
16.1.20.5.3. Channel Strategy
17. Assumptions & Acronyms Used
18. Research Methodology
Let us know your requirement to get
100% FREE customization
List of Tables
Table 1: Global Market Value (US$ Mn) Forecast by Region, 2017-2032
Table 2: Global Market Volume (Unit) Forecast by Region, 2017-2032
Table 3: Global Market Value (US$ Mn) Forecast by Material Used, 2017-2032
Table 4: Global Market Volume (Unit) Forecast by Material Used, 2017-2032
Table 5: Global Market Value (US$ Mn) Forecast by Product Type, 2017-2032
Table 6: Global Market Volume (Unit) Forecast by Product Type, 2017-2032
Table 7: Global Market Value (US$ Mn) Forecast by Alcoholic Beverages, 2017-2032
Table 8: Global Market Volume (Unit) Forecast by Alcoholic Beverages, 2017-2032
Table 9: North America Market Value (US$ Mn) Forecast by Country, 2017-2032
Table 10: North America Market Volume (Unit) Forecast by Country, 2017-2032
Table 11: North America Market Value (US$ Mn) Forecast by Material Used, 2017-2032
Table 12: North America Market Volume (Unit) Forecast by Material Used, 2017-2032
Table 13: North America Market Value (US$ Mn) Forecast by Product Type, 2017-2032
Table 14: North America Market Volume (Unit) Forecast by Product Type, 2017-2032
Table 15: North America Market Value (US$ Mn) Forecast by Alcoholic Beverages, 2017-2032
Table 16: North America Market Volume (Unit) Forecast by Alcoholic Beverages, 2017-2032
Table 17: Latin America Market Value (US$ Mn) Forecast by Country, 2017-2032
Table 18: Latin America Market Volume (Unit) Forecast by Country, 2017-2032
Table 19: Latin America Market Value (US$ Mn) Forecast by Material Used, 2017-2032
Table 20: Latin America Market Volume (Unit) Forecast by Material Used, 2017-2032
Table 21: Latin America Market Value (US$ Mn) Forecast by Product Type, 2017-2032
Table 22: Latin America Market Volume (Unit) Forecast by Product Type, 2017-2032
Table 23: Latin America Market Value (US$ Mn) Forecast by Alcoholic Beverages, 2017-2032
Table 24: Latin America Market Volume (Unit) Forecast by Alcoholic Beverages, 2017-2032
Table 25: Europe Market Value (US$ Mn) Forecast by Country, 2017-2032
Table 26: Europe Market Volume (Unit) Forecast by Country, 2017-2032
Table 27: Europe Market Value (US$ Mn) Forecast by Material Used, 2017-2032
Table 28: Europe Market Volume (Unit) Forecast by Material Used, 2017-2032
Table 29: Europe Market Value (US$ Mn) Forecast by Product Type, 2017-2032
Table 30: Europe Market Volume (Unit) Forecast by Product Type, 2017-2032
Table 31: Europe Market Value (US$ Mn) Forecast by Alcoholic Beverages, 2017-2032
Table 32: Europe Market Volume (Unit) Forecast by Alcoholic Beverages, 2017-2032
Table 33: Asia Pacific Market Value (US$ Mn) Forecast by Country, 2017-2032
Table 34: Asia Pacific Market Volume (Unit) Forecast by Country, 2017-2032
Table 35: Asia Pacific Market Value (US$ Mn) Forecast by Material Used, 2017-2032
Table 36: Asia Pacific Market Volume (Unit) Forecast by Material Used, 2017-2032
Table 37: Asia Pacific Market Value (US$ Mn) Forecast by Product Type, 2017-2032
Table 38: Asia Pacific Market Volume (Unit) Forecast by Product Type, 2017-2032
Table 39: Asia Pacific Market Value (US$ Mn) Forecast by Alcoholic Beverages, 2017-2032
Table 40: Asia Pacific Market Volume (Unit) Forecast by Alcoholic Beverages, 2017-2032
Table 41: MEA Market Value (US$ Mn) Forecast by Country, 2017-2032
Table 42: MEA Market Volume (Unit) Forecast by Country, 2017-2032
Table 43: MEA Market Value (US$ Mn) Forecast by Material Used, 2017-2032
Table 44: MEA Market Volume (Unit) Forecast by Material Used, 2017-2032
Table 45: MEA Market Value (US$ Mn) Forecast by Product Type, 2017-2032
Table 46: MEA Market Volume (Unit) Forecast by Product Type, 2017-2032
Table 47: MEA Market Value (US$ Mn) Forecast by Alcoholic Beverages, 2017-2032
Table 48: MEA Market Volume (Unit) Forecast by Alcoholic Beverages, 2017-2032
Find your sweet spots for generating winning opportunities in this market.
Talk to AnalystList of Charts
Figure 1: Global Market Value (US$ Mn) by Material Used, 2022-2032
Figure 2: Global Market Value (US$ Mn) by Product Type, 2022-2032
Figure 3: Global Market Value (US$ Mn) by Alcoholic Beverages, 2022-2032
Figure 4: Global Market Value (US$ Mn) by Region, 2022-2032
Figure 5: Global Market Value (US$ Mn) Analysis by Region, 2017-2032
Figure 6: Global Market Volume (Unit) Analysis by Region, 2017-2032
Figure 7: Global Market Value Share (%) and BPS Analysis by Region, 2022-2032
Figure 8: Global Market Y-o-Y Growth (%) Projections by Region, 2022-2032
Figure 9: Global Market Value (US$ Mn) Analysis by Material Used, 2017-2032
Figure 10: Global Market Volume (Unit) Analysis by Material Used, 2017-2032
Figure 11: Global Market Value Share (%) and BPS Analysis by Material Used, 2022-2032
Figure 12: Global Market Y-o-Y Growth (%) Projections by Material Used, 2022-2032
Figure 13: Global Market Value (US$ Mn) Analysis by Product Type, 2017-2032
Figure 14: Global Market Volume (Unit) Analysis by Product Type, 2017-2032
Figure 15: Global Market Value Share (%) and BPS Analysis by Product Type, 2022-2032
Figure 16: Global Market Y-o-Y Growth (%) Projections by Product Type, 2022-2032
Figure 17: Global Market Value (US$ Mn) Analysis by Alcoholic Beverages, 2017-2032
Figure 18: Global Market Volume (Unit) Analysis by Alcoholic Beverages, 2017-2032
Figure 19: Global Market Value Share (%) and BPS Analysis by Alcoholic Beverages, 2022-2032
Figure 20: Global Market Y-o-Y Growth (%) Projections by Alcoholic Beverages, 2022-2032
Figure 21: Global Market Attractiveness by Material Used, 2022-2032
Figure 22: Global Market Attractiveness by Product Type, 2022-2032
Figure 23: Global Market Attractiveness by Alcoholic Beverages, 2022-2032
Figure 24: Global Market Attractiveness by Region, 2022-2032
Figure 25: North America Market Value (US$ Mn) by Material Used, 2022-2032
Figure 26: North America Market Value (US$ Mn) by Product Type, 2022-2032
Figure 27: North America Market Value (US$ Mn) by Alcoholic Beverages, 2022-2032
Figure 28: North America Market Value (US$ Mn) by Country, 2022-2032
Figure 29: North America Market Value (US$ Mn) Analysis by Country, 2017-2032
Figure 30: North America Market Volume (Unit) Analysis by Country, 2017-2032
Figure 31: North America Market Value Share (%) and BPS Analysis by Country, 2022-2032
Figure 32: North America Market Y-o-Y Growth (%) Projections by Country, 2022-2032
Figure 33: North America Market Value (US$ Mn) Analysis by Material Used, 2017-2032
Figure 34: North America Market Volume (Unit) Analysis by Material Used, 2017-2032
Figure 35: North America Market Value Share (%) and BPS Analysis by Material Used, 2022-2032
Figure 36: North America Market Y-o-Y Growth (%) Projections by Material Used, 2022-2032
Figure 37: North America Market Value (US$ Mn) Analysis by Product Type, 2017-2032
Figure 38: North America Market Volume (Unit) Analysis by Product Type, 2017-2032
Figure 39: North America Market Value Share (%) and BPS Analysis by Product Type, 2022-2032
Figure 40: North America Market Y-o-Y Growth (%) Projections by Product Type, 2022-2032
Figure 41: North America Market Value (US$ Mn) Analysis by Alcoholic Beverages, 2017-2032
Figure 42: North America Market Volume (Unit) Analysis by Alcoholic Beverages, 2017-2032
Figure 43: North America Market Value Share (%) and BPS Analysis by Alcoholic Beverages, 2022-2032
Figure 44: North America Market Y-o-Y Growth (%) Projections by Alcoholic Beverages, 2022-2032
Figure 45: North America Market Attractiveness by Material Used, 2022-2032
Figure 46: North America Market Attractiveness by Product Type, 2022-2032
Figure 47: North America Market Attractiveness by Alcoholic Beverages, 2022-2032
Figure 48: North America Market Attractiveness by Country, 2022-2032
Figure 49: Latin America Market Value (US$ Mn) by Material Used, 2022-2032
Figure 50: Latin America Market Value (US$ Mn) by Product Type, 2022-2032
Figure 51: Latin America Market Value (US$ Mn) by Alcoholic Beverages, 2022-2032
Figure 52: Latin America Market Value (US$ Mn) by Country, 2022-2032
Figure 53: Latin America Market Value (US$ Mn) Analysis by Country, 2017-2032
Figure 54: Latin America Market Volume (Unit) Analysis by Country, 2017-2032
Figure 55: Latin America Market Value Share (%) and BPS Analysis by Country, 2022-2032
Figure 56: Latin America Market Y-o-Y Growth (%) Projections by Country, 2022-2032
Figure 57: Latin America Market Value (US$ Mn) Analysis by Material Used, 2017-2032
Figure 58: Latin America Market Volume (Unit) Analysis by Material Used, 2017-2032
Figure 59: Latin America Market Value Share (%) and BPS Analysis by Material Used, 2022-2032
Figure 60: Latin America Market Y-o-Y Growth (%) Projections by Material Used, 2022-2032
Figure 61: Latin America Market Value (US$ Mn) Analysis by Product Type, 2017-2032
Figure 62: Latin America Market Volume (Unit) Analysis by Product Type, 2017-2032
Figure 63: Latin America Market Value Share (%) and BPS Analysis by Product Type, 2022-2032
Figure 64: Latin America Market Y-o-Y Growth (%) Projections by Product Type, 2022-2032
Figure 65: Latin America Market Value (US$ Mn) Analysis by Alcoholic Beverages, 2017-2032
Figure 66: Latin America Market Volume (Unit) Analysis by Alcoholic Beverages, 2017-2032
Figure 67: Latin America Market Value Share (%) and BPS Analysis by Alcoholic Beverages, 2022-2032
Figure 68: Latin America Market Y-o-Y Growth (%) Projections by Alcoholic Beverages, 2022-2032
Figure 69: Latin America Market Attractiveness by Material Used, 2022-2032
Figure 70: Latin America Market Attractiveness by Product Type, 2022-2032
Figure 71: Latin America Market Attractiveness by Alcoholic Beverages, 2022-2032
Figure 72: Latin America Market Attractiveness by Country, 2022-2032
Figure 73: Europe Market Value (US$ Mn) by Material Used, 2022-2032
Figure 74: Europe Market Value (US$ Mn) by Product Type, 2022-2032
Figure 75: Europe Market Value (US$ Mn) by Alcoholic Beverages, 2022-2032
Figure 76: Europe Market Value (US$ Mn) by Country, 2022-2032
Figure 77: Europe Market Value (US$ Mn) Analysis by Country, 2017-2032
Figure 78: Europe Market Volume (Unit) Analysis by Country, 2017-2032
Figure 79: Europe Market Value Share (%) and BPS Analysis by Country, 2022-2032
Figure 80: Europe Market Y-o-Y Growth (%) Projections by Country, 2022-2032
Figure 81: Europe Market Value (US$ Mn) Analysis by Material Used, 2017-2032
Figure 82: Europe Market Volume (Unit) Analysis by Material Used, 2017-2032
Figure 83: Europe Market Value Share (%) and BPS Analysis by Material Used, 2022-2032
Figure 84: Europe Market Y-o-Y Growth (%) Projections by Material Used, 2022-2032
Figure 85: Europe Market Value (US$ Mn) Analysis by Product Type, 2017-2032
Figure 86: Europe Market Volume (Unit) Analysis by Product Type, 2017-2032
Figure 87: Europe Market Value Share (%) and BPS Analysis by Product Type, 2022-2032
Figure 88: Europe Market Y-o-Y Growth (%) Projections by Product Type, 2022-2032
Figure 89: Europe Market Value (US$ Mn) Analysis by Alcoholic Beverages, 2017-2032
Figure 90: Europe Market Volume (Unit) Analysis by Alcoholic Beverages, 2017-2032
Figure 91: Europe Market Value Share (%) and BPS Analysis by Alcoholic Beverages, 2022-2032
Figure 92: Europe Market Y-o-Y Growth (%) Projections by Alcoholic Beverages, 2022-2032
Figure 93: Europe Market Attractiveness by Material Used, 2022-2032
Figure 94: Europe Market Attractiveness by Product Type, 2022-2032
Figure 95: Europe Market Attractiveness by Alcoholic Beverages, 2022-2032
Figure 96: Europe Market Attractiveness by Country, 2022-2032
Figure 97: Asia Pacific Market Value (US$ Mn) by Material Used, 2022-2032
Figure 98: Asia Pacific Market Value (US$ Mn) by Product Type, 2022-2032
Figure 99: Asia Pacific Market Value (US$ Mn) by Alcoholic Beverages, 2022-2032
Figure 100: Asia Pacific Market Value (US$ Mn) by Country, 2022-2032
Figure 101: Asia Pacific Market Value (US$ Mn) Analysis by Country, 2017-2032
Figure 102: Asia Pacific Market Volume (Unit) Analysis by Country, 2017-2032
Figure 103: Asia Pacific Market Value Share (%) and BPS Analysis by Country, 2022-2032
Figure 104: Asia Pacific Market Y-o-Y Growth (%) Projections by Country, 2022-2032
Figure 105: Asia Pacific Market Value (US$ Mn) Analysis by Material Used, 2017-2032
Figure 106: Asia Pacific Market Volume (Unit) Analysis by Material Used, 2017-2032
Figure 107: Asia Pacific Market Value Share (%) and BPS Analysis by Material Used, 2022-2032
Figure 108: Asia Pacific Market Y-o-Y Growth (%) Projections by Material Used, 2022-2032
Figure 109: Asia Pacific Market Value (US$ Mn) Analysis by Product Type, 2017-2032
Figure 110: Asia Pacific Market Volume (Unit) Analysis by Product Type, 2017-2032
Figure 111: Asia Pacific Market Value Share (%) and BPS Analysis by Product Type, 2022-2032
Figure 112: Asia Pacific Market Y-o-Y Growth (%) Projections by Product Type, 2022-2032
Figure 113: Asia Pacific Market Value (US$ Mn) Analysis by Alcoholic Beverages, 2017-2032
Figure 114: Asia Pacific Market Volume (Unit) Analysis by Alcoholic Beverages, 2017-2032
Figure 115: Asia Pacific Market Value Share (%) and BPS Analysis by Alcoholic Beverages, 2022-2032
Figure 116: Asia Pacific Market Y-o-Y Growth (%) Projections by Alcoholic Beverages, 2022-2032
Figure 117: Asia Pacific Market Attractiveness by Material Used, 2022-2032
Figure 118: Asia Pacific Market Attractiveness by Product Type, 2022-2032
Figure 119: Asia Pacific Market Attractiveness by Alcoholic Beverages, 2022-2032
Figure 120: Asia Pacific Market Attractiveness by Country, 2022-2032
Figure 121: MEA Market Value (US$ Mn) by Material Used, 2022-2032
Figure 122: MEA Market Value (US$ Mn) by Product Type, 2022-2032
Figure 123: MEA Market Value (US$ Mn) by Alcoholic Beverages, 2022-2032
Figure 124: MEA Market Value (US$ Mn) by Country, 2022-2032
Figure 125: MEA Market Value (US$ Mn) Analysis by Country, 2017-2032
Figure 126: MEA Market Volume (Unit) Analysis by Country, 2017-2032
Figure 127: MEA Market Value Share (%) and BPS Analysis by Country, 2022-2032
Figure 128: MEA Market Y-o-Y Growth (%) Projections by Country, 2022-2032
Figure 129: MEA Market Value (US$ Mn) Analysis by Material Used, 2017-2032
Figure 130: MEA Market Volume (Unit) Analysis by Material Used, 2017-2032
Figure 131: MEA Market Value Share (%) and BPS Analysis by Material Used, 2022-2032
Figure 132: MEA Market Y-o-Y Growth (%) Projections by Material Used, 2022-2032
Figure 133: MEA Market Value (US$ Mn) Analysis by Product Type, 2017-2032
Figure 134: MEA Market Volume (Unit) Analysis by Product Type, 2017-2032
Figure 135: MEA Market Value Share (%) and BPS Analysis by Product Type, 2022-2032
Figure 136: MEA Market Y-o-Y Growth (%) Projections by Product Type, 2022-2032
Figure 137: MEA Market Value (US$ Mn) Analysis by Alcoholic Beverages, 2017-2032
Figure 138: MEA Market Volume (Unit) Analysis by Alcoholic Beverages, 2017-2032
Figure 139: MEA Market Value Share (%) and BPS Analysis by Alcoholic Beverages, 2022-2032
Figure 140: MEA Market Y-o-Y Growth (%) Projections by Alcoholic Beverages, 2022-2032
Figure 141: MEA Market Attractiveness by Material Used, 2022-2032
Figure 142: MEA Market Attractiveness by Product Type, 2022-2032
Figure 143: MEA Market Attractiveness by Alcoholic Beverages, 2022-2032
Figure 144: MEA Market Attractiveness by Country, 2022-2032
Need specific information?
Request CustomizationExplore Packaging Insights
View Reports