Anti-Redness / Anti-Couperose Agents Market Size and Share Forecast Outlook 2025 to 2035

A valuation of USD 1,483.6 Million is anticipated for the Anti-Redness / Anti-Couperose Agents Market in 2025, with the size projected to reach USD 3,402.3 Million by 2035. This reflects an increase of nearly USD 1,918.7 Million over the decade, equating to an overall growth of 193%. The expansion corresponds to a CAGR of 8.7%, indicating a sustained rise in demand for redness-reducing actives across global formulation pipelines.
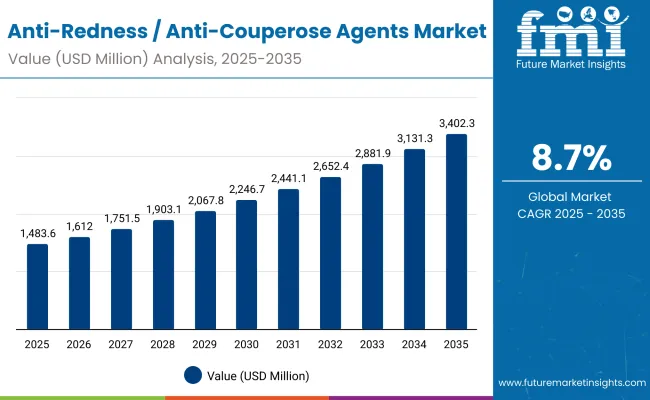
Anti Redness Anti Couperose Agents Market

Quick Stats for Anti-Redness / Anti-Couperose Agents Market

  • Market Value (2025): USD 1,483.6 Million
  • Forecast Value (2035): USD 3,402.3 Million
  • Forecast CAGR (2025 to 2035): 8.7%
  • Leading Segment in 2025: Capillary & vasoprotection (39.0%)
  • Key Growth Regions: North America, Asia-Pacific, Europe
  • Top Key Players: Givaudan, Symrise, Croda, DSM-Firmenich, Ashland, Seppic, Clariant, Lucas Meyer, Rahn, Greentech

Anti-Redness / Anti-Couperose Agents Market Key Takeaways

Metric Value
Anti-Redness / Anti-Couperose Agents Market Estimated Value in (2025E) USD 1,483.6 Million
Anti-Redness / Anti-Couperose Agents Market Forecast Value in (2035F) USD 3,402.3 Million
Forecast CAGR (2025 to 2035) 8.70%

The market trajectory signals a doubling of size within ten years, reinforcing its position as a high-growth segment within the broader skin care ingredients space.

During the initial phase from 2025 to 2030, the market value is set to expand from USD 1,483.6 Million to USD 2,246.7 Million, adding USD 763.1 Million. This period will contribute 40% of the total decade growth, underpinned by steady adoption of capillary and vasoprotective ingredients and the early shift toward encapsulated delivery systems. The emphasis by formulators on proven efficacy in sensitive and rosacea-prone care is expected to consolidate demand during this period.

The second half from 2030 to 2035 is forecast to deliver USD 1,155.6 Million, accounting for 60% of the total decade growth. Market size is projected to advance from USD 2,246.7 Million in 2030 to USD 3,402.3 Million in 2035. This acceleration will be powered by strong penetration of encapsulated and polymer-complexed raw materials, together with intensified use of botanical actives supported by traceability and clean-label positioning. Capillary & vasoprotection will remain dominant with 39.0% share, while encapsulated delivery systems are expected to lead with 46.0% share in 2025.

From 2020 to 2024, the Anti-Redness / Anti-Couperose Agents Market progressed steadily as dermocosmetic adoption increased and demand for sensitive-skin formulations intensified. By 2025, valuation is expected at USD 1,483.6 Million, with accelerated growth projected as encapsulated and botanical actives gain stronger penetration. Competitive dynamics are expected to remain fragmented, although leading suppliers are likely to secure advantage through standardized efficacy data, advanced delivery technologies, and sustainable sourcing models.

Regional growth is anticipated to be highest in Asia-Pacific, supported by expanding consumer awareness and evolving cosmetic regulatory frameworks, while North America and Europe are expected to retain dominance through high-value formulations. By 2035, the market size is forecast to more than double, with differentiation projected to rely less on single-molecule innovation and more on ecosystem capabilities such as supply resilience, green chemistry, and clinically validated claims.

Why the Anti-Redness / Anti-Couperose Agents Market is growing?

Growth in the Anti-Redness / Anti-Couperose Agents Market is being fueled by rising demand for clinically validated solutions addressing sensitive and rosacea-prone skin conditions. Increasing prevalence of skin barrier concerns, combined with heightened consumer awareness of redness triggers such as pollution, stress, and climate fluctuations, has been driving consistent adoption by formulators.

Strong emphasis is being placed on actives that provide capillary and vasoprotection, with encapsulated systems enabling greater stability, controlled release, and reduced irritation risks. Botanical and biotechnology-derived inputs are being prioritized due to clean-label alignment and regulatory acceptance, strengthening their role in ingredient innovation.

Expanding dermocosmetic channels and the integration of these actives into serums, lotions, and gels have reinforced their position within skin care formulations. Competitive differentiation is expected to be achieved through sustainable sourcing, traceability, and proof-backed claims, ensuring that long-term growth is supported by both technological innovation and evolving consumer trust in sensitive-skin solutions.

Segmental Analysis

The Anti-Redness / Anti-Couperose Agents Market has been segmented based on mode of action, source, and delivery system to capture the underlying drivers of demand across the ingredient landscape. Each segment highlights the raw material strategies being prioritized by formulators and ingredient suppliers to address sensitive-skin and redness-prone concerns.

While mode of action determines the biological pathway targeted, the source of actives defines alignment with clean-label expectations and efficacy, and the delivery system dictates performance, stability, and consumer tolerance. Together, these segments shape competitive positioning, guide innovation priorities, and reveal where future value creation is most likely to occur within the formulation space.
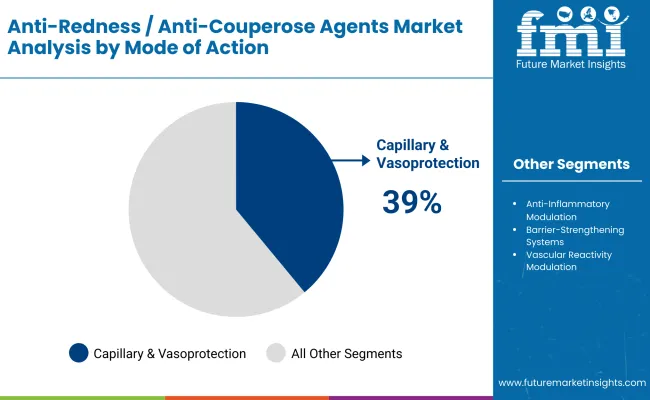
Insights into the Mode of Action Segment with Capillary & Vasoprotection Leading in Market Share

Anti Redness Anti Couperose Agents Market By Mode Of Action

Market Value Share, 2025 Mode of Action
Capillary & vasoprotection 39%
Others 61.0%

Capillary & vasoprotection held 39.0% share in 2025, valued at USD 588.9 Million, while others accounted for 61.0% at USD 905.0 Million. Mode of action is expected to remain a crucial determinant of demand in the Anti-Redness / Anti-Couperose Agents Market. Growth in vasoprotective actives is anticipated as formulators prioritize improved circulation, visible redness reduction, and barrier resilience in sensitive-skin applications.

Regulatory scrutiny of efficacy claims is expected to accelerate investment in clinical testing, strengthening the segment’s credibility. Broader adoption in leave-on creams, serums, and dermocosmetic platforms is likely to reinforce demand. The segment outlook suggests that vasoprotective actives will remain a strategic priority, supported by their clear link to consumer-perceived results.
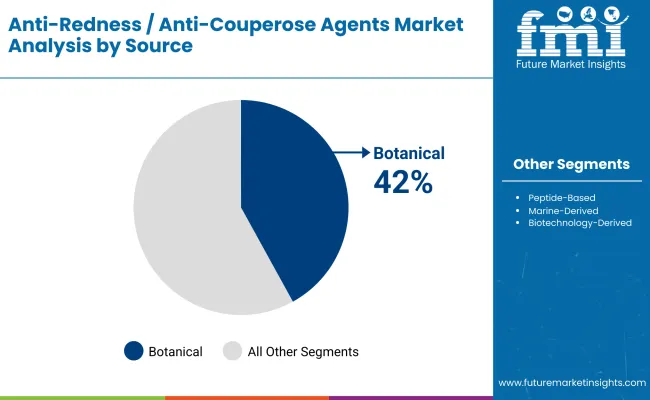
Insights into the Source Segment with Botanicals Holding Strong Position

Anti Redness Anti Couperose Agents Market By Source

Source Market Value Share, 2025
Botanical 42%
Others 58.0%

Botanical actives commanded 42.0% share in 2025 at USD 369 Million, compared to others with 58.0% share valued at USD 860.49 Million. Source-based segmentation highlights the growing influence of natural actives in driving formulation strategies. Botanical dominance is anticipated to continue due to consumer trust in plant-based actives and alignment with clean-label expectations.

Challenges around supply variability and extraction efficiency are expected to be mitigated through advances in cultivation partnerships and green chemistry. Increased demand for standardized potency and allergen-free profiles is projected to strengthen the role of botanical actives. Other sources are forecast to grow through innovation in peptides and biotech inputs, ensuring a balanced competitive environment.
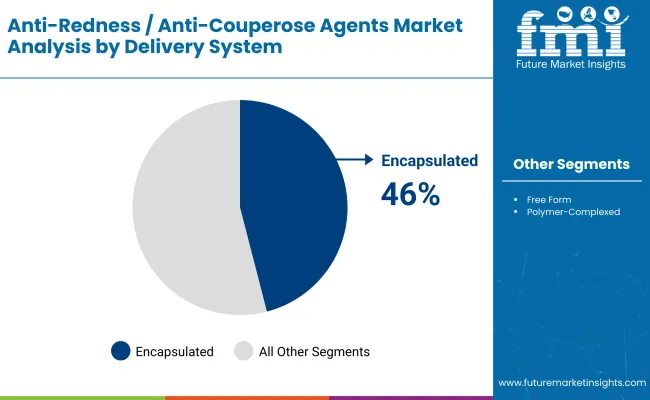
Insights into the Delivery System Segment with Encapsulation Emerging as Leader

Anti Redness Anti Couperose Agents Market Delivery System

Delivery System Market Value Share, 2025
Encapsulated 46%
Others 54.0%

Encapsulated delivery systems held 46.0% share in 2025 at USD 533.3 Million, while others accounted for 54.0% at USD 801.14 Million. Delivery systems are projected to play a central role in shaping adoption patterns across the Anti-Redness / Anti-Couperose Agents Market. Encapsulation is expected to gain traction due to its ability to protect actives, enable controlled release, and minimize irritation risks, which are critical in sensitive-skin applications. Advancements in lipid carriers and polymer-complexed systems are projected to further elevate performance, allowing higher stability and improved bioavailability.

The preference of formulators for encapsulated actives is anticipated to intensify as premium dermocosmetic products expand globally. Other delivery formats will remain relevant for cost-sensitive formulations, but premium growth is projected to be centered on encapsulated solutions.

What are the Drivers, Restraints, and Key Trends of the Anti-Redness / Anti-Couperose Agents Market?

Complexity in ingredient validation and raw material sustainability is reshaping the Anti-Redness / Anti-Couperose Agents Market, even as demand strengthens for clinically proven, skin-friendly actives designed to deliver measurable redness reduction and enhanced dermocosmetic performance across global formulations.

Clinical Validation as a Commercial Imperative

Scientific substantiation is being positioned as a core growth driver within the Anti-Redness / Anti-Couperose Agents Market. Regulatory bodies, dermatologists, and consumers increasingly demand proof of efficacy, compelling ingredient suppliers to invest heavily in standardized trials, in vivo studies, and bioassays. This shift elevates barriers to entry, but it simultaneously strengthens trust in suppliers able to demonstrate measurable outcomes in redness reduction, barrier reinforcement, and skin-calming activity.

Future adoption is expected to be concentrated on actives backed by verifiable data rather than marketing narratives. This dynamic is projected to elevate the value of partnerships between ingredient innovators, clinical testing labs, and dermocosmetic brands, while also embedding efficacy metrics into procurement decisions.

Encapsulation as a Differentiation Strategy

Encapsulation is being redefined as more than a delivery tool; it is now emerging as a platform for market differentiation. Controlled release, reduced irritation, and bioavailability enhancement are enabling formulators to meet both performance and safety expectations in sensitive-skin care. Suppliers with proprietary encapsulation technologies are expected to capture premium margins, as encapsulated actives provide not only improved functional performance but also intellectual property advantages that protect innovation.

The trend signals a transition from commoditized botanical extracts to technologically advanced systems, where value is created through integration of chemistry, material science, and dermatological validation. This is likely to shift competitive advantage toward suppliers with R&D depth and scalable encapsulation capabilities.
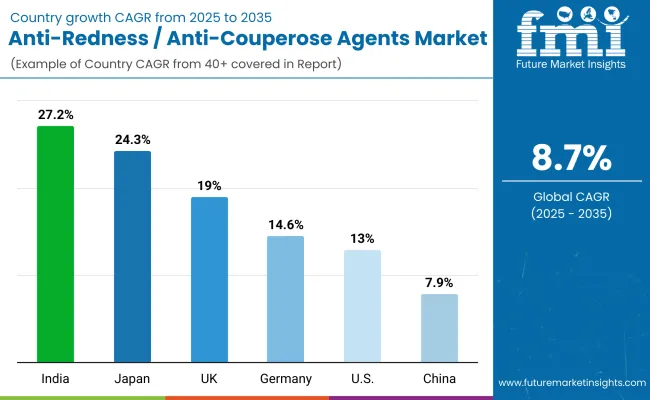
Analysis of Anti-Redness / Anti-Couperose Agents Market By Key Countries

Anti Redness Anti Couperose Agents Market Country Wise Analysis

Country CAGR
China 7.9%
USA 13.0%
India 27.2%
UK 19.0%
Germany 14.6%
Japan 24.3%

The Anti-Redness / Anti-Couperose Agents Market displays notable differences in growth trajectories across key countries, shaped by consumer sensitivity awareness, regulatory scrutiny, and the pace of dermocosmetic adoption. India is projected to emerge as the fastest-growing country with a CAGR of 27.2% between 2025 and 2035, reflecting rapid expansion of sensitive-skin care portfolios and heightened interest from global formulators in sourcing botanical actives.

Japan follows closely with a CAGR of 24.3%, supported by advanced cosmetic science, premium product positioning, and high dermatologist engagement. The UK is expected to sustain strong growth at 19.0%, where innovation in clinical-grade formulations aligns with consumer demand for performance-backed dermocosmetics.

Germany is projected at a CAGR of 14.6%, reinforced by strict efficacy and safety standards that elevate demand for clinically validated actives. The USA is expected to grow at 13.0%, reflecting significant opportunities in encapsulation and polymer-complexed systems that address consumer intolerance concerns.

Europe collectively is projected at 12.6% CAGR, with emphasis on sustainability, traceability, and green chemistry supporting demand for raw materials. China is anticipated to grow steadily at 7.9%, with regulatory frameworks focusing on compliance and safety influencing adoption speed. Overall, regional diversification underscores the global potential, with Asia expected to anchor future market acceleration.
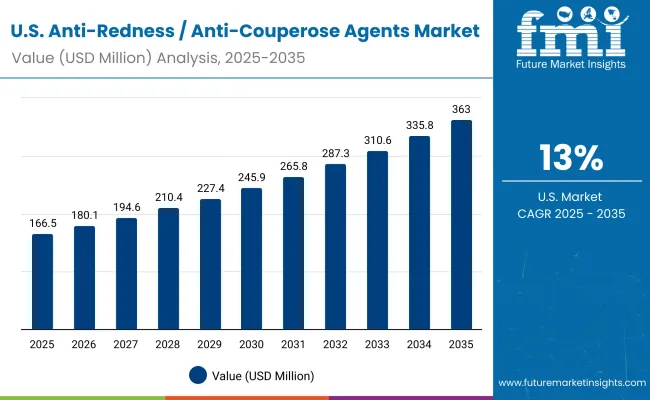
Sales Outlook for Anti-Redness / Anti-Couperose Agents in the United States

Usa Anti Redness Anti Couperose Agents Market

Year USA Anti-Redness / Anti-Couperose Agents Market (USD Million)
2025 166.59
2026 180.08
2027 194.67
2028 210.44
2029 227.49
2030 245.92
2031 265.84
2032 287.38
2033 310.66
2034 335.83
2035 363.04

A CAGR of 8.3% is projected for the Anti-Redness / Anti-Couperose Agents Market in the United States between 2025 and 2035, with market size expected to rise from USD 166.59 Million to USD 363.04 Million. Growth is anticipated to be driven by the integration of clinically validated redness-reducing actives in premium formulations, reinforced by dermatologist endorsements and expanding dermocosmetic channels.

Encapsulation and polymer-complexed delivery systems are being adopted to enhance stability, ensure controlled release, and reduce irritation risks, making them vital for sensitive-skin care innovation. Botanical actives with traceable sourcing are also being prioritized to align with clean-label positioning and evolving transparency requirements.

  • Encapsulated actives are being utilized to provide superior tolerability and performance in next-generation formulations.
  • Dermatologist engagement is reinforcing consumer confidence in vasoprotective and anti-inflammatory ingredients.
  • Traceable botanical inputs are being favored to comply with regulatory standards and clean-label expectations.

Growth and Expansion Outlook for Anti-Redness / Anti-Couperose Agents Market in the United Kingdom

A CAGR of 19.0% is projected for the Anti-Redness / Anti-Couperose Agents Market in the United Kingdom from 2025 to 2035. Market expansion is expected to be supported by strong adoption of dermocosmetic actives, shaped by clinical validation requirements and consumer preference for science-backed skin care.

Regulatory frameworks that emphasize product safety and allergen transparency are anticipated to strengthen demand for advanced redness-reducing ingredients. Encapsulation is projected to remain pivotal in enabling reduced irritation risk, while botanical actives are forecast to gain further momentum under clean-label and sustainability narratives.

  • Clinical-grade formulations are being prioritized to meet rising expectations of sensitive-skin consumers.
  • Encapsulation technologies are being integrated to enhance stability and tolerability.
  • Botanical inputs with verifiable traceability are being favored to align with sustainability commitments.
  • Premium positioning is being reinforced through dermatologist engagement and consumer trust in dermocosmetic brands.

Growth and Expansion Outlook for Anti-Redness / Anti-Couperose Agents Market in India

A CAGR of 27.2% is forecast for the Anti-Redness / Anti-Couperose Agents Market in India between 2025 and 2035, marking it as the fastest-growing country in this sector. Rapid expansion is expected as rising consumer awareness of skin sensitivity intersects with increased urban exposure to pollution and stress triggers. Ingredient suppliers are anticipated to benefit from a growing preference for botanically derived actives, supported by India’s strong heritage in plant-based wellness. Global formulators are projected to target India as a sourcing and consumption hub, reinforcing investments in standardized cultivation and local partnerships.

  • Botanicals are being positioned as the leading source for anti-redness actives due to cultural alignment.
  • Encapsulation is being explored to bring global-grade efficacy to local formulations.
  • Dermocosmetic adoption is being accelerated by dermatological awareness campaigns.
  • India is being positioned as both a demand center and sourcing base for botanical actives.

Sales Outlook for Anti-Redness / Anti-Couperose Agents in China

A CAGR of 7.9% is anticipated for the Anti-Redness / Anti-Couperose Agents Market in China over the period 2025 to 2035. Market growth is expected to be driven by the rising prevalence of sensitive skin conditions and increased regulatory focus on safety and compliance in cosmetic ingredients. Local brands are forecast to prioritize redness-reducing actives that combine efficacy with consumer trust in traditional botanical formulations. International suppliers are projected to strengthen collaborations with Chinese formulators, enabling localized innovation and faster regulatory alignment.
  • Botanical actives are being emphasized to resonate with consumer trust in natural remedies.
  • Compliance with China’s evolving cosmetic supervision norms is being positioned as a growth enabler.
  • Encapsulation technologies are being used to deliver premium stability and safety assurance.
  • Partnerships with local formulators are being pursued to accelerate ingredient penetration.

In-depth Analysis of Anti-Redness / Anti-Couperose Agents in Germany

Germany Anti Redness Anti Couperose Agents Market

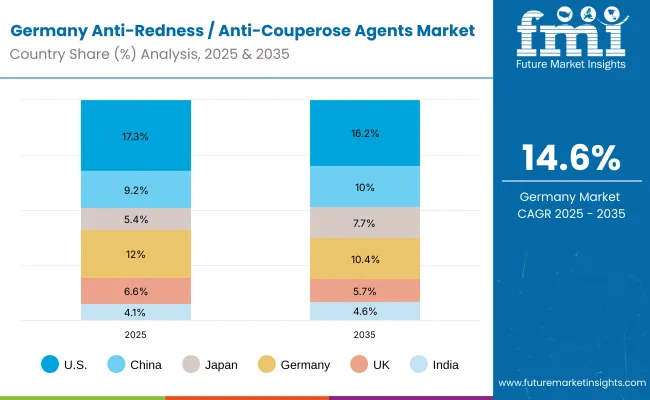
Country 2025
USA 17.3%
China 9.2%
Japan 5.4%
Germany 12.0%
UK 6.6%
India 4.1%
Country 2035
USA 16.2%
China 10.0%
Japan 7.7%
Germany 10.4%
UK 5.7%
India 4.6%

A CAGR of 14.6% is projected for the Anti-Redness / Anti-Couperose Agents Market in Germany from 2025 to 2035. Market expansion is expected to be strongly influenced by stringent regulatory frameworks that emphasize product safety, traceability, and proven efficacy. Demand is anticipated to be concentrated on actives backed by robust dermatological data, ensuring alignment with Germany’s clinically driven consumer base. Encapsulation and polymer-complexed delivery systems are projected to capture strong adoption in dermocosmetic applications. Sustainability expectations are also forecast to increase demand for green chemistry and traceable botanical sourcing.
  • Dermatological validation is being prioritized to strengthen ingredient adoption in premium formulations.
  • Encapsulation and advanced delivery technologies are being adopted to reinforce efficacy and safety.
  • Botanical actives with clean-label positioning are being integrated to meet consumer expectations.
  • Regulatory compliance is being positioned as a key driver of competitive differentiation.

Growth Outlook for Anti-Redness / Anti-Couperose Agents Market in USA

Usa Anti Redness Anti Couperose Agents Market By Mode Of Action

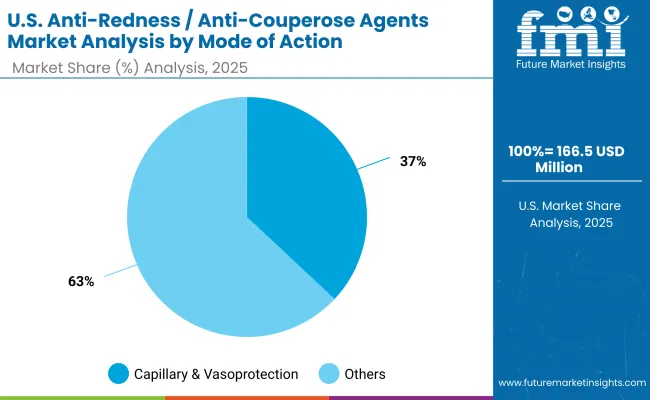
USA by Mode of Action Market Value Share, 2025
Capillary & vasoprotection 37%
Others 63.0%

The Anti-Redness / Anti-Couperose Agents Market in the United States is projected at USD 166.59 Million in 2025. Capillary & vasoprotection contributes 37% (USD 61.6 Million), while other mechanisms hold 63% (USD 104.95 Million), reflecting stronger adoption of multi-pathway redness control strategies.

This dominance of broader mechanisms stems from the complexity of sensitive-skin conditions, where anti-inflammatory, barrier-strengthening, and vascular modulation are often combined to achieve reliable outcomes.

Formulators are increasingly incorporating blended actives to deliver multi-functional performance, while vasoprotective agents are expected to retain importance due to their visible results on capillary resilience and flushing reduction. Competitive advantage is anticipated to be shaped by the ability of suppliers to integrate vasoprotective ingredients within encapsulated or polymer-complexed systems, ensuring higher tolerability in premium formulations.
  • USA market value is projected at USD 166.59 Million in 2025.
  • Capillary & vasoprotection holds 37% share, valued at USD 61.6 Million.
  • Broader mechanisms dominate at 63%, valued at USD 104.95 Million.
  • Growth is supported by multi-functional actives and encapsulated delivery platforms.

Opportunity Analysis of China Anti-Redness / Anti-Couperose Agents Market

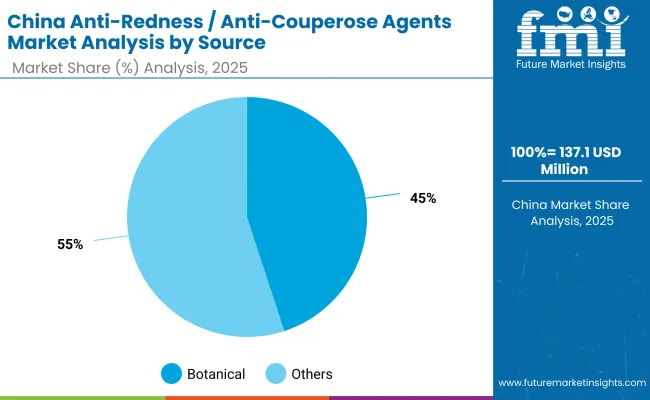
China Anti Redness Anti Couperose Agents Market By Source

China by source Market Value Share, 2025
Botanical 45%
Others 55.0%

The Anti-Redness / Anti-Couperose Agents Market in China is projected at USD 137.12 Million in 2025. Botanical actives contribute 45% (USD 61.7 Million), while other sources account for 55% (USD 75.42 Million), reflecting a balanced reliance on natural and synthetic raw materials. Botanical dominance is being reinforced by strong consumer trust in plant-based remedies and alignment with China’s heritage of traditional medicine, which resonates with sensitive-skin care.

At the same time, reliance on peptides, biotech-derived, and marine-sourced actives is being expanded to deliver stability, potency, and standardized efficacy. Formulators are expected to prioritize suppliers that ensure traceability, allergen-free profiles, and sustainable extraction. The competitive landscape is likely to shift toward ingredient providers capable of merging botanical familiarity with advanced delivery systems, enabling premium performance and regulatory compliance.
  • China’s market is valued at USD 137.12 Million in 2025.
  • Botanicals hold 45% share, equal to USD 61.7 Million.
  • Other sources dominate slightly at 55%, valued at USD 75.42 Million.
  • Growth is being supported by clean-label narratives and biotech-driven innovations.

Competitive Landscape of Anti-Redness / Anti-Couperose Agents Market

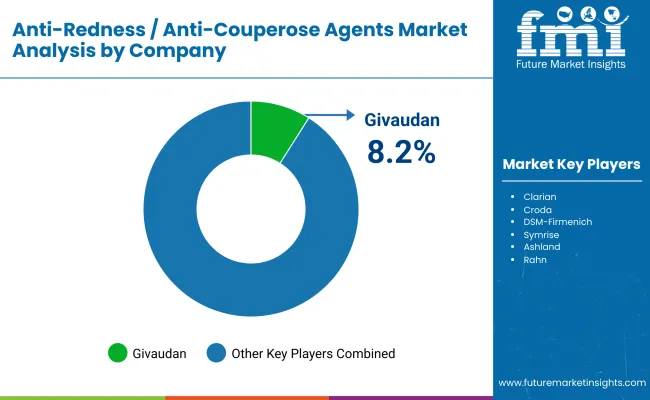
Anti Redness Anti Couperose Agents Market By Company

Company Global Value Share 2025
Givaudan 8.2%
Others 91.8%

The Anti-Redness / Anti-Couperose Agents Market is moderately fragmented, with global leaders, mid-sized innovators, and specialized suppliers competing for share across formulation-driven applications. Global ingredient majors such as Givaudan, Symrise, Croda, and DSM-Firmenich hold notable positions, supported by expansive R&D resources, robust botanical sourcing, and advanced encapsulation technologies. Their strategies are increasingly centered on clinical substantiation, transparent traceability, and sustainability commitments, which are being prioritized by dermocosmetic brands worldwide.

Established mid-sized players, including Ashland, Seppic, Clariant, Lucas Meyer, and Rahn, are focused on niche innovation by delivering multifunctional actives, polymer-complexed delivery systems, and region-specific formulations. These companies are leveraging expertise in sensitive-skin applications and strong regional networks to gain relevance in premium care formulations.

Specialized providers such as Greentech and other botanical-focused suppliers are emphasizing traceability, eco-friendly extraction, and biodiversity partnerships, ensuring alignment with clean-label consumer demand. Their strength lies in agility, customization, and responsiveness to evolving regional regulatory requirements.

Competitive differentiation is shifting from single-ingredient dominance toward integrated ingredient ecosystems that combine efficacy validation, green sourcing, and advanced delivery platforms. Future leadership is expected to favor suppliers capable of aligning innovation with transparent sustainability and clinically validated performance.

Key Developments in Anti-Redness / Anti-Couperose Agents Market

  • In March 2025, Givaudan Active Beauty introduced DandErase™, a botanical active derived from upcycled saffron petals, at In-Cosmetics Global. It was designed not only to reduce inflammation and erythema but also to restore barrier function and rebalance the skin microbiome.
  • In April 2025, at In-Cosmetics Global (Amsterdam), Givaudan unveiled Evernityl alongside DandErase™ and PrimalHyal UltraReverse, signaling a strategic push toward longevity, microbiome-friendly, and multi-benefit actives. Ingredient innovation with these launched molecules is expected to impact redness-soothing formulation demand.

Scope of the Report

Item Value
Market Size (2025) USD 1,483.6 Million
Market Forecast (2035) USD 3,402.3 Million
Growth Rate (2025 to 2035) CAGR 8.7%
Mode of Action Capillary & vasoprotection, Anti-inflammatory modulation, Barrier-strengthening systems, Vascular reactivity modulation
Source Botanical, Peptide-based, Biotechnology-derived, Marine-derived
Delivery System Free form, Encapsulated, Polymer-complexed
Physical Form Solution/concentrate, Powder, Dispersion
Application Leave-on creams & lotions, Serums & ampoules, Gels & essences
End-use Industry Sensitive skin care, Rosacea-prone care, Dermocosmetic
Regions Covered North America, Europe, Asia-Pacific, Latin America, Middle East & Africa
Countries Covered United States, China, India, Germany, United Kingdom, Japan
Key Companies Profiled Givaudan, Symrise, Croda, DSM-Firmenich, Ashland, Seppic, Clariant, Lucas Meyer, Rahn, Greentech
Additional Attributes Dollar sales by mode of action, source, and delivery system; adoption trends in dermocosmetics and sensitive-skin care; rising demand for encapsulated delivery; clean-label and traceability focus; segment-specific growth in serums and leave-on creams; sustainability and green chemistry initiatives; regulatory-driven efficacy validation; regional expansion in Asia and North America

Key Segments

By Mode of Action:

  • Capillary & vasoprotection
  • Anti-inflammatory modulation
  • Barrier-strengthening systems
  • Vascular reactivity modulation

By Source:

  • Botanical
  • Peptide-based
  • Biotechnology-derived
  • Marine-derived

By Delivery System:

  • Free form
  • Encapsulated
  • Polymer-complexed

By Physical Form:

  • Solution/concentrate
  • Powder
  • Dispersion

By Application:

  • Leave-on creams & lotions
  • Serums & ampoules
  • Gels & essences

By End Use:

  • Sensitive skin care
  • Rosacea-prone care
  • Dermocosmetic

By Region:

  • North America
  • Latin America
  • Europe
  • East Asia
  • South Asia & Pacific
  • Middle East and Africa

Frequently Asked Questions

How big is the Anti-Redness / Anti-Couperose Agents Market in 2025?

The global Anti-Redness / Anti-Couperose Agents Market is estimated to be valued at USD 1,483.6 Million in 2025.

What will be the size of the Anti-Redness / Anti-Couperose Agents Market in 2035?

The market size for the Anti-Redness / Anti-Couperose Agents Market is projected to reach USD 3,402.3 Million by 2035.

How much will be the Anti-Redness / Anti-Couperose Agents Market growth between 2025 and 2035?

The Anti-Redness / Anti-Couperose Agents Market is expected to grow at a CAGR of 8.7% between 2025 and 2035.

What are the key product types in the Anti-Redness / Anti-Couperose Agents Market?

The key product types in the Anti-Redness / Anti-Couperose Agents Market are capillary & vasoprotective actives, anti-inflammatory modulators, barrier-strengthening systems, and vascular reactivity modulators.

Which segment is expected to contribute significant share in the Anti-Redness / Anti-Couperose Agents Market in 2025?

In terms of delivery systems, encapsulated actives are expected to command 46% share in the Anti-Redness / Anti-Couperose Agents Market in 2025.

Table of Content

  1. Executive Summary
    • Global Market Outlook
    • Demand-side Trends
    • Supply-side Trends
    • Technology Roadmap Analysis
    • Analysis and Recommendations
  2. Market Overview
    • Market Coverage / Taxonomy
    • Market Definition / Scope / Limitations
  3. Market Background
    • Market Dynamics
      • Drivers
      • Restraints
      • Opportunity
      • Trends
    • Scenario Forecast
      • Demand in Optimistic Scenario
      • Demand in Likely Scenario
      • Demand in Conservative Scenario
    • Opportunity Map Analysis
    • Product Life Cycle Analysis
    • Supply Chain Analysis
      • Supply Side Participants and their Roles
        • Producers
        • Mid-Level Participants (Traders/ Agents/ Brokers)
        • Wholesalers and Distributors
      • Value Added and Value Created at Node in the Supply Chain
      • List of Raw Material Suppliers
      • List of Existing and Potential Buyer’s
    • Investment Feasibility Matrix
    • Value Chain Analysis
      • Profit Margin Analysis
      • Wholesalers and Distributors
      • Retailers
    • PESTLE and Porter’s Analysis
    • Regulatory Landscape
      • By Key Regions
      • By Key Countries
    • Regional Parent Market Outlook
    • Production and Consumption Statistics
    • Import and Export Statistics
  4. Global Market Analysis 2020 to 2024 and Forecast, 2025 to 2035
    • Historical Market Size Value (USD Million) & Volume (Units) Analysis, 2020 to 2024
    • Current and Future Market Size Value (USD Million) & Volume (Units) Projections, 2025 to 2035
      • Y-o-Y Growth Trend Analysis
      • Absolute $ Opportunity Analysis
  5. Global Market Analysis 2020 to 2024 and Forecast 2025 to 2035, By Mode of Action
    • Introduction / Key Findings
    • Historical Market Size Value (USD Million) & Volume (Units) Analysis By Mode of Action, 2020 to 2024
    • Current and Future Market Size Value (USD Million) & Volume (Units) Analysis and Forecast By Mode of Action, 2025 to 2035
      • Capillary & vasoprotection
      • Anti-inflammatory modulation
      • Barrier-strengthening systems
      • Vascular reactivity modulation
    • Y-o-Y Growth Trend Analysis By Mode of Action, 2020 to 2024
    • Absolute $ Opportunity Analysis By Mode of Action, 2025 to 2035
  6. Global Market Analysis 2020 to 2024 and Forecast 2025 to 2035, By Source
    • Introduction / Key Findings
    • Historical Market Size Value (USD Million) & Volume (Units) Analysis By Source, 2020 to 2024
    • Current and Future Market Size Value (USD Million) & Volume (Units) Analysis and Forecast By Source, 2025 to 2035
      • Botanical
      • Peptide-based
      • Biotechnology-derived
      • Marine-derived
    • Y-o-Y Growth Trend Analysis By Source, 2020 to 2024
    • Absolute $ Opportunity Analysis By Source, 2025 to 2035
  7. Global Market Analysis 2020 to 2024 and Forecast 2025 to 2035, By Delivery System
    • Introduction / Key Findings
    • Historical Market Size Value (USD Million) & Volume (Units) Analysis By Delivery System, 2020 to 2024
    • Current and Future Market Size Value (USD Million) & Volume (Units) Analysis and Forecast By Delivery System, 2025 to 2035
      • Free form
      • Encapsulated
      • Polymer-complexed
    • Y-o-Y Growth Trend Analysis By Delivery System, 2020 to 2024
    • Absolute $ Opportunity Analysis By Delivery System, 2025 to 2035
  8. Global Market Analysis 2020 to 2024 and Forecast 2025 to 2035, By Physical Form
    • Introduction / Key Findings
    • Historical Market Size Value (USD Million) & Volume (Units) Analysis By Physical Form, 2020 to 2024
    • Current and Future Market Size Value (USD Million) & Volume (Units) Analysis and Forecast By Physical Form, 2025 to 2035
      • Solution/concentrate
      • Powder
      • Dispersion
    • Y-o-Y Growth Trend Analysis By Physical Form, 2020 to 2024
    • Absolute $ Opportunity Analysis By Physical Form, 2025 to 2035
  9. Global Market Analysis 2020 to 2024 and Forecast 2025 to 2035, By Application
    • Introduction / Key Findings
    • Historical Market Size Value (USD Million) & Volume (Units) Analysis By Application, 2020 to 2024
    • Current and Future Market Size Value (USD Million) & Volume (Units) Analysis and Forecast By Application, 2025 to 2035
      • Leave-on creams & lotions
      • Serums & ampoules
      • Gels & essences
    • Y-o-Y Growth Trend Analysis By Application, 2020 to 2024
    • Absolute $ Opportunity Analysis By Application, 2025 to 2035
  10. Global Market Analysis 2020 to 2024 and Forecast 2025 to 2035, By End Use
    • Introduction / Key Findings
    • Historical Market Size Value (USD Million) & Volume (Units) Analysis By End Use, 2020 to 2024
    • Current and Future Market Size Value (USD Million) & Volume (Units) Analysis and Forecast By End Use, 2025 to 2035
      • Sensitive skin care
      • Rosacea-prone care
      • Dermocosmetic
    • Y-o-Y Growth Trend Analysis By End Use, 2020 to 2024
    • Absolute $ Opportunity Analysis By End Use, 2025 to 2035
  11. Global Market Analysis 2020 to 2024 and Forecast 2025 to 2035, By Region
    • Introduction
    • Historical Market Size Value (USD Million) & Volume (Units) Analysis By Region, 2020 to 2024
    • Current Market Size Value (USD Million) & Volume (Units) Analysis and Forecast By Region, 2025 to 2035
      • North America
      • Latin America
      • Europe
      • East Asia
      • South Asia & Pacific
      • Middle East and Africa
    • Market Attractiveness Analysis By Region
  12. North America Market Analysis 2020 to 2024 and Forecast 2025 to 2035, By Country
    • Historical Market Size Value (USD Million) & Volume (Units) Trend Analysis By Market Taxonomy, 2020 to 2024
    • Market Size Value (USD Million) & Volume (Units) Forecast By Market Taxonomy, 2025 to 2035
      • By Country
        • USA
        • Canada
      • By Mode of Action
      • By Source
      • By Delivery System
      • By Physical Form
      • By Application
      • By End Use
    • Market Attractiveness Analysis
      • By Country
      • By Mode of Action
      • By Source
      • By Delivery System
      • By Physical Form
      • By Application
      • By End Use
    • Key Takeaways
  13. Latin America Market Analysis 2020 to 2024 and Forecast 2025 to 2035, By Country
    • Historical Market Size Value (USD Million) & Volume (Units) Trend Analysis By Market Taxonomy, 2020 to 2024
    • Market Size Value (USD Million) & Volume (Units) Forecast By Market Taxonomy, 2025 to 2035
      • By Country
        • Brazil
        • Mexico
        • Colombia
        • Rest of Latin America
      • By Mode of Action
      • By Source
      • By Delivery System
      • By Physical Form
      • By Application
      • By End Use
    • Market Attractiveness Analysis
      • By Country
      • By Mode of Action
      • By Source
      • By Delivery System
      • By Physical Form
      • By Application
      • By End Use
    • Key Takeaways
  14. Europe Market Analysis 2020 to 2024 and Forecast 2025 to 2035, By Country
    • Historical Market Size Value (USD Million) & Volume (Units) Trend Analysis By Market Taxonomy, 2020 to 2024
    • Market Size Value (USD Million) & Volume (Units) Forecast By Market Taxonomy, 2025 to 2035
      • By Country
        • Germany
        • UK
        • France
        • Italy
        • Spain
        • Belgium
        • Netherlands
        • Nordic
        • Switzerland
        • Russia
        • Poland
        • Rest of Europe
      • By Mode of Action
      • By Source
      • By Delivery System
      • By Physical Form
      • By Application
      • By End Use
    • Market Attractiveness Analysis
      • By Country
      • By Mode of Action
      • By Source
      • By Delivery System
      • By Physical Form
      • By Application
      • By End Use
    • Key Takeaways
  15. East Asia Market Analysis 2020 to 2024 and Forecast 2025 to 2035, By Country
    • Historical Market Size Value (USD Million) & Volume (Units) Trend Analysis By Market Taxonomy, 2020 to 2024
    • Market Size Value (USD Million) & Volume (Units) Forecast By Market Taxonomy, 2025 to 2035
      • By Country
        • China
        • Japan
        • South Korea
      • By Mode of Action
      • By Source
      • By Delivery System
      • By Physical Form
      • By Application
      • By End Use
    • Market Attractiveness Analysis
      • By Country
      • By Mode of Action
      • By Source
      • By Delivery System
      • By Physical Form
      • By Application
      • By End Use
    • Key Takeaways
  16. South Asia & Pacific Market Analysis 2020 to 2024 and Forecast 2025 to 2035, By Country
    • Historical Market Size Value (USD Million) & Volume (Units) Trend Analysis By Market Taxonomy, 2020 to 2024
    • Market Size Value (USD Million) & Volume (Units) Forecast By Market Taxonomy, 2025 to 2035
      • By Country
        • India
        • Thailand
        • Malaysia
        • Indonesia
        • Singapore
        • Vietnam
        • Australia
        • New Zealand
        • Rest of South Asia
      • By Mode of Action
      • By Source
      • By Delivery System
      • By Physical Form
      • By Application
      • By End Use
    • Market Attractiveness Analysis
      • By Country
      • By Mode of Action
      • By Source
      • By Delivery System
      • By Physical Form
      • By Application
      • By End Use
    • Key Takeaways
  17. Middle East and Africa Market Analysis 2020 to 2024 and Forecast 2025 to 2035, By Country
    • Historical Market Size Value (USD Million) & Volume (Units) Trend Analysis By Market Taxonomy, 2020 to 2024
    • Market Size Value (USD Million) & Volume (Units) Forecast By Market Taxonomy, 2025 to 2035
      • By Country
        • Turkey
        • UAE
        • Saudi Arabia
        • Israel
        • Other GCC Countries
        • North Africa
        • South Africa
      • By Mode of Action
      • By Source
      • By Delivery System
      • By Physical Form
      • By Application
      • By End Use
    • Market Attractiveness Analysis
      • By Country
      • By Mode of Action
      • By Source
      • By Delivery System
      • By Physical Form
      • By Application
      • By End Use
    • Key Takeaways
  18. Key Countries Market Analysis
    • USA
      • Pricing Analysis
      • Market Share Analysis, 2024
        • By Mode of Action
        • By Source
        • By Delivery System
        • By Physical Form
        • By Application
        • By End Use
    • Canada
      • Pricing Analysis
      • Market Share Analysis, 2024
        • By Mode of Action
        • By Source
        • By Delivery System
        • By Physical Form
        • By Application
        • By End Use
    • Brazil
      • Pricing Analysis
      • Market Share Analysis, 2024
        • By Mode of Action
        • By Source
        • By Delivery System
        • By Physical Form
        • By Application
        • By End Use
    • Mexico
      • Pricing Analysis
      • Market Share Analysis, 2024
        • By Mode of Action
        • By Source
        • By Delivery System
        • By Physical Form
        • By Application
        • By End Use
    • Colombia
      • Pricing Analysis
      • Market Share Analysis, 2024
        • By Mode of Action
        • By Source
        • By Delivery System
        • By Physical Form
        • By Application
        • By End Use
    • Germany
      • Pricing Analysis
      • Market Share Analysis, 2024
        • By Mode of Action
        • By Source
        • By Delivery System
        • By Physical Form
        • By Application
        • By End Use
    • UK
      • Pricing Analysis
      • Market Share Analysis, 2024
        • By Mode of Action
        • By Source
        • By Delivery System
        • By Physical Form
        • By Application
        • By End Use
    • France
      • Pricing Analysis
      • Market Share Analysis, 2024
        • By Mode of Action
        • By Source
        • By Delivery System
        • By Physical Form
        • By Application
        • By End Use
    • Italy
      • Pricing Analysis
      • Market Share Analysis, 2024
        • By Mode of Action
        • By Source
        • By Delivery System
        • By Physical Form
        • By Application
        • By End Use
    • Spain
      • Pricing Analysis
      • Market Share Analysis, 2024
        • By Mode of Action
        • By Source
        • By Delivery System
        • By Physical Form
        • By Application
        • By End Use
    • Belgium
      • Pricing Analysis
      • Market Share Analysis, 2024
        • By Mode of Action
        • By Source
        • By Delivery System
        • By Physical Form
        • By Application
        • By End Use
    • Netherlands
      • Pricing Analysis
      • Market Share Analysis, 2024
        • By Mode of Action
        • By Source
        • By Delivery System
        • By Physical Form
        • By Application
        • By End Use
    • Nordic
      • Pricing Analysis
      • Market Share Analysis, 2024
        • By Mode of Action
        • By Source
        • By Delivery System
        • By Physical Form
        • By Application
        • By End Use
    • Switzerland
      • Pricing Analysis
      • Market Share Analysis, 2024
        • By Mode of Action
        • By Source
        • By Delivery System
        • By Physical Form
        • By Application
        • By End Use
    • Russia
      • Pricing Analysis
      • Market Share Analysis, 2024
        • By Mode of Action
        • By Source
        • By Delivery System
        • By Physical Form
        • By Application
        • By End Use
    • Poland
      • Pricing Analysis
      • Market Share Analysis, 2024
        • By Mode of Action
        • By Source
        • By Delivery System
        • By Physical Form
        • By Application
        • By End Use
    • China
      • Pricing Analysis
      • Market Share Analysis, 2024
        • By Mode of Action
        • By Source
        • By Delivery System
        • By Physical Form
        • By Application
        • By End Use
    • Japan
      • Pricing Analysis
      • Market Share Analysis, 2024
        • By Mode of Action
        • By Source
        • By Delivery System
        • By Physical Form
        • By Application
        • By End Use
    • South Korea
      • Pricing Analysis
      • Market Share Analysis, 2024
        • By Mode of Action
        • By Source
        • By Delivery System
        • By Physical Form
        • By Application
        • By End Use
    • India
      • Pricing Analysis
      • Market Share Analysis, 2024
        • By Mode of Action
        • By Source
        • By Delivery System
        • By Physical Form
        • By Application
        • By End Use
    • Thailand
      • Pricing Analysis
      • Market Share Analysis, 2024
        • By Mode of Action
        • By Source
        • By Delivery System
        • By Physical Form
        • By Application
        • By End Use
    • Indonesia
      • Pricing Analysis
      • Market Share Analysis, 2024
        • By Mode of Action
        • By Source
        • By Delivery System
        • By Physical Form
        • By Application
        • By End Use
    • Australia
      • Pricing Analysis
      • Market Share Analysis, 2024
        • By Mode of Action
        • By Source
        • By Delivery System
        • By Physical Form
        • By Application
        • By End Use
    • New Zealand
      • Pricing Analysis
      • Market Share Analysis, 2024
        • By Mode of Action
        • By Source
        • By Delivery System
        • By Physical Form
        • By Application
        • By End Use
    • Turkey
      • Pricing Analysis
      • Market Share Analysis, 2024
        • By Mode of Action
        • By Source
        • By Delivery System
        • By Physical Form
        • By Application
        • By End Use
    • UAE
      • Pricing Analysis
      • Market Share Analysis, 2024
        • By Mode of Action
        • By Source
        • By Delivery System
        • By Physical Form
        • By Application
        • By End Use
    • Saudi Arabia
      • Pricing Analysis
      • Market Share Analysis, 2024
        • By Mode of Action
        • By Source
        • By Delivery System
        • By Physical Form
        • By Application
        • By End Use
    • Israel
      • Pricing Analysis
      • Market Share Analysis, 2024
        • By Mode of Action
        • By Source
        • By Delivery System
        • By Physical Form
        • By Application
        • By End Use
    • North Africa
      • Pricing Analysis
      • Market Share Analysis, 2024
        • By Mode of Action
        • By Source
        • By Delivery System
        • By Physical Form
        • By Application
        • By End Use
    • South Africa
      • Pricing Analysis
      • Market Share Analysis, 2024
        • By Mode of Action
        • By Source
        • By Delivery System
        • By Physical Form
        • By Application
        • By End Use
  19. Market Structure Analysis
    • Competition Dashboard
    • Competition Benchmarking
    • Market Share Analysis of Top Players
      • By Regional
      • By Mode of Action
      • By Source
      • By Delivery System
      • By Physical Form
      • By Application
      • By End Use
  20. Competition Analysis
    • Competition Deep Dive
      • Givaudan
        • Overview
        • Product Portfolio
        • Profitability by Market Segments (Product/Age /Sales Channel/Region)
        • Sales Footprint
        • Strategy Overview
          • Marketing Strategy
          • Product Strategy
          • Channel Strategy
      • Symrise
        • Overview
        • Product Portfolio
        • Profitability by Market Segments (Product/Age /Sales Channel/Region)
        • Sales Footprint
        • Strategy Overview
          • Marketing Strategy
          • Product Strategy
          • Channel Strategy
      • Croda
        • Overview
        • Product Portfolio
        • Profitability by Market Segments (Product/Age /Sales Channel/Region)
        • Sales Footprint
        • Strategy Overview
          • Marketing Strategy
          • Product Strategy
          • Channel Strategy
      • DSM-Firmenich
        • Overview
        • Product Portfolio
        • Profitability by Market Segments (Product/Age /Sales Channel/Region)
        • Sales Footprint
        • Strategy Overview
          • Marketing Strategy
          • Product Strategy
          • Channel Strategy
      • Ashland
        • Overview
        • Product Portfolio
        • Profitability by Market Segments (Product/Age /Sales Channel/Region)
        • Sales Footprint
        • Strategy Overview
          • Marketing Strategy
          • Product Strategy
          • Channel Strategy
      • Seppic
        • Overview
        • Product Portfolio
        • Profitability by Market Segments (Product/Age /Sales Channel/Region)
        • Sales Footprint
        • Strategy Overview
          • Marketing Strategy
          • Product Strategy
          • Channel Strategy
      • Clariant
        • Overview
        • Product Portfolio
        • Profitability by Market Segments (Product/Age /Sales Channel/Region)
        • Sales Footprint
        • Strategy Overview
          • Marketing Strategy
          • Product Strategy
          • Channel Strategy
      • Lucas Meyer
        • Overview
        • Product Portfolio
        • Profitability by Market Segments (Product/Age /Sales Channel/Region)
        • Sales Footprint
        • Strategy Overview
          • Marketing Strategy
          • Product Strategy
          • Channel Strategy
      • Rahn
        • Overview
        • Product Portfolio
        • Profitability by Market Segments (Product/Age /Sales Channel/Region)
        • Sales Footprint
        • Strategy Overview
          • Marketing Strategy
          • Product Strategy
          • Channel Strategy
      • Greentech
        • Overview
        • Product Portfolio
        • Profitability by Market Segments (Product/Age /Sales Channel/Region)
        • Sales Footprint
        • Strategy Overview
          • Marketing Strategy
          • Product Strategy
          • Channel Strategy
      • Others
        • Overview
        • Product Portfolio
        • Profitability by Market Segments (Product/Age /Sales Channel/Region)
        • Sales Footprint
        • Strategy Overview
          • Marketing Strategy
          • Product Strategy
          • Channel Strategy
  21. Assumptions & Acronyms Used
  22. Research Methodology

List of Tables

  • Table 1: Global Market Value (USD Million) Forecast by Region, 2020-2035
  • Table 2: Global Market Volume (Units) Forecast by Region, 2020-2035
  • Table 3: Global Market Value (USD Million) Forecast by Mode of Action, 2020-2035
  • Table 4: Global Market Volume (Units) Forecast by Mode of Action, 2020-2035
  • Table 5: Global Market Value (USD Million) Forecast by Source, 2020-2035
  • Table 6: Global Market Volume (Units) Forecast by Source, 2020-2035
  • Table 7: Global Market Value (USD Million) Forecast by Delivery System, 2020-2035
  • Table 8: Global Market Volume (Units) Forecast by Delivery System, 2020-2035
  • Table 9: Global Market Value (USD Million) Forecast by Physical Form, 2020-2035
  • Table 10: Global Market Volume (Units) Forecast by Physical Form, 2020-2035
  • Table 11: Global Market Value (USD Million) Forecast by Application, 2020-2035
  • Table 12: Global Market Volume (Units) Forecast by Application, 2020-2035
  • Table 13: Global Market Value (USD Million) Forecast by End Use, 2020-2035
  • Table 14: Global Market Volume (Units) Forecast by End Use, 2020-2035
  • Table 15: North America Market Value (USD Million) Forecast by Country, 2020-2035
  • Table 16: North America Market Volume (Units) Forecast by Country, 2020-2035
  • Table 17: North America Market Value (USD Million) Forecast by Mode of Action, 2020-2035
  • Table 18: North America Market Volume (Units) Forecast by Mode of Action, 2020-2035
  • Table 19: North America Market Value (USD Million) Forecast by Source, 2020-2035
  • Table 20: North America Market Volume (Units) Forecast by Source, 2020-2035
  • Table 21: North America Market Value (USD Million) Forecast by Delivery System, 2020-2035
  • Table 22: North America Market Volume (Units) Forecast by Delivery System, 2020-2035
  • Table 23: North America Market Value (USD Million) Forecast by Physical Form, 2020-2035
  • Table 24: North America Market Volume (Units) Forecast by Physical Form, 2020-2035
  • Table 25: North America Market Value (USD Million) Forecast by Application, 2020-2035
  • Table 26: North America Market Volume (Units) Forecast by Application, 2020-2035
  • Table 27: North America Market Value (USD Million) Forecast by End Use, 2020-2035
  • Table 28: North America Market Volume (Units) Forecast by End Use, 2020-2035
  • Table 29: Latin America Market Value (USD Million) Forecast by Country, 2020-2035
  • Table 30: Latin America Market Volume (Units) Forecast by Country, 2020-2035
  • Table 31: Latin America Market Value (USD Million) Forecast by Mode of Action, 2020-2035
  • Table 32: Latin America Market Volume (Units) Forecast by Mode of Action, 2020-2035
  • Table 33: Latin America Market Value (USD Million) Forecast by Source, 2020-2035
  • Table 34: Latin America Market Volume (Units) Forecast by Source, 2020-2035
  • Table 35: Latin America Market Value (USD Million) Forecast by Delivery System, 2020-2035
  • Table 36: Latin America Market Volume (Units) Forecast by Delivery System, 2020-2035
  • Table 37: Latin America Market Value (USD Million) Forecast by Physical Form, 2020-2035
  • Table 38: Latin America Market Volume (Units) Forecast by Physical Form, 2020-2035
  • Table 39: Latin America Market Value (USD Million) Forecast by Application, 2020-2035
  • Table 40: Latin America Market Volume (Units) Forecast by Application, 2020-2035
  • Table 41: Latin America Market Value (USD Million) Forecast by End Use, 2020-2035
  • Table 42: Latin America Market Volume (Units) Forecast by End Use, 2020-2035
  • Table 43: Europe Market Value (USD Million) Forecast by Country, 2020-2035
  • Table 44: Europe Market Volume (Units) Forecast by Country, 2020-2035
  • Table 45: Europe Market Value (USD Million) Forecast by Mode of Action, 2020-2035
  • Table 46: Europe Market Volume (Units) Forecast by Mode of Action, 2020-2035
  • Table 47: Europe Market Value (USD Million) Forecast by Source, 2020-2035
  • Table 48: Europe Market Volume (Units) Forecast by Source, 2020-2035
  • Table 49: Europe Market Value (USD Million) Forecast by Delivery System, 2020-2035
  • Table 50: Europe Market Volume (Units) Forecast by Delivery System, 2020-2035
  • Table 51: Europe Market Value (USD Million) Forecast by Physical Form, 2020-2035
  • Table 52: Europe Market Volume (Units) Forecast by Physical Form, 2020-2035
  • Table 53: Europe Market Value (USD Million) Forecast by Application, 2020-2035
  • Table 54: Europe Market Volume (Units) Forecast by Application, 2020-2035
  • Table 55: Europe Market Value (USD Million) Forecast by End Use, 2020-2035
  • Table 56: Europe Market Volume (Units) Forecast by End Use, 2020-2035
  • Table 57: East Asia Market Value (USD Million) Forecast by Country, 2020-2035
  • Table 58: East Asia Market Volume (Units) Forecast by Country, 2020-2035
  • Table 59: East Asia Market Value (USD Million) Forecast by Mode of Action, 2020-2035
  • Table 60: East Asia Market Volume (Units) Forecast by Mode of Action, 2020-2035
  • Table 61: East Asia Market Value (USD Million) Forecast by Source, 2020-2035
  • Table 62: East Asia Market Volume (Units) Forecast by Source, 2020-2035
  • Table 63: East Asia Market Value (USD Million) Forecast by Delivery System, 2020-2035
  • Table 64: East Asia Market Volume (Units) Forecast by Delivery System, 2020-2035
  • Table 65: East Asia Market Value (USD Million) Forecast by Physical Form, 2020-2035
  • Table 66: East Asia Market Volume (Units) Forecast by Physical Form, 2020-2035
  • Table 67: East Asia Market Value (USD Million) Forecast by Application, 2020-2035
  • Table 68: East Asia Market Volume (Units) Forecast by Application, 2020-2035
  • Table 69: East Asia Market Value (USD Million) Forecast by End Use, 2020-2035
  • Table 70: East Asia Market Volume (Units) Forecast by End Use, 2020-2035
  • Table 71: South Asia & Pacific Market Value (USD Million) Forecast by Country, 2020-2035
  • Table 72: South Asia & Pacific Market Volume (Units) Forecast by Country, 2020-2035
  • Table 73: South Asia & Pacific Market Value (USD Million) Forecast by Mode of Action, 2020-2035
  • Table 74: South Asia & Pacific Market Volume (Units) Forecast by Mode of Action, 2020-2035
  • Table 75: South Asia & Pacific Market Value (USD Million) Forecast by Source, 2020-2035
  • Table 76: South Asia & Pacific Market Volume (Units) Forecast by Source, 2020-2035
  • Table 77: South Asia & Pacific Market Value (USD Million) Forecast by Delivery System, 2020-2035
  • Table 78: South Asia & Pacific Market Volume (Units) Forecast by Delivery System, 2020-2035
  • Table 79: South Asia & Pacific Market Value (USD Million) Forecast by Physical Form, 2020-2035
  • Table 80: South Asia & Pacific Market Volume (Units) Forecast by Physical Form, 2020-2035
  • Table 81: South Asia & Pacific Market Value (USD Million) Forecast by Application, 2020-2035
  • Table 82: South Asia & Pacific Market Volume (Units) Forecast by Application, 2020-2035
  • Table 83: South Asia & Pacific Market Value (USD Million) Forecast by End Use, 2020-2035
  • Table 84: South Asia & Pacific Market Volume (Units) Forecast by End Use, 2020-2035
  • Table 85: Middle East and Africa Market Value (USD Million) Forecast by Country, 2020-2035
  • Table 86: Middle East and Africa Market Volume (Units) Forecast by Country, 2020-2035
  • Table 87: Middle East and Africa Market Value (USD Million) Forecast by Mode of Action, 2020-2035
  • Table 88: Middle East and Africa Market Volume (Units) Forecast by Mode of Action, 2020-2035
  • Table 89: Middle East and Africa Market Value (USD Million) Forecast by Source, 2020-2035
  • Table 90: Middle East and Africa Market Volume (Units) Forecast by Source, 2020-2035
  • Table 91: Middle East and Africa Market Value (USD Million) Forecast by Delivery System, 2020-2035
  • Table 92: Middle East and Africa Market Volume (Units) Forecast by Delivery System, 2020-2035
  • Table 93: Middle East and Africa Market Value (USD Million) Forecast by Physical Form, 2020-2035
  • Table 94: Middle East and Africa Market Volume (Units) Forecast by Physical Form, 2020-2035
  • Table 95: Middle East and Africa Market Value (USD Million) Forecast by Application, 2020-2035
  • Table 96: Middle East and Africa Market Volume (Units) Forecast by Application, 2020-2035
  • Table 97: Middle East and Africa Market Value (USD Million) Forecast by End Use, 2020-2035
  • Table 98: Middle East and Africa Market Volume (Units) Forecast by End Use, 2020-2035

List of Figures

  • Figure 1: Global Market Value (USD Million) by Mode of Action, 2025-2035
  • Figure 2: Global Market Value (USD Million) by Source, 2025-2035
  • Figure 3: Global Market Value (USD Million) by Delivery System, 2025-2035
  • Figure 4: Global Market Value (USD Million) by Physical Form, 2025-2035
  • Figure 5: Global Market Value (USD Million) by Application, 2025-2035
  • Figure 6: Global Market Value (USD Million) by End Use, 2025-2035
  • Figure 7: Global Market Value (USD Million) by Region, 2025-2035
  • Figure 8: Global Market Value (USD Million) Analysis by Region, 2020-2035
  • Figure 9: Global Market Volume (Units) Analysis by Region, 2020-2035
  • Figure 10: Global Market Value Share (%) and BPS Analysis by Region, 2025-2035
  • Figure 11: Global Market Y-o-Y Growth (%) Projections by Region, 2025-2035
  • Figure 12: Global Market Value (USD Million) Analysis by Mode of Action, 2020-2035
  • Figure 13: Global Market Volume (Units) Analysis by Mode of Action, 2020-2035
  • Figure 14: Global Market Value Share (%) and BPS Analysis by Mode of Action, 2025-2035
  • Figure 15: Global Market Y-o-Y Growth (%) Projections by Mode of Action, 2025-2035
  • Figure 16: Global Market Value (USD Million) Analysis by Source, 2020-2035
  • Figure 17: Global Market Volume (Units) Analysis by Source, 2020-2035
  • Figure 18: Global Market Value Share (%) and BPS Analysis by Source, 2025-2035
  • Figure 19: Global Market Y-o-Y Growth (%) Projections by Source, 2025-2035
  • Figure 20: Global Market Value (USD Million) Analysis by Delivery System, 2020-2035
  • Figure 21: Global Market Volume (Units) Analysis by Delivery System, 2020-2035
  • Figure 22: Global Market Value Share (%) and BPS Analysis by Delivery System, 2025-2035
  • Figure 23: Global Market Y-o-Y Growth (%) Projections by Delivery System, 2025-2035
  • Figure 24: Global Market Value (USD Million) Analysis by Physical Form, 2020-2035
  • Figure 25: Global Market Volume (Units) Analysis by Physical Form, 2020-2035
  • Figure 26: Global Market Value Share (%) and BPS Analysis by Physical Form, 2025-2035
  • Figure 27: Global Market Y-o-Y Growth (%) Projections by Physical Form, 2025-2035
  • Figure 28: Global Market Value (USD Million) Analysis by Application, 2020-2035
  • Figure 29: Global Market Volume (Units) Analysis by Application, 2020-2035
  • Figure 30: Global Market Value Share (%) and BPS Analysis by Application, 2025-2035
  • Figure 31: Global Market Y-o-Y Growth (%) Projections by Application, 2025-2035
  • Figure 32: Global Market Value (USD Million) Analysis by End Use, 2020-2035
  • Figure 33: Global Market Volume (Units) Analysis by End Use, 2020-2035
  • Figure 34: Global Market Value Share (%) and BPS Analysis by End Use, 2025-2035
  • Figure 35: Global Market Y-o-Y Growth (%) Projections by End Use, 2025-2035
  • Figure 36: Global Market Attractiveness by Mode of Action, 2025-2035
  • Figure 37: Global Market Attractiveness by Source, 2025-2035
  • Figure 38: Global Market Attractiveness by Delivery System, 2025-2035
  • Figure 39: Global Market Attractiveness by Physical Form, 2025-2035
  • Figure 40: Global Market Attractiveness by Application, 2025-2035
  • Figure 41: Global Market Attractiveness by End Use, 2025-2035
  • Figure 42: Global Market Attractiveness by Region, 2025-2035
  • Figure 43: North America Market Value (USD Million) by Mode of Action, 2025-2035
  • Figure 44: North America Market Value (USD Million) by Source, 2025-2035
  • Figure 45: North America Market Value (USD Million) by Delivery System, 2025-2035
  • Figure 46: North America Market Value (USD Million) by Physical Form, 2025-2035
  • Figure 47: North America Market Value (USD Million) by Application, 2025-2035
  • Figure 48: North America Market Value (USD Million) by End Use, 2025-2035
  • Figure 49: North America Market Value (USD Million) by Country, 2025-2035
  • Figure 50: North America Market Value (USD Million) Analysis by Country, 2020-2035
  • Figure 51: North America Market Volume (Units) Analysis by Country, 2020-2035
  • Figure 52: North America Market Value Share (%) and BPS Analysis by Country, 2025-2035
  • Figure 53: North America Market Y-o-Y Growth (%) Projections by Country, 2025-2035
  • Figure 54: North America Market Value (USD Million) Analysis by Mode of Action, 2020-2035
  • Figure 55: North America Market Volume (Units) Analysis by Mode of Action, 2020-2035
  • Figure 56: North America Market Value Share (%) and BPS Analysis by Mode of Action, 2025-2035
  • Figure 57: North America Market Y-o-Y Growth (%) Projections by Mode of Action, 2025-2035
  • Figure 58: North America Market Value (USD Million) Analysis by Source, 2020-2035
  • Figure 59: North America Market Volume (Units) Analysis by Source, 2020-2035
  • Figure 60: North America Market Value Share (%) and BPS Analysis by Source, 2025-2035
  • Figure 61: North America Market Y-o-Y Growth (%) Projections by Source, 2025-2035
  • Figure 62: North America Market Value (USD Million) Analysis by Delivery System, 2020-2035
  • Figure 63: North America Market Volume (Units) Analysis by Delivery System, 2020-2035
  • Figure 64: North America Market Value Share (%) and BPS Analysis by Delivery System, 2025-2035
  • Figure 65: North America Market Y-o-Y Growth (%) Projections by Delivery System, 2025-2035
  • Figure 66: North America Market Value (USD Million) Analysis by Physical Form, 2020-2035
  • Figure 67: North America Market Volume (Units) Analysis by Physical Form, 2020-2035
  • Figure 68: North America Market Value Share (%) and BPS Analysis by Physical Form, 2025-2035
  • Figure 69: North America Market Y-o-Y Growth (%) Projections by Physical Form, 2025-2035
  • Figure 70: North America Market Value (USD Million) Analysis by Application, 2020-2035
  • Figure 71: North America Market Volume (Units) Analysis by Application, 2020-2035
  • Figure 72: North America Market Value Share (%) and BPS Analysis by Application, 2025-2035
  • Figure 73: North America Market Y-o-Y Growth (%) Projections by Application, 2025-2035
  • Figure 74: North America Market Value (USD Million) Analysis by End Use, 2020-2035
  • Figure 75: North America Market Volume (Units) Analysis by End Use, 2020-2035
  • Figure 76: North America Market Value Share (%) and BPS Analysis by End Use, 2025-2035
  • Figure 77: North America Market Y-o-Y Growth (%) Projections by End Use, 2025-2035
  • Figure 78: North America Market Attractiveness by Mode of Action, 2025-2035
  • Figure 79: North America Market Attractiveness by Source, 2025-2035
  • Figure 80: North America Market Attractiveness by Delivery System, 2025-2035
  • Figure 81: North America Market Attractiveness by Physical Form, 2025-2035
  • Figure 82: North America Market Attractiveness by Application, 2025-2035
  • Figure 83: North America Market Attractiveness by End Use, 2025-2035
  • Figure 84: North America Market Attractiveness by Country, 2025-2035
  • Figure 85: Latin America Market Value (USD Million) by Mode of Action, 2025-2035
  • Figure 86: Latin America Market Value (USD Million) by Source, 2025-2035
  • Figure 87: Latin America Market Value (USD Million) by Delivery System, 2025-2035
  • Figure 88: Latin America Market Value (USD Million) by Physical Form, 2025-2035
  • Figure 89: Latin America Market Value (USD Million) by Application, 2025-2035
  • Figure 90: Latin America Market Value (USD Million) by End Use, 2025-2035
  • Figure 91: Latin America Market Value (USD Million) by Country, 2025-2035
  • Figure 92: Latin America Market Value (USD Million) Analysis by Country, 2020-2035
  • Figure 93: Latin America Market Volume (Units) Analysis by Country, 2020-2035
  • Figure 94: Latin America Market Value Share (%) and BPS Analysis by Country, 2025-2035
  • Figure 95: Latin America Market Y-o-Y Growth (%) Projections by Country, 2025-2035
  • Figure 96: Latin America Market Value (USD Million) Analysis by Mode of Action, 2020-2035
  • Figure 97: Latin America Market Volume (Units) Analysis by Mode of Action, 2020-2035
  • Figure 98: Latin America Market Value Share (%) and BPS Analysis by Mode of Action, 2025-2035
  • Figure 99: Latin America Market Y-o-Y Growth (%) Projections by Mode of Action, 2025-2035
  • Figure 100: Latin America Market Value (USD Million) Analysis by Source, 2020-2035
  • Figure 101: Latin America Market Volume (Units) Analysis by Source, 2020-2035
  • Figure 102: Latin America Market Value Share (%) and BPS Analysis by Source, 2025-2035
  • Figure 103: Latin America Market Y-o-Y Growth (%) Projections by Source, 2025-2035
  • Figure 104: Latin America Market Value (USD Million) Analysis by Delivery System, 2020-2035
  • Figure 105: Latin America Market Volume (Units) Analysis by Delivery System, 2020-2035
  • Figure 106: Latin America Market Value Share (%) and BPS Analysis by Delivery System, 2025-2035
  • Figure 107: Latin America Market Y-o-Y Growth (%) Projections by Delivery System, 2025-2035
  • Figure 108: Latin America Market Value (USD Million) Analysis by Physical Form, 2020-2035
  • Figure 109: Latin America Market Volume (Units) Analysis by Physical Form, 2020-2035
  • Figure 110: Latin America Market Value Share (%) and BPS Analysis by Physical Form, 2025-2035
  • Figure 111: Latin America Market Y-o-Y Growth (%) Projections by Physical Form, 2025-2035
  • Figure 112: Latin America Market Value (USD Million) Analysis by Application, 2020-2035
  • Figure 113: Latin America Market Volume (Units) Analysis by Application, 2020-2035
  • Figure 114: Latin America Market Value Share (%) and BPS Analysis by Application, 2025-2035
  • Figure 115: Latin America Market Y-o-Y Growth (%) Projections by Application, 2025-2035
  • Figure 116: Latin America Market Value (USD Million) Analysis by End Use, 2020-2035
  • Figure 117: Latin America Market Volume (Units) Analysis by End Use, 2020-2035
  • Figure 118: Latin America Market Value Share (%) and BPS Analysis by End Use, 2025-2035
  • Figure 119: Latin America Market Y-o-Y Growth (%) Projections by End Use, 2025-2035
  • Figure 120: Latin America Market Attractiveness by Mode of Action, 2025-2035
  • Figure 121: Latin America Market Attractiveness by Source, 2025-2035
  • Figure 122: Latin America Market Attractiveness by Delivery System, 2025-2035
  • Figure 123: Latin America Market Attractiveness by Physical Form, 2025-2035
  • Figure 124: Latin America Market Attractiveness by Application, 2025-2035
  • Figure 125: Latin America Market Attractiveness by End Use, 2025-2035
  • Figure 126: Latin America Market Attractiveness by Country, 2025-2035
  • Figure 127: Europe Market Value (USD Million) by Mode of Action, 2025-2035
  • Figure 128: Europe Market Value (USD Million) by Source, 2025-2035
  • Figure 129: Europe Market Value (USD Million) by Delivery System, 2025-2035
  • Figure 130: Europe Market Value (USD Million) by Physical Form, 2025-2035
  • Figure 131: Europe Market Value (USD Million) by Application, 2025-2035
  • Figure 132: Europe Market Value (USD Million) by End Use, 2025-2035
  • Figure 133: Europe Market Value (USD Million) by Country, 2025-2035
  • Figure 134: Europe Market Value (USD Million) Analysis by Country, 2020-2035
  • Figure 135: Europe Market Volume (Units) Analysis by Country, 2020-2035
  • Figure 136: Europe Market Value Share (%) and BPS Analysis by Country, 2025-2035
  • Figure 137: Europe Market Y-o-Y Growth (%) Projections by Country, 2025-2035
  • Figure 138: Europe Market Value (USD Million) Analysis by Mode of Action, 2020-2035
  • Figure 139: Europe Market Volume (Units) Analysis by Mode of Action, 2020-2035
  • Figure 140: Europe Market Value Share (%) and BPS Analysis by Mode of Action, 2025-2035
  • Figure 141: Europe Market Y-o-Y Growth (%) Projections by Mode of Action, 2025-2035
  • Figure 142: Europe Market Value (USD Million) Analysis by Source, 2020-2035
  • Figure 143: Europe Market Volume (Units) Analysis by Source, 2020-2035
  • Figure 144: Europe Market Value Share (%) and BPS Analysis by Source, 2025-2035
  • Figure 145: Europe Market Y-o-Y Growth (%) Projections by Source, 2025-2035
  • Figure 146: Europe Market Value (USD Million) Analysis by Delivery System, 2020-2035
  • Figure 147: Europe Market Volume (Units) Analysis by Delivery System, 2020-2035
  • Figure 148: Europe Market Value Share (%) and BPS Analysis by Delivery System, 2025-2035
  • Figure 149: Europe Market Y-o-Y Growth (%) Projections by Delivery System, 2025-2035
  • Figure 150: Europe Market Value (USD Million) Analysis by Physical Form, 2020-2035
  • Figure 151: Europe Market Volume (Units) Analysis by Physical Form, 2020-2035
  • Figure 152: Europe Market Value Share (%) and BPS Analysis by Physical Form, 2025-2035
  • Figure 153: Europe Market Y-o-Y Growth (%) Projections by Physical Form, 2025-2035
  • Figure 154: Europe Market Value (USD Million) Analysis by Application, 2020-2035
  • Figure 155: Europe Market Volume (Units) Analysis by Application, 2020-2035
  • Figure 156: Europe Market Value Share (%) and BPS Analysis by Application, 2025-2035
  • Figure 157: Europe Market Y-o-Y Growth (%) Projections by Application, 2025-2035
  • Figure 158: Europe Market Value (USD Million) Analysis by End Use, 2020-2035
  • Figure 159: Europe Market Volume (Units) Analysis by End Use, 2020-2035
  • Figure 160: Europe Market Value Share (%) and BPS Analysis by End Use, 2025-2035
  • Figure 161: Europe Market Y-o-Y Growth (%) Projections by End Use, 2025-2035
  • Figure 162: Europe Market Attractiveness by Mode of Action, 2025-2035
  • Figure 163: Europe Market Attractiveness by Source, 2025-2035
  • Figure 164: Europe Market Attractiveness by Delivery System, 2025-2035
  • Figure 165: Europe Market Attractiveness by Physical Form, 2025-2035
  • Figure 166: Europe Market Attractiveness by Application, 2025-2035
  • Figure 167: Europe Market Attractiveness by End Use, 2025-2035
  • Figure 168: Europe Market Attractiveness by Country, 2025-2035
  • Figure 169: East Asia Market Value (USD Million) by Mode of Action, 2025-2035
  • Figure 170: East Asia Market Value (USD Million) by Source, 2025-2035
  • Figure 171: East Asia Market Value (USD Million) by Delivery System, 2025-2035
  • Figure 172: East Asia Market Value (USD Million) by Physical Form, 2025-2035
  • Figure 173: East Asia Market Value (USD Million) by Application, 2025-2035
  • Figure 174: East Asia Market Value (USD Million) by End Use, 2025-2035
  • Figure 175: East Asia Market Value (USD Million) by Country, 2025-2035
  • Figure 176: East Asia Market Value (USD Million) Analysis by Country, 2020-2035
  • Figure 177: East Asia Market Volume (Units) Analysis by Country, 2020-2035
  • Figure 178: East Asia Market Value Share (%) and BPS Analysis by Country, 2025-2035
  • Figure 179: East Asia Market Y-o-Y Growth (%) Projections by Country, 2025-2035
  • Figure 180: East Asia Market Value (USD Million) Analysis by Mode of Action, 2020-2035
  • Figure 181: East Asia Market Volume (Units) Analysis by Mode of Action, 2020-2035
  • Figure 182: East Asia Market Value Share (%) and BPS Analysis by Mode of Action, 2025-2035
  • Figure 183: East Asia Market Y-o-Y Growth (%) Projections by Mode of Action, 2025-2035
  • Figure 184: East Asia Market Value (USD Million) Analysis by Source, 2020-2035
  • Figure 185: East Asia Market Volume (Units) Analysis by Source, 2020-2035
  • Figure 186: East Asia Market Value Share (%) and BPS Analysis by Source, 2025-2035
  • Figure 187: East Asia Market Y-o-Y Growth (%) Projections by Source, 2025-2035
  • Figure 188: East Asia Market Value (USD Million) Analysis by Delivery System, 2020-2035
  • Figure 189: East Asia Market Volume (Units) Analysis by Delivery System, 2020-2035
  • Figure 190: East Asia Market Value Share (%) and BPS Analysis by Delivery System, 2025-2035
  • Figure 191: East Asia Market Y-o-Y Growth (%) Projections by Delivery System, 2025-2035
  • Figure 192: East Asia Market Value (USD Million) Analysis by Physical Form, 2020-2035
  • Figure 193: East Asia Market Volume (Units) Analysis by Physical Form, 2020-2035
  • Figure 194: East Asia Market Value Share (%) and BPS Analysis by Physical Form, 2025-2035
  • Figure 195: East Asia Market Y-o-Y Growth (%) Projections by Physical Form, 2025-2035
  • Figure 196: East Asia Market Value (USD Million) Analysis by Application, 2020-2035
  • Figure 197: East Asia Market Volume (Units) Analysis by Application, 2020-2035
  • Figure 198: East Asia Market Value Share (%) and BPS Analysis by Application, 2025-2035
  • Figure 199: East Asia Market Y-o-Y Growth (%) Projections by Application, 2025-2035
  • Figure 200: East Asia Market Value (USD Million) Analysis by End Use, 2020-2035
  • Figure 201: East Asia Market Volume (Units) Analysis by End Use, 2020-2035
  • Figure 202: East Asia Market Value Share (%) and BPS Analysis by End Use, 2025-2035
  • Figure 203: East Asia Market Y-o-Y Growth (%) Projections by End Use, 2025-2035
  • Figure 204: East Asia Market Attractiveness by Mode of Action, 2025-2035
  • Figure 205: East Asia Market Attractiveness by Source, 2025-2035
  • Figure 206: East Asia Market Attractiveness by Delivery System, 2025-2035
  • Figure 207: East Asia Market Attractiveness by Physical Form, 2025-2035
  • Figure 208: East Asia Market Attractiveness by Application, 2025-2035
  • Figure 209: East Asia Market Attractiveness by End Use, 2025-2035
  • Figure 210: East Asia Market Attractiveness by Country, 2025-2035
  • Figure 211: South Asia & Pacific Market Value (USD Million) by Mode of Action, 2025-2035
  • Figure 212: South Asia & Pacific Market Value (USD Million) by Source, 2025-2035
  • Figure 213: South Asia & Pacific Market Value (USD Million) by Delivery System, 2025-2035
  • Figure 214: South Asia & Pacific Market Value (USD Million) by Physical Form, 2025-2035
  • Figure 215: South Asia & Pacific Market Value (USD Million) by Application, 2025-2035
  • Figure 216: South Asia & Pacific Market Value (USD Million) by End Use, 2025-2035
  • Figure 217: South Asia & Pacific Market Value (USD Million) by Country, 2025-2035
  • Figure 218: South Asia & Pacific Market Value (USD Million) Analysis by Country, 2020-2035
  • Figure 219: South Asia & Pacific Market Volume (Units) Analysis by Country, 2020-2035
  • Figure 220: South Asia & Pacific Market Value Share (%) and BPS Analysis by Country, 2025-2035
  • Figure 221: South Asia & Pacific Market Y-o-Y Growth (%) Projections by Country, 2025-2035
  • Figure 222: South Asia & Pacific Market Value (USD Million) Analysis by Mode of Action, 2020-2035
  • Figure 223: South Asia & Pacific Market Volume (Units) Analysis by Mode of Action, 2020-2035
  • Figure 224: South Asia & Pacific Market Value Share (%) and BPS Analysis by Mode of Action, 2025-2035
  • Figure 225: South Asia & Pacific Market Y-o-Y Growth (%) Projections by Mode of Action, 2025-2035
  • Figure 226: South Asia & Pacific Market Value (USD Million) Analysis by Source, 2020-2035
  • Figure 227: South Asia & Pacific Market Volume (Units) Analysis by Source, 2020-2035
  • Figure 228: South Asia & Pacific Market Value Share (%) and BPS Analysis by Source, 2025-2035
  • Figure 229: South Asia & Pacific Market Y-o-Y Growth (%) Projections by Source, 2025-2035
  • Figure 230: South Asia & Pacific Market Value (USD Million) Analysis by Delivery System, 2020-2035
  • Figure 231: South Asia & Pacific Market Volume (Units) Analysis by Delivery System, 2020-2035
  • Figure 232: South Asia & Pacific Market Value Share (%) and BPS Analysis by Delivery System, 2025-2035
  • Figure 233: South Asia & Pacific Market Y-o-Y Growth (%) Projections by Delivery System, 2025-2035
  • Figure 234: South Asia & Pacific Market Value (USD Million) Analysis by Physical Form, 2020-2035
  • Figure 235: South Asia & Pacific Market Volume (Units) Analysis by Physical Form, 2020-2035
  • Figure 236: South Asia & Pacific Market Value Share (%) and BPS Analysis by Physical Form, 2025-2035
  • Figure 237: South Asia & Pacific Market Y-o-Y Growth (%) Projections by Physical Form, 2025-2035
  • Figure 238: South Asia & Pacific Market Value (USD Million) Analysis by Application, 2020-2035
  • Figure 239: South Asia & Pacific Market Volume (Units) Analysis by Application, 2020-2035
  • Figure 240: South Asia & Pacific Market Value Share (%) and BPS Analysis by Application, 2025-2035
  • Figure 241: South Asia & Pacific Market Y-o-Y Growth (%) Projections by Application, 2025-2035
  • Figure 242: South Asia & Pacific Market Value (USD Million) Analysis by End Use, 2020-2035
  • Figure 243: South Asia & Pacific Market Volume (Units) Analysis by End Use, 2020-2035
  • Figure 244: South Asia & Pacific Market Value Share (%) and BPS Analysis by End Use, 2025-2035
  • Figure 245: South Asia & Pacific Market Y-o-Y Growth (%) Projections by End Use, 2025-2035
  • Figure 246: South Asia & Pacific Market Attractiveness by Mode of Action, 2025-2035
  • Figure 247: South Asia & Pacific Market Attractiveness by Source, 2025-2035
  • Figure 248: South Asia & Pacific Market Attractiveness by Delivery System, 2025-2035
  • Figure 249: South Asia & Pacific Market Attractiveness by Physical Form, 2025-2035
  • Figure 250: South Asia & Pacific Market Attractiveness by Application, 2025-2035
  • Figure 251: South Asia & Pacific Market Attractiveness by End Use, 2025-2035
  • Figure 252: South Asia & Pacific Market Attractiveness by Country, 2025-2035
  • Figure 253: Middle East and Africa Market Value (USD Million) by Mode of Action, 2025-2035
  • Figure 254: Middle East and Africa Market Value (USD Million) by Source, 2025-2035
  • Figure 255: Middle East and Africa Market Value (USD Million) by Delivery System, 2025-2035
  • Figure 256: Middle East and Africa Market Value (USD Million) by Physical Form, 2025-2035
  • Figure 257: Middle East and Africa Market Value (USD Million) by Application, 2025-2035
  • Figure 258: Middle East and Africa Market Value (USD Million) by End Use, 2025-2035
  • Figure 259: Middle East and Africa Market Value (USD Million) by Country, 2025-2035
  • Figure 260: Middle East and Africa Market Value (USD Million) Analysis by Country, 2020-2035
  • Figure 261: Middle East and Africa Market Volume (Units) Analysis by Country, 2020-2035
  • Figure 262: Middle East and Africa Market Value Share (%) and BPS Analysis by Country, 2025-2035
  • Figure 263: Middle East and Africa Market Y-o-Y Growth (%) Projections by Country, 2025-2035
  • Figure 264: Middle East and Africa Market Value (USD Million) Analysis by Mode of Action, 2020-2035
  • Figure 265: Middle East and Africa Market Volume (Units) Analysis by Mode of Action, 2020-2035
  • Figure 266: Middle East and Africa Market Value Share (%) and BPS Analysis by Mode of Action, 2025-2035
  • Figure 267: Middle East and Africa Market Y-o-Y Growth (%) Projections by Mode of Action, 2025-2035
  • Figure 268: Middle East and Africa Market Value (USD Million) Analysis by Source, 2020-2035
  • Figure 269: Middle East and Africa Market Volume (Units) Analysis by Source, 2020-2035
  • Figure 270: Middle East and Africa Market Value Share (%) and BPS Analysis by Source, 2025-2035
  • Figure 271: Middle East and Africa Market Y-o-Y Growth (%) Projections by Source, 2025-2035
  • Figure 272: Middle East and Africa Market Value (USD Million) Analysis by Delivery System, 2020-2035
  • Figure 273: Middle East and Africa Market Volume (Units) Analysis by Delivery System, 2020-2035
  • Figure 274: Middle East and Africa Market Value Share (%) and BPS Analysis by Delivery System, 2025-2035
  • Figure 275: Middle East and Africa Market Y-o-Y Growth (%) Projections by Delivery System, 2025-2035
  • Figure 276: Middle East and Africa Market Value (USD Million) Analysis by Physical Form, 2020-2035
  • Figure 277: Middle East and Africa Market Volume (Units) Analysis by Physical Form, 2020-2035
  • Figure 278: Middle East and Africa Market Value Share (%) and BPS Analysis by Physical Form, 2025-2035
  • Figure 279: Middle East and Africa Market Y-o-Y Growth (%) Projections by Physical Form, 2025-2035
  • Figure 280: Middle East and Africa Market Value (USD Million) Analysis by Application, 2020-2035
  • Figure 281: Middle East and Africa Market Volume (Units) Analysis by Application, 2020-2035
  • Figure 282: Middle East and Africa Market Value Share (%) and BPS Analysis by Application, 2025-2035
  • Figure 283: Middle East and Africa Market Y-o-Y Growth (%) Projections by Application, 2025-2035
  • Figure 284: Middle East and Africa Market Value (USD Million) Analysis by End Use, 2020-2035
  • Figure 285: Middle East and Africa Market Volume (Units) Analysis by End Use, 2020-2035
  • Figure 286: Middle East and Africa Market Value Share (%) and BPS Analysis by End Use, 2025-2035
  • Figure 287: Middle East and Africa Market Y-o-Y Growth (%) Projections by End Use, 2025-2035
  • Figure 288: Middle East and Africa Market Attractiveness by Mode of Action, 2025-2035
  • Figure 289: Middle East and Africa Market Attractiveness by Source, 2025-2035
  • Figure 290: Middle East and Africa Market Attractiveness by Delivery System, 2025-2035
  • Figure 291: Middle East and Africa Market Attractiveness by Physical Form, 2025-2035
  • Figure 292: Middle East and Africa Market Attractiveness by Application, 2025-2035
  • Figure 293: Middle East and Africa Market Attractiveness by End Use, 2025-2035
  • Figure 294: Middle East and Africa Market Attractiveness by Country, 2025-2035
Dashboard
Dashboard
Dashboard
Dashboard
Dashboard
Dashboard

Full Research Suite comprises of:

Market outlook & trends analysis

Market outlook & trends analysis

Interviews & case studies

Interviews & case studies

Strategic recommendations

Strategic recommendations

Vendor profiles & capabilities analysis

Vendor profiles & capabilities analysis

5-year forecasts

5-year forecasts

8 regions and 60+ country-level data splits

8 regions and 60+ country-level data splits

Market segment data splits

Market segment data splits

12 months of continuous data updates

12 months of continuous data updates

DELIVERED AS:

PDF EXCEL ONLINE

Full Research Suite


$2000

$3500

$5000

Buy Report Now
Similar Industry Reports

Similar Industry Reports

I/O-Link Market
I/O-Link Market

I/O-Link Market Analysis - Size, Share, and Forecast 2025 to 2035

I/O-Link Market Share Analysis

Breaking Down Market Share in the I/O-Link Industry

CMO/CDMO Industry Analysis in Brazil

CMO/CDMO Industry Analysis in Brazil Size and Share Forecast Outlook 2025 to 2035

AHA/BHA Chemical Peels Market

AHA/BHA Chemical Peels Market Analysis - Size and Share Forecast Outlook 2025 to 2035

CMO/CDMO Market
CMO/CDMO Market

CMO/CDMO Market Analysis - Size, Share, and Forecast 2025 to 2035

HIV/HBV/HCV Test Kits Market

HIV/HBV/HCV Test Kits Market Trends and Forecast 2025 to 2035

DNA/RNA Extraction Market

DNA/RNA Extraction Market Growth & Demand 2025 to 2035

IaaS/Hosting Infrastructure Services Market

IaaS/Hosting Infrastructure Services Market Size and Share Forecast Outlook 2025 to 2035

PD-1/PD-L1 Inhibitors Market

PD-1/PD-L1 Inhibitors Market – Trends, Growth & Forecast 2025 to 2035

Smart/AI Toy Market
Smart/AI Toy Market

Smart/AI Toy Market Size and Share Forecast Outlook 2025 to 2035

Stoma/Ostomy Care Market

Stoma/Ostomy Care Market Growth - Trends & Forecast 2025 to 2035

Vacuum/Gas Flushing And Sealing Machine Market

Vacuum/Gas Flushing And Sealing Machine Market

Family/Indoor Entertainment Centres Market

Family/Indoor Entertainment Centres Market Report – Forecast 2017-2027

Kitchen/ Toilet Roll Converting Machines Market

Kitchen/ Toilet Roll Converting Machines Market Size and Share Forecast Outlook 2025 to 2035

Protein/Antibody Engineering Market

Protein/Antibody Engineering Market Size and Share Forecast Outlook 2025 to 2035

Foldable/Compressible Beverage Carton Market

Foldable/Compressible Beverage Carton Market Size and Share Forecast Outlook 2025 to 2035

802.15.4/ZigBee Market

802.15.4/ZigBee Market Size and Share Forecast Outlook 2025 to 2035

Starches/Glucose Market

Starches/Glucose Market

EDM Oils/Fluids Market

EDM Oils/Fluids Market

Shotcrete/Sprayed Concrete Market

Shotcrete/Sprayed Concrete Market Size and Share Forecast Outlook 2025 to 2035

Future Market Insights

Anti-Redness / Anti-Couperose Agents Market

Chat With MaRIA

Chat With

MaRIA

Hi There, I am MaRIA, Your Market Research Intelligence Assistant. How may I help you?