

- Market Size (2026)
- USD 563.0 Mn
- Forecast (2036)
- USD 5243.0 Mn
- CAGR (2026 to 2036)
- 25.0%
How big is the Autonomous Shuttles & Public Transit Pods Market in 2026?
USD 563.0 million in 2026 and USD 5,243.0 million by 2036 at a 25.0% CAGR.
Sales in autonomous shuttles and public transit pods market are projected to increase from USD 563.0 million in 2026 to USD 5,243.0 million by 2036, expanding at 25.0% CAGR between 2026 and 2036. Lightly used transit routes present one of the notable adoption opportunities for autonomous shuttles and public transit pods, as operating a full-size bus can be uneconomical when passenger demand is low. According to APTA, USA bus operating expenses reached USD 31.9 billion in report year 2024, creating a strong incentive for transit agencies to evaluate smaller autonomous vehicles that can reduce service costs while maintaining route coverage and reliability. Road automation within the autonomous vehicles outlook supports lower service costs without reducing access or reliability. That cost base gives transit agencies a reason to test smaller vehicles with less unused capacity.
Public agencies adopt autonomous shuttles at different speeds, reflecting the transport problem each country needs to solve. USA programs often focus on rural access and mixed-traffic routes that lack dependable conventional service options. Japan uses compact local routes to protect community access amid a shortage of qualified bus drivers. In April 2025, the USA Department of Transportation launched a USD 25 million rural autonomous vehicle research program.
It assigned USD 15 million to passenger transport research covering digital maps and shared-road operation. The funding shows that USA programs test road operation and public access together within one research plan. Connected systems in intelligent transport systems support repeatable service under clear local rules. Accessibility and charging remain part of the same plan; both choices affect daily cost and route reliability.
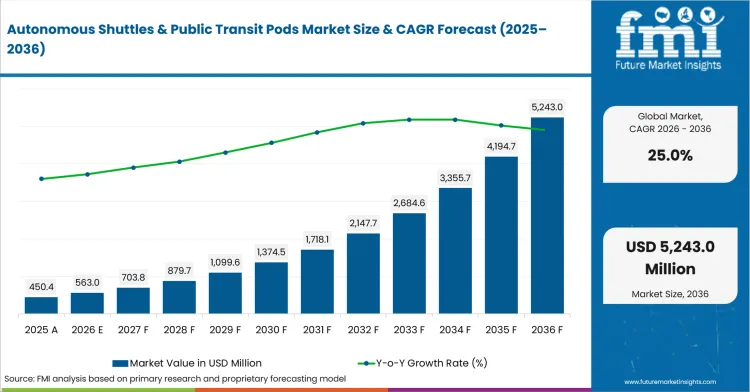
| Metric | Value |
|---|---|
| 2025 Market Size | USD 450.4 million |
| 2026 Market Size | USD 563.0 million |
| 2036 Market Size | USD 5,243.0 million |
| Forecast CAGR (2026-2036) | 25.0% |
| Vehicle Type Focus | 8-15 Seat Shuttle Pods |
| 8-15 Seat Shuttle Pods Share (2026) | 46.0% |
| Application Focus | Campus Circulation |
| Campus Circulation Share (2026) | 30.0% |
| Component Focus | Vehicles |
| Vehicles Share (2026) | 52.0% |
Summary of the Autonomous Shuttles & Public Transit Pods Market
| Market Signal | Commercial Impact |
|---|---|
| Demand and Growth Drivers | Autonomous shuttles solve a narrow but costly transit problem by giving agencies smaller vehicles for lightly used routes. They support regular service without carrying the full operating cost and unused capacity of a conventional bus.
|
| Product and Segment View | Vehicle size and service design must work together to create a practical passenger service on each route. A capable shuttle loses value if its cabin or route plan does not match daily passenger needs.
|
| Geography and Growth Outlook | Country growth reflects how quickly a public trial becomes funded passenger service under local approval rules. Local transport gaps then determine which use cases enter routine operation first within each country.
|
| Competitive Landscape | Competition spans vehicle makers and automated-driving developers that service operators join into one passenger offer. The commercial test is whether that combined offer gives the transit agency clear responsibility and lower coordination risk.
|
| Analyst Perspective | One successful autonomous trip does not prove that a route is ready for regular passenger service. The real test is reliable daily operation across changes in passenger demand and road conditions throughout the week.
|
Source: FMI's proprietary forecasting model and primary research
How is the autonomous shuttles & public transit pods market segmented?
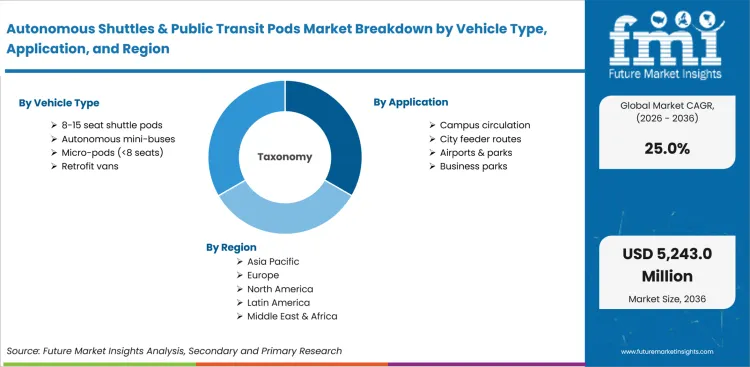
The autonomous shuttles & public transit pods industry is segmented by vehicle type, application, component, end-use, business model, and region.
The report compares six market dimensions: vehicle type, application, component, end-use, business model, and region. Vehicle types include 8-15 seat shuttle pods, autonomous mini-buses, micro-pods, and retrofit vans for varied route loads. Applications cover campus circulation, city feeder routes, airport circuits, and business park shuttles. Component analysis separates vehicle spending from autonomy software and operations services; end-use covers municipal transit, universities, airports, and private estates. Business models compare direct sales, leases, pilot programs, and managed operations for recurring passenger service. Regional coverage spans North America, Latin America, Europe, East Asia, South Asia, Oceania, and the Middle East and Africa. This structure helps readers compare route needs with vehicle size and service ownership throughout the report.
How does the 8-15 seat shuttle pod format shape demand within the vehicle type category?
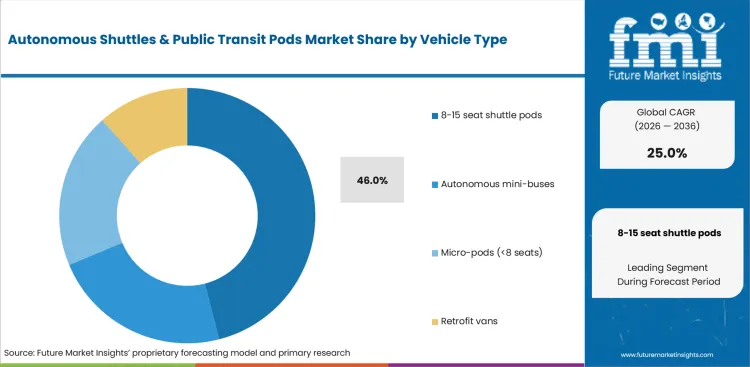
Route planners need enough seats to replace weak bus service without creating another large-vehicle problem. The 8-15 seat pod meets that need with useful passenger room and a compact road footprint. HOLON reported in May 2025 that its barrier-free urban shuttle carries up to 15 passengers. The specification shows why route approval must consider accessible boarding and passenger capacity within one vehicle design.
- By vehicle type, 8-15 seat shuttle pods are forecast to represent 46.0% in 2026 due to better fit on lightly used routes and easier curb access. The format carries a useful passenger load without the turning space of a full-size bus. Its value comes from matching vehicle size to demand so agencies do not pay for empty seats.
- Municipal transport departments are expected to use this format on neighborhood feeders with changing demand across the day. Boarding access and cabin layout in electric low-entry buses offer a useful comparison for shuttle approval. Approval depends on clear evidence that passenger access suits the road design during normal service. That evidence helps agencies avoid a vehicle that performs well in a test but fails at busy stops.
What supports demand for campus circulation within the application category?
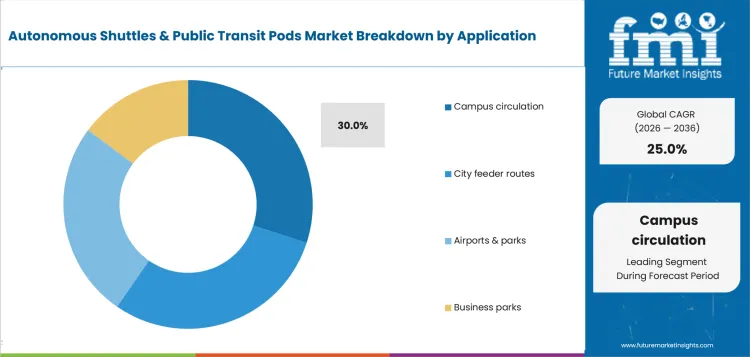
Campus routes appear simple, yet passenger demand changes sharply around class schedules and shift changes. A controlled campus lets operators find service problems without the full risk of city traffic. Karsan's March 2025 integrated report stated that the autonomous e-ATAK had carried more than 35,000 passengers during 1.5 years on a five-kilometer Michigan State University route. That record gives campus managers operating evidence that extends far beyond a short demonstration period.
- In 2026, campus circulation is expected to lead the application category with 30.0% share due to contained routes and moderate speeds. Universities define stops and service hours during the first operating phase, which keeps early route changes under their control. This control reduces early risk and gives students a visible transport benefit during normal campus activity.
- Universities and business parks are expected to buy shuttle services that connect parking areas with internal destinations. A mobility service model helps decision-makers compare an operations contract with direct ownership for the same route. The better model assigns daily service and incident response to a clearly named party, which reduces delays once passenger trials finish.
How are vehicles positioned within the component category?
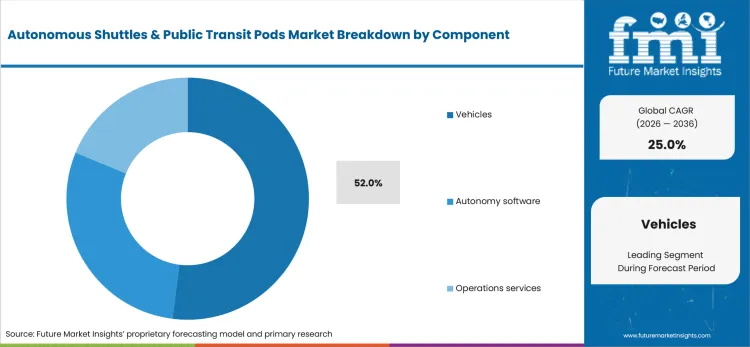
Every autonomous service needs an accessible cabin and a road-ready platform: software cannot create passenger value without that physical base. Sensors and onboard computers raise the cost of each unit, which keeps the vehicle central to early spending. HOLON reported in October 2025 that its planned Jacksonville plant would cover about 580,000 square feet. The plan connects manufacturing capacity with fleet growth and shows why production readiness affects larger orders.
- By component, vehicles are estimated to hold 52.0% share in 2026 owing to chassis and sensor costs. The share reflects the capital needed to place a complete road-ready unit into regular passenger service. Fleet plans therefore need a clear supply schedule that grows with route demand and avoids gaps between orders.
- Fleet operators are expected to spend more on autonomy software once regular service requires map updates and remote control. Communications and vehicle data in connected vehicle technology support reliable control across a growing fleet. Recurring map updates and remote supervision give software providers a larger role during longer service hours and wider fleet use.
What are the drivers, restraints, and opportunities in the autonomous shuttles & public transit pods market?
Lower onboard labor costs are expected to support demand. Public-road approval is anticipated to slow expansion. Turnkey service contracts are projected to simplify daily fleet management.
- Driver: Low passenger volumes are expected to support smaller autonomous shuttles on routes that cannot justify a conventional bus.
- Restraint: Public-road approval is anticipated to extend project schedules; each route needs separate safety evidence and clear operating responsibility.
- Opportunity: Turnkey contracts are projected to widen adoption by placing vehicle supply and fleet control under one operator responsible for daily service.
Low-density routes create a financial problem for agencies that must preserve access despite weak passenger demand. The USA Department of Transportation reported in June 2026 that fiscal 2024 SMART awards included USD 54 million for 34 Stage 1 projects. The program announced USD 85 million across eight Stage 2 awards for wider implementation. These awards show that agencies want technology trials tied to clear public outcomes and service goals. Autonomous shuttles create lasting value once a successful trial gains a funded operating plan for several years.
Public-road approval creates real friction: a controlled demonstration does not prove that a vehicle suits every route. NHTSA reported in August 2025 that it issued the first domestic demonstration exemption under its expanded automated vehicle program. The exemption opened a limited testing path but left local operating duties with project teams and public agencies. Project teams need a clear safety case and written incident plan to protect the passenger service schedule. Weak evidence delays passenger service even if the vehicle performs well during a controlled demonstration.
Service partnerships address a common adoption challenge by ensuring clear accountability for the overall operation and performance of autonomous transit systems. Beep and ADASTEC announced an alliance in September 2025 for planned work in Florida and Georgia. Beep manages fleet operations, and ADASTEC provides the automated-driving system for the planned passenger services. Autonomous passenger services such as robotaxi services need one accountable operating lead from launch. One party must coordinate daily service and field response to give transit agencies a clear performance standard.
Which country CAGRs are profiled in the autonomous shuttles & public transit pods market?
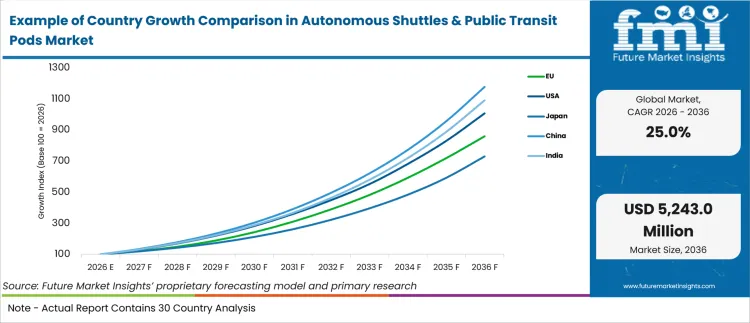
| Country | CAGR |
|---|---|
| United States | 26.0% |
| European Union | 24.0% |
| Japan | 22.0% |
Source: FMI's proprietary forecasting model and primary research
How do country-level CAGRs compare in the autonomous shuttles & public transit pods market?
Country growth depends on how quickly a public trial becomes a funded passenger service under stable operating rules. The United States gives service operators more room to combine vehicles with central fleet control under one contract. European programs place greater weight on safety evidence that remains useful across several local approval settings. Japan uses compact routes to protect local mobility amid driver shortages that reduce conventional bus service. These conditions shape a different commercial test in each market, from daily operating responsibility to transferable safety evidence and dependable rural access.
- Demand for autonomous shuttles & public transit pods in the United States is forecast to rise at 26.0% CAGR by 2036 due to operator-led programs and public research funding. Jacksonville has moved autonomous transit from a closed test into a public service contract with defined operating duties. Beep reported in July 2025 that NAVI uses 14 electric Ford E-Transit vehicles under a five-year operating contract. The same announcement disclosed a USD 52.7 million funding round that supports daily fleet responsibility alongside vehicle supply. Passenger access and service integration through transit ticketing systems help autonomous service fit into existing public transport networks. USA growth is expected to favor programs that fit autonomous service into established public transport systems.
- European transport authorities expect safety evidence that remains useful across different local approval settings and passenger rules. Karsan and HOLON use local trials to build that evidence with vehicles designed for public transport. The European Union outlook is projected to advance at 24.0% CAGR from 2026 to 2036 supported by coordinated automated-mobility research. The European Commission published its Climate, Energy and Mobility work programme in May 2025 for the current funding cycle. The programme included dedicated topics for connected automated mobility and remote operations, placing more attention on service controls beyond the vehicle. Established fleet electrification in electric bus programs provides a useful comparison across European cities. Growth depends on technical proof that works across sites without a rebuilt safety case for every location.
- Japan is testing compact routes amid a bus-driver shortage that threatens access for aging communities outside large cities. Japan's Ministry of Land, Infrastructure, Transport and Tourism reported in June 2025 that Iyotetsu Bus operated 66 daily Level-4 runs on an 800-meter route. Adoption in Japan is estimated to expand at 22.0% CAGR from 2026 to 2036 owing to controlled local programs. The route links a clear labor problem with measurable service frequency and daily passenger experience. Local authorities use the program to study passenger handling and reliability under normal operating conditions. Japanese growth is expected to depend on repeatable services that protect local links instead of large early fleet orders.
Who are the notable companies in the autonomous shuttles & public transit pods market?
Beep, Karsan, ADASTEC, HOLON, Ohmio, Oxa, MOIA, and Mobileye are the notable companies shaping this market.
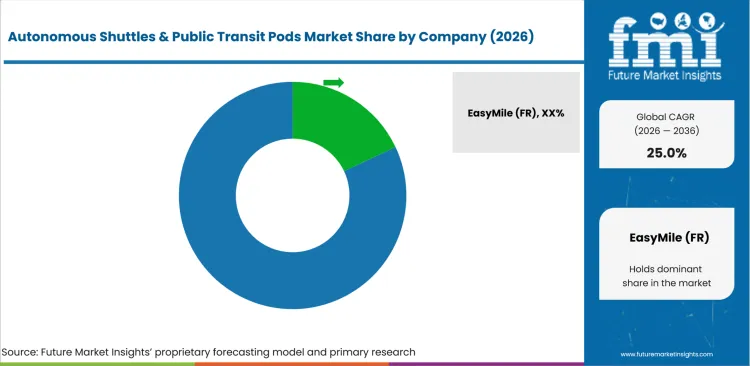
Competition includes vehicle makers, automated-driving developers, and companies that manage complete passenger services for public agencies. Transit agencies compare route evidence and safety records ahead of any long-term fleet contract or service commitment. Accessible cabins remain necessary but do not solve remote supervision or roadside response during daily operations. A public-road contract needs one operating plan that links the vehicle with software and service staff. Software control in software-defined vehicles shapes maintenance schedules and later upgrades across the fleet. Companies build a stronger position by reducing coordination risk for the transit authority during daily operations. A technical feature has limited commercial value without clear responsibility for the complete daily service.
- Beep and MOIA combine fleet control with passenger service under one operating structure that gives agencies clearer accountability. Transit authorities receive a single plan for launch and daily operations, reducing uncertainty across several vehicle and software partners.
- Karsan and HOLON compete through purpose-built accessible vehicles designed for repeated public transport service on fixed routes. Ohmio focuses on airports and other controlled routes that have clear passenger flows and operating boundaries. Their activity shows that cabin design and sensor placement are linked commercial choices within one vehicle program. Each company needs evidence that its platform fits local roads and passenger flows under the relevant approval rules.
- ADASTEC and Oxa supply automated-driving systems for buses and shuttles made by established vehicle partners. Mobileye brings perception and driving technology to series-ready passenger vehicles used across several mobility programs. These companies widen the supplier base by allowing operators to combine different vehicles with different service partners. Their commercial value depends on integration that remains clear to the transit authority under daily operating conditions.
Competitive Benchmarking: Autonomous Shuttles & Public Transit Pods Market
| Company | Vehicle Scope | Automated-Driving Integration | Operations Support | Geographic Reach |
|---|---|---|---|---|
| Beep | Medium | High | High | North America / Regional |
| Karsan | High | Medium | Medium | Europe and North America / Regional |
| ADASTEC | Low | High | Medium | Europe and North America / Regional |
| HOLON | Medium | High | Low | Europe and North America / Regional |
| Ohmio | Medium | High | Medium | Europe and Asia-Pacific / Regional |
| Oxa | Low | High | Medium | Europe and North America / Regional |
| MOIA | High | High | High | Europe and North America / Regional |
| Mobileye | Low | High | Low | Global |
Scoring basis: High indicates substantial direct capability in the stated dimension. Medium reflects relevant but partial or partner-supported capability, and Low reflects limited direct evidence.
Source: Future Market Insights competitive analysis, 2026. Ratings reflect relative portfolio relevance and workflow fit. Service capability and geographic reach shape the remaining comparison.
Key Developments in the Autonomous Shuttles & Public Transit Pods Market
- June 2025, MOIA introduced the series-production Volkswagen ID. Buzz AD and a complete autonomous mobility service package. The offer combines the vehicle with fleet software and daily operating support under one contract. Cities therefore receive one plan for passenger operations and remote supervision from the first service day.
- August 2025, Oxa supported Northern Ireland's first self-driving passenger shuttle in Belfast's Titanic Quarter. Two electric eVersum vehicles carry up to eight passengers on a one-mile route between the railway station and the district. The controlled urban loop lets local planners test passenger demand and service reliability with measurable operating evidence.
- June 2025, Ohmio demonstrated its LIFT shuttle at Brussels Airport for New Zealand's prime minister and Belgian transport leaders. The airport provides defined routes and repeatable passenger movements for a controlled service test.
- November 2025, HOLON received German approval to test its urban shuttle on public roads with a safety driver. The permit covers nationwide testing outside motorways and began with Hamburg's ALIKE project under supervised road conditions. HOLON can now collect road evidence under consistent national rules that apply across several operating settings. That evidence gives transit operators a stronger basis for judging how the vehicle performs during daily service in real traffic.
Key Players in the Autonomous Shuttles & Public Transit Pods Market
Turnkey transit operators and service managers
- Beep
- MOIA
Purpose-built shuttle and bus manufacturers
- Karsan
- HOLON
- Ohmio
Automated-driving technology providers
- ADASTEC
- Oxa
- Mobileye
Autonomous Shuttles & Public Transit Pods Market - Report Scope
| Coverage field | Report scope |
|---|---|
| Market breakdown | Vehicle type, application, component, end-use, business model, and region. |
| Quantitative Units | Revenue in USD Million, CAGR in %. |
| Market Definition | Driverless passenger shuttles and transit pods that provide fixed or flexible low-speed service with automated-driving systems and fleet support. |
| Regions Covered | North America, Latin America, Europe, East Asia, South Asia, Oceania, and Middle East and Africa. |
| Countries Covered | United States, Canada, Japan, China, India, major European countries, and 20+ countries within the regional model. |
| Key Companies Profiled | Beep, Karsan, ADASTEC, HOLON, Ohmio, Oxa, MOIA, and Mobileye. |
| Forecast Period | 2026 to 2036. |
| Approach | Hybrid bottom-up and top-down market sizing supported by primary interviews and official desk research. |
Source: Future Market Insights - analysis driven by proprietary forecasting models and primary research
Autonomous Shuttles & Public Transit Pods Market - Research Methodology
| Method | Approach |
|---|---|
| Primary Research | Primary research draws on interviews with transit agencies and campus transport managers responsible for passenger access. Airport operators explain route controls and service limits that shape daily operations at controlled sites. Vehicle makers describe capacity and maintenance needs, and automated-driving developers discuss mapping and remote supervision. Service operators explain charging and incident response, helping the research team test each route's operating plan. |
| Desk Research | Desk research reviews official transit spending and automated-vehicle rules that shape funded mobility programs in each market. Public grant records show which projects received money and what operating goals each award must address. Company product pages confirm vehicle capacity and service scope, and official news pages explain road approvals or partnerships. Together these sources separate routine passenger service from short demonstrations and show whether public funding supports clear outcomes. |
| Market Sizing and Forecasting | Market sizing combines estimated vehicle revenue with software licenses and operations contracts linked to passenger service. Pilot income is separated from recurring revenue so short demonstrations do not overstate the commercial market. Fleet size and route length support vehicle estimates, and service hours or contract duration inform operations revenue. Company evidence is checked against transit investment and country adoption patterns in the United States, European Union, and Japan. |
| Data Validation | Data validation checks company participation against public-road evidence and interviews with operators responsible for daily service. Segment shares are tested against vehicle capacity and route use, and country forecasts are compared with local funding. Competitive ratings use separate evidence for vehicle scope and automated-driving integration under documented passenger-service programs. |
Source: Future Market Insights (FMI) analysis, based on proprietary forecasting model and primary research
Autonomous Shuttles & Public Transit Pods Market by Segments
Autonomous Shuttles & Public Transit Pods Market segmented by Vehicle Type:
- 8-15 Seat Shuttle Pods
- Autonomous Mini-buses
- Micro-pods Under 8 Seats
- Retrofit Vans
Autonomous Shuttles & Public Transit Pods Market segmented by Application:
- Campus Circulation
- City Feeder Routes
- Airports and Parks
- Business Parks
Autonomous Shuttles & Public Transit Pods Market segmented by Component:
- Vehicles
- Autonomy Software
- Operations Services
Autonomous Shuttles & Public Transit Pods Market segmented by End-use:
- Municipal Transit
- Universities and Campuses
- Airports
- Private Estates
Autonomous Shuttles & Public Transit Pods Market segmented by Business Model:
- Operations Contracts
- Direct Sale
- Lease
- Pilot Programs
Autonomous Shuttles & Public Transit Pods Market by Region:
- North America
- United States
- Canada
- Latin America
- Brazil
- Mexico
- Argentina
- Europe
- Germany
- United Kingdom
- France
- Italy
- Spain
- East Asia
- China
- Japan
- South Korea
- South Asia
- India
- Thailand
- Indonesia
- Oceania
- Australia
- New Zealand
- Middle East and Africa
- GCC Countries
- South Africa
- Türkiye
Research Sources and Bibliography
- American Public Transportation Association. (2026, April). 2026 public transportation fact book. American Public Transportation Association.
- USA Department of Transportation. (2025, April). Announcing the launch of the Rural Autonomous Vehicle (RAV) Research Program. USA Department of Transportation.
- HOLON. (2025, May). HOLON presents new interior at UITP 2025. HOLON.
- Karsan. (2025, March). 2024 integrated annual report. Karsan.
- HOLON. (2025, October). HOLON seals partnership for new production facility. HOLON.
- USA Department of Transportation. (2026, June). SMART Grants Program. USA Department of Transportation.
- National Highway Traffic Safety Administration. (2025, August). NHTSA issues first-ever demonstration exemption to American-built automated vehicles. USA Department of Transportation.
- Beep. (2025, September). Beep, Inc. and ADASTEC announce alliance agreement to scale shared autonomous transportation services ahead of two upcoming deployments. Beep.
- Beep. (2025, July). Beep begins operating NAVI: Nation’s first fully autonomous public transit system. Beep.
- European Commission. (2025, May). Horizon Europe Work Programme 2025: Climate, Energy and Mobility. European Commission.
- Ministry of Land, Infrastructure, Transport and Tourism. (2025, June). Summary of the white paper on land, infrastructure, transport and tourism in Japan, 2025. Government of Japan.
- MOIA. (2025, June). MOIA unveils series production version ID. Buzz AD and turnkey solution for fully autonomous mobility services. MOIA.
- Oxa. (2025, August). Oxa powers Northern Ireland’s first self-driving shuttle. Oxa.
- Ohmio. (2025, June). NZ Prime Minister rides the future on Ohmio LIFT at Brussels Airport. Ohmio.
- HOLON. (2025, November). HOLON receives approval for autonomous testing on German roads. HOLON.
- ADASTEC. (2025, August). The first full-size automated bus operating on public roads in Germany begins service. ADASTEC.
- Mobileye. (2025, December). Ruter and Holo choose MOIA with Mobileye Drive for next stage of AVs. Mobileye.
This bibliography is provided for reader reference and uses primary government, standards-body, official trade body, and company sources.
This Report Answers
- What market value is estimated for 2026 and 2036?
- What CAGR is projected from 2026 to 2036?
- Which vehicle segments shape demand, and how do application or component choices change the outlook?
- Which operating pressures support autonomous shuttle use?
- How do country CAGRs differ across the United States, European Union, and Japan?
- Which companies compete through vehicles or automated-driving systems, and which firms manage daily service?
- How does FMI validate market estimates and country forecasts?
- What should transit authorities resolve ahead of service expansion or a vehicle order?
- How do public-road approval and safety evidence affect company selection?
Frequently Asked Questions
What is driving growth in the Autonomous Shuttles & Public Transit Pods Market?
Transit agencies need a lower-cost way to serve routes with too few riders for a full-size bus. Smaller autonomous vehicles reduce unused capacity and onboard labor without giving up a regular passenger timetable.
Who are the key players in the Autonomous Shuttles & Public Transit Pods Market?
Beep and MOIA compete through fleet management and daily service support for public passenger programs. Karsan and HOLON build purpose-made vehicles, and ADASTEC and Oxa supply automated-driving systems for partner fleets.
What is a notable restraint in the Autonomous Shuttles & Public Transit Pods Market?
Public-road approval often extends project schedules even if a controlled trial performs well under test conditions. Agencies need route-specific safety evidence and clear responsibility for remote supervision during regular passenger service.
Why should executives track the Autonomous Shuttles & Public Transit Pods Market?
Autonomous shuttles change how transit agencies protect low-density routes and controlled sites without using full-size buses. The market creates contracts that combine vehicles with software and daily service under one operating plan.
What business problem does the Autonomous Shuttles & Public Transit Pods Market address?
The market serves routes that carry too few passengers to justify a conventional bus on a regular schedule. Smaller driverless vehicles preserve access with less unused capacity and lower onboard labor costs during daily service.
What should procurement leaders evaluate before selecting suppliers?
Transit authorities should compare route fit and passenger access with the safety evidence behind each operating design. Contracts need clear responsibility for fleet control and maintenance from the first day of regular service.
What limits return on investment for purchasers?
Weak passenger demand leaves expensive vehicles underused if a successful trial does not expand into routine service. Charging and remote supervision reduce returns further if the operating budget leaves out those costs.
How do suppliers build long-term account confidence?
Reliable performance across changing passenger loads and road conditions builds confidence among transit agencies. Documented maintenance and a defined incident plan give agencies a practical basis for expanding service with fewer operating gaps.
Preview the report firsthand - request a free sample
Get SampleGet the brochure for pricing and purchase details.
Get PDFTable of Content
- Key Takeaways
- Market Size and CAGR
- Top Growth Driver
- Fastest Growing Segment
- Leading Region
- Key Companies
- Emerging Opportunities
- Executive Summary
- Global Market Outlook
- Demand-side Trends
- Supply-side Trends
- Technology Roadmap Analysis
- Analysis and Recommendations
- Analyst Perspective (What is happening? Why now? What should investors know?)
- Key Questions Answered
- How large is the market?
- What is the CAGR?
- What are key trends?
- Which region dominates?
- Who are the leaders?
- Market Overview
- Market Coverage / Taxonomy
- Market Definition / Scope / Limitations
- Research Methodology
- Chapter Orientation
- Analytical Lens and Working Hypotheses
- Market Structure, Signals, and Trend Drivers
- Benchmarking and Cross-market Comparability
- Market Sizing, Forecasting, and Opportunity Mapping
- Research Design and Evidence Framework
- Desk Research Programme (Secondary Evidence)
- Expert Input and Fieldwork (Primary Evidence)
- Tooling, Models, and Reference Databases
- Data Engineering and Model Build
- Quality Assurance and Audit Trail
- Market Background
- Market Dynamics (Drivers, Restraints, Opportunity, Trends)
- Scenario Forecast (Optimistic, Likely, Conservative)
- Impact Analysis
- AI Impact
- Sustainability Impact
- Regulatory Impact
- Technology Impact
- Consumer / Buyer Analysis
- Purchase Drivers
- Adoption Barriers
- Buyer Journey
- Opportunity Map Analysis
- Product Life Cycle Analysis
- Supply Chain Analysis
- Investment Feasibility Matrix
- Value Chain Analysis
- PESTLE and Porter's Analysis
- Regulatory Landscape
- Regional Parent Market Outlook
- Production and Consumption Statistics
- Import and Export Statistics
- Global Market Analysis and Forecast, 2021 to 2036
- Historical Market Size Value (USD Mn) Analysis, 2021 to 2025
- Current and Future Market Size Value (USD Mn) Projections, 2026 to 2036
- Y-o-Y Growth Trend Analysis
- Absolute $ Opportunity Analysis
- Global Market Pricing Analysis, 2021 to 2036
- Global Market Analysis and Forecast, By Vehicle Type, 2021 to 2036
- Introduction / Key Findings
- Historical Market Size Value (USD Mn) Analysis By Vehicle Type, 2021 to 2025
- Current and Future Market Size Value (USD Mn) Analysis and Forecast By Vehicle Type, 2026 to 2036
- 8-15 seat shuttle pods
- Autonomous mini-buses
- Micro-pods (<8 seats)
- Retrofit vans
- 8-15 seat shuttle pods
- Y-o-Y Growth Trend Analysis By Vehicle Type, 2021 to 2025
- Absolute $ Opportunity Analysis By Vehicle Type, 2026 to 2036
- Global Market Analysis and Forecast, By Application, 2021 to 2036
- Introduction / Key Findings
- Historical Market Size Value (USD Mn) Analysis By Application, 2021 to 2025
- Current and Future Market Size Value (USD Mn) Analysis and Forecast By Application, 2026 to 2036
- Campus circulation
- City feeder routes
- Airports & parks
- Business parks
- Campus circulation
- Y-o-Y Growth Trend Analysis By Application, 2021 to 2025
- Absolute $ Opportunity Analysis By Application, 2026 to 2036
- Global Market Analysis and Forecast, By Component, 2021 to 2036
- Introduction / Key Findings
- Historical Market Size Value (USD Mn) Analysis By Component, 2021 to 2025
- Current and Future Market Size Value (USD Mn) Analysis and Forecast By Component, 2026 to 2036
- Vehicles
- Autonomy software
- Operations services
- Vehicles
- Y-o-Y Growth Trend Analysis By Component, 2021 to 2025
- Absolute $ Opportunity Analysis By Component, 2026 to 2036
- Global Market Analysis and Forecast, By End-use, 2021 to 2036
- Introduction / Key Findings
- Historical Market Size Value (USD Mn) Analysis By End-use, 2021 to 2025
- Current and Future Market Size Value (USD Mn) Analysis and Forecast By End-use, 2026 to 2036
- Municipal transit
- Universities & campuses
- Airports
- Private estates
- Municipal transit
- Y-o-Y Growth Trend Analysis By End-use, 2021 to 2025
- Absolute $ Opportunity Analysis By End-use, 2026 to 2036
- Global Market Analysis and Forecast, By Business Model, 2021 to 2036
- Introduction / Key Findings
- Historical Market Size Value (USD Mn) Analysis By Business Model, 2021 to 2025
- Current and Future Market Size Value (USD Mn) Analysis and Forecast By Business Model, 2026 to 2036
- Operations contracts
- Direct sale
- Lease
- Pilot programs
- Operations contracts
- Y-o-Y Growth Trend Analysis By Business Model, 2021 to 2025
- Absolute $ Opportunity Analysis By Business Model, 2026 to 2036
- Global Market Analysis and Forecast, By Region, 2021 to 2036
- Introduction
- Historical Market Size Value (USD Mn) Analysis By Region, 2021 to 2025
- Current Market Size Value (USD Mn) Analysis and Forecast By Region, 2026 to 2036
- North America
- Latin America
- Western Europe
- Eastern Europe
- East Asia
- South Asia and Pacific
- Middle East & Africa
- Market Attractiveness Analysis By Region
- North America Market Analysis and Forecast, By Country, 2021 to 2036
- Historical Market Size Value (USD Mn) Trend Analysis By Market Taxonomy, 2021 to 2025
- Market Size Value (USD Mn) Forecast By Market Taxonomy, 2026 to 2036
- By Country
- USA
- Canada
- By Vehicle Type
- By Application
- By Component
- By End-use
- By Business Model
- By Country
- Market Attractiveness Analysis
- By Country
- By Vehicle Type
- By Application
- By Component
- By End-use
- By Business Model
- Key Takeaways
- Latin America Market Analysis and Forecast, By Country
- Historical Market Size Value (USD Mn) Trend Analysis By Market Taxonomy, 2021 to 2025
- Market Size Value (USD Mn) Forecast By Market Taxonomy, 2026 to 2036
- By Country
- Brazil
- Mexico
- Chile
- Rest of Latin America
- By Vehicle Type
- By Application
- By Component
- By End-use
- By Business Model
- By Country
- Market Attractiveness Analysis
- By Country
- By Vehicle Type
- By Application
- By Component
- By End-use
- By Business Model
- Key Takeaways
- Western Europe Market Analysis and Forecast, By Country
- Historical Market Size Value (USD Mn) Trend Analysis By Market Taxonomy, 2021 to 2025
- Market Size Value (USD Mn) Forecast By Market Taxonomy, 2026 to 2036
- By Country
- Germany
- UK
- Italy
- Spain
- France
- Nordic
- BENELUX
- Rest of Western Europe
- By Vehicle Type
- By Application
- By Component
- By End-use
- By Business Model
- By Country
- Market Attractiveness Analysis
- By Country
- By Vehicle Type
- By Application
- By Component
- By End-use
- By Business Model
- Key Takeaways
- Eastern Europe Market Analysis and Forecast, By Country
- Historical Market Size Value (USD Mn) Trend Analysis By Market Taxonomy, 2021 to 2025
- Market Size Value (USD Mn) Forecast By Market Taxonomy, 2026 to 2036
- By Country
- Russia
- Poland
- Hungary
- Balkan & Baltic
- Rest of Eastern Europe
- By Vehicle Type
- By Application
- By Component
- By End-use
- By Business Model
- By Country
- Market Attractiveness Analysis
- By Country
- By Vehicle Type
- By Application
- By Component
- By End-use
- By Business Model
- Key Takeaways
- East Asia Market Analysis and Forecast, By Country
- Historical Market Size Value (USD Mn) Trend Analysis By Market Taxonomy, 2021 to 2025
- Market Size Value (USD Mn) Forecast By Market Taxonomy, 2026 to 2036
- By Country
- China
- Japan
- South Korea
- By Vehicle Type
- By Application
- By Component
- By End-use
- By Business Model
- By Country
- Market Attractiveness Analysis
- By Country
- By Vehicle Type
- By Application
- By Component
- By End-use
- By Business Model
- Key Takeaways
- South Asia and Pacific Market Analysis and Forecast, By Country
- Historical Market Size Value (USD Mn) Trend Analysis By Market Taxonomy, 2021 to 2025
- Market Size Value (USD Mn) Forecast By Market Taxonomy, 2026 to 2036
- By Country
- India
- ASEAN
- Australia & New Zealand
- Rest of South Asia and Pacific
- By Vehicle Type
- By Application
- By Component
- By End-use
- By Business Model
- By Country
- Market Attractiveness Analysis
- By Country
- By Vehicle Type
- By Application
- By Component
- By End-use
- By Business Model
- Key Takeaways
- Middle East & Africa Market Analysis and Forecast, By Country
- Historical Market Size Value (USD Mn) Trend Analysis By Market Taxonomy, 2021 to 2025
- Market Size Value (USD Mn) Forecast By Market Taxonomy, 2026 to 2036
- By Country
- Kingdom of Saudi Arabia
- Other GCC Countries
- Türkiye
- South Africa
- Other African Union
- Rest of Middle East & Africa
- By Vehicle Type
- By Application
- By Component
- By End-use
- By Business Model
- By Country
- Market Attractiveness Analysis
- By Country
- By Vehicle Type
- By Application
- By Component
- By End-use
- By Business Model
- Key Takeaways
- Key Countries Market Analysis
- USA
- Pricing Analysis
- Market Share Analysis, 2025
- By Vehicle Type
- By Application
- By Component
- By End-use
- By Business Model
- Canada
- Pricing Analysis
- Market Share Analysis, 2025
- By Vehicle Type
- By Application
- By Component
- By End-use
- By Business Model
- Mexico
- Pricing Analysis
- Market Share Analysis, 2025
- By Vehicle Type
- By Application
- By Component
- By End-use
- By Business Model
- Brazil
- Pricing Analysis
- Market Share Analysis, 2025
- By Vehicle Type
- By Application
- By Component
- By End-use
- By Business Model
- Chile
- Pricing Analysis
- Market Share Analysis, 2025
- By Vehicle Type
- By Application
- By Component
- By End-use
- By Business Model
- Germany
- Pricing Analysis
- Market Share Analysis, 2025
- By Vehicle Type
- By Application
- By Component
- By End-use
- By Business Model
- UK
- Pricing Analysis
- Market Share Analysis, 2025
- By Vehicle Type
- By Application
- By Component
- By End-use
- By Business Model
- Italy
- Pricing Analysis
- Market Share Analysis, 2025
- By Vehicle Type
- By Application
- By Component
- By End-use
- By Business Model
- Spain
- Pricing Analysis
- Market Share Analysis, 2025
- By Vehicle Type
- By Application
- By Component
- By End-use
- By Business Model
- France
- Pricing Analysis
- Market Share Analysis, 2025
- By Vehicle Type
- By Application
- By Component
- By End-use
- By Business Model
- India
- Pricing Analysis
- Market Share Analysis, 2025
- By Vehicle Type
- By Application
- By Component
- By End-use
- By Business Model
- ASEAN
- Pricing Analysis
- Market Share Analysis, 2025
- By Vehicle Type
- By Application
- By Component
- By End-use
- By Business Model
- Australia & New Zealand
- Pricing Analysis
- Market Share Analysis, 2025
- By Vehicle Type
- By Application
- By Component
- By End-use
- By Business Model
- China
- Pricing Analysis
- Market Share Analysis, 2025
- By Vehicle Type
- By Application
- By Component
- By End-use
- By Business Model
- Japan
- Pricing Analysis
- Market Share Analysis, 2025
- By Vehicle Type
- By Application
- By Component
- By End-use
- By Business Model
- South Korea
- Pricing Analysis
- Market Share Analysis, 2025
- By Vehicle Type
- By Application
- By Component
- By End-use
- By Business Model
- Russia
- Pricing Analysis
- Market Share Analysis, 2025
- By Vehicle Type
- By Application
- By Component
- By End-use
- By Business Model
- Poland
- Pricing Analysis
- Market Share Analysis, 2025
- By Vehicle Type
- By Application
- By Component
- By End-use
- By Business Model
- Hungary
- Pricing Analysis
- Market Share Analysis, 2025
- By Vehicle Type
- By Application
- By Component
- By End-use
- By Business Model
- Kingdom of Saudi Arabia
- Pricing Analysis
- Market Share Analysis, 2025
- By Vehicle Type
- By Application
- By Component
- By End-use
- By Business Model
- Türkiye
- Pricing Analysis
- Market Share Analysis, 2025
- By Vehicle Type
- By Application
- By Component
- By End-use
- By Business Model
- South Africa
- Pricing Analysis
- Market Share Analysis, 2025
- By Vehicle Type
- By Application
- By Component
- By End-use
- By Business Model
- USA
- Market Structure Analysis
- Competition Dashboard
- Competition Benchmarking
- Market Share Analysis of Top Players
- By Regional
- By Vehicle Type
- By Application
- By Component
- By End-use
- By Business Model
- Emerging Startups
- Innovation Benchmarking
- Competition Analysis
- Competition Deep Dive
- EasyMile (FR)
- Overview
- Product Portfolio
- Profitability by Market Segments
- Sales Footprint
- Strategy Overview
- Marketing Strategy
- Product Strategy
- Channel Strategy
- Navya - Gaussin (FR)
- Beep (US)
- Ohmio (NZ)
- EasyMile (FR)
- Case Studies
- Success Stories
- Recent Developments
- Competition Deep Dive
- Assumptions & Acronyms Used


