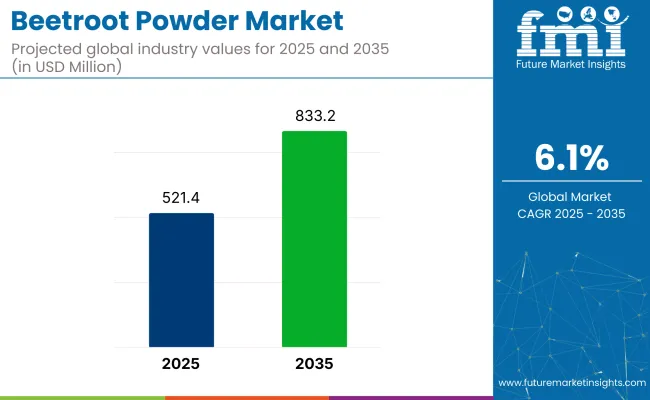
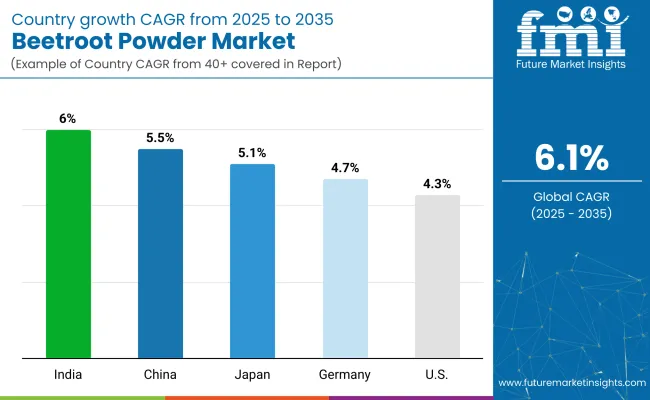
The global beetroot powder market size reached a valuation of USD 474.7 million in 2023. The expanding nutritional value and wide range of applications are projected to be the market's primary growth drivers. The overall sales of beetroot powder products are projected to grow at a robust CAGR of 4.6% between 2023 and 2033, totaling around USD 741.7 million by the end of 2033.
Attributes | Details |
---|---|
Beetroot Powder Market Size (2023) | USD 474.7 million |
Beetroot Powder Market Revenue Forecast (2033) | USD 741.7 million |
Beetroot Powder Market Growth Rate (2023 to 2033) | 4.6% CAGR |
North America Market Share | 33.6% |
Beetroot, also renowned as the table beet, red beet, garden beet, or golden beet, is a taproot of the beet plant. Because beetroot encompasses more sugar than other vegetables, it can be used as a sweetening alternative. Beetroot powder is obtained by grinding or milling dried beetroots. Beetroot powder is used to flavor and color a wide variety of products.
Beetroot formula includes betaine phytochemical, which is vital for cardiovascular system well-being and aids the liver and kidney in processing amino acids. Potassium, phosphorus, chlorine, iodine, iron, magnesium, calcium, copper, sodium, Riboflavin, Thiamine, fiber, and vitamins are all found in beetroot powder. Beetroot powder is used as a supplement because it is high in antioxidants.
Beetroot powder contains high levels of nitrates, potentially increasing the blood's oxygen concentration and relaxing veins. Beetroot powder has applications in the food industry because it can be used in pasta sauce, smoothies, muffins, juice, salad dressings, and so on.
As per Future Market Insights, the global demand for Beetroot Powders is poised to expand at a healthy CAGR of 5.7% during the forecast period between 2022 and 2032, in comparison to the 3.9% CAGR registered from 2016 to 2021. Food industries are intensifying their consumption of beetroot powder since one tablespoon of beetroot powder contains the same nutrients as one beetroot. Its usage in the food industry as a flavoring agent and taste enhancer is becoming increasingly popular among young people as a consequence of increasing health concerns.
One of the global beetroot market drivers is the trend of using beetroot powder to flavor burgers and pizzas. The increased utilization of beetroot powder in cosmetics owing to its higher antioxidant content is cruising beetroot powder in the cosmetic industry globally. The global market for beetroot powder is modestly fragmented.
The presence of multiple active players indicates that the competitive landscape of the market for beetroot powder is incredibly intense. Several market vendors are striving to enhance the quality of their products. In addition, there is a notable increase in demand for beetroot powder from cosmetics and personal care products. This factor promotes market expansion. As a result, these factors are expected to propel the market.
The high cost of the beetroot powder may restrict the market growth over the forecast period.
The North American beetroot powder market is forecast to expand at a healthy 5.5% CAGR. North America is accounting for a market share of 33.6% of the global Beetroot Powder market.
North America, inevitably led by the beet powder industry sizes in Canada, Mexico, and the USA, are assumed to increase substantially over the forecast period. Product growth may be accelerated by increased demand for natural food colors and interest in synthetic colors in the food and beverage market.
Beet powder is extensively used as a natural food coloring in a wide range of foods such as curries, smoothies, gravy, ketchup, pancakes, and red velvet cakes, imparting a red color to develop domestic sales growth.
On the other hand, Western Europe's beetroot powder market is anticipated to accelerate at a CAGR of 5.7% during the forecast period. Europe is accounting for a market share of 27.2% of the global Beetroot Powder market.
The beetroot powder market size in Europe will keep expanding significantly by 2033, led by the United Kingdom, France, and Germany. As the phenomenon of personal care grows, so will the clamor for personal care products, resulting in a wider regional market. Beetroot powder sustains skin elasticity and firmness, creating a popular anti-aging cream and lotion with amazing antioxidant properties that drive local product demand in the European market.
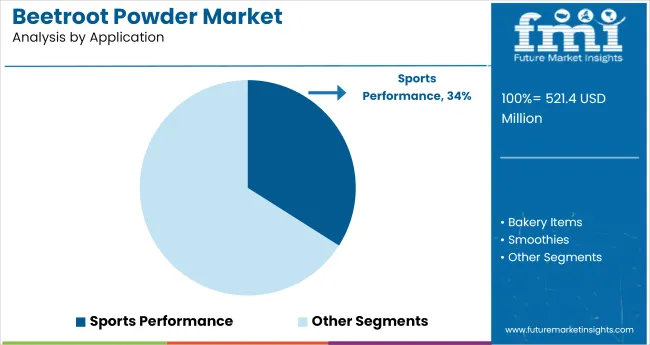
China, Japan, and India are likely to dominate the modern Asia-Pacific powder market, which is predicted to increase substantially by 2033. Increasing customer perception of a healthy lifestyle and increased sports activity to improve sports performance are key attributes in product regional growth.
One of the major market drivers for the market is Asia Pacific's vastly increased urbanization and disposable income growth. As a result, there is a greater demand for fast foods, which fuels market growth. Because of the high nutritional value of beetroot powder, more people are opting for it. Its usage in the cosmetic industry has grown in recent years due to its antioxidant properties in this region.
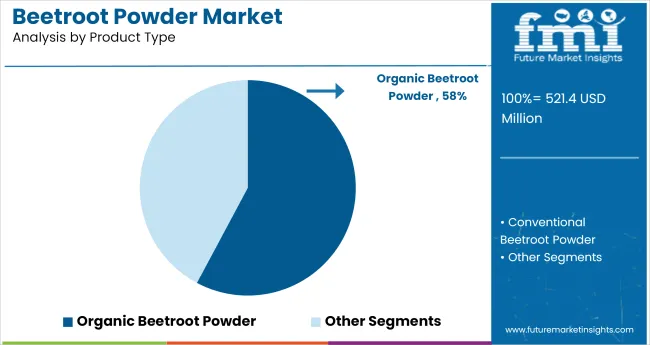
Over the forecast period, the organic beetroot powder product type is expected to show a sufficiently high opportunity. The organic beetroot powder market is anticipated to expand at a CAGR of 4.6% during the forecast period. In terms of volume, the conventional beetroot powder market is projected to increase at a CAGR of 4.48% during the forecast period.
The market for beetroot powder is divided into two segments: ingredient and packaged food. Beetroot powder is employed in the food industry to make soups, curries and gravies, coatings, and as a food color in a wide range of foods. Beetroot powder is in high demand in the industry because it is a natural source for use in the food industry.
Manufacturers are adopting various marketing strategies such as new product launches, geographical expansion, mergers and acquisitions, partnerships, and collaboration to identify the interest of potential buyers and create a larger customer base. For instance,
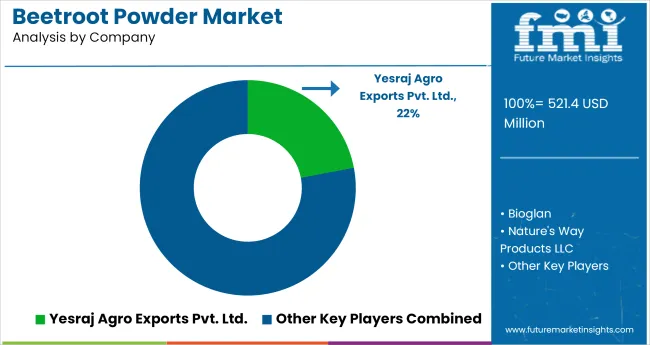
Some of the leading Beetroot Powder device manufacturers include Yesraj Agro Exports Pvt. Ltd., Bioglan, Nature's Way Products LLC, Super Sprout LLC & Juices International Pty Ltd., NutraMarks, Inc., Radiance Ltd., Go Superfood, Natures Aid Ltd., AS-IT-IS, Botanical Ingredients Ltd.
These key Beetroot Powder providers are adopting various strategies, such as new product launches and approvals, partnerships, collaborations, acquisitions, mergers, etc., to increase their sales and gain a competitive edge in the global Beetroot Powder market.
For instance:
Report Attribute | Details |
---|---|
Growth Rate | CAGR of 4.6% from 2023 to 2033 |
Market Value in 2023 | USD 474.7 million |
Market Value in 2033 | USD 741.7 million |
Base Year for Estimation | 2022 |
Historical Data | 2018 to 2022 |
Forecast Period | 2023 to 2033 |
Quantitative Units | Revenue in USD million and CAGR from 2022 to 2032 |
Report Coverage | Revenue Forecast, Company Ranking, Competitive Landscape, Growth Factors, Trends, and Pricing Analysis |
Segments Covered | Type, End Use, Region |
Regions Covered | North America; Latin America; Europe; East Asia; South Asia; Oceania; Middle East and Africa |
Key Countries Profiled | United States of America, Canada, Brazil, Mexico, Germany, United Kingdom, France, Spain, Italy, Russia, China, Japan, South Korea, India, Singapore, Indonesia, Thailand, Australia, New Zealand, GCC Countries, South Africa |
Key Companies Profiled | Yesraj Agro Exports Pvt. Ltd; Bioglan; Nature's Way Products LLC; Super Sprout LLC & Juices International Pty Ltd.; NutraMarks Inc.; Radiance Ltd.; Go Superfood; Natures Aid Ltd.; Botanical Ingredients Ltd |
Table 1: Global Market Value (US$ Million) Forecast by Region, 2018 to 2033
Table 2: Global Market Volume (Tons) Forecast by Region, 2018 to 2033
Table 3: Global Market Value (US$ Million) Forecast by Type, 2018 to 2033
Table 4: Global Market Volume (Tons) Forecast by Type, 2018 to 2033
Table 5: Global Market Value (US$ Million) Forecast by End Use, 2018 to 2033
Table 6: Global Market Volume (Tons) Forecast by End Use, 2018 to 2033
Table 7: North America Market Value (US$ Million) Forecast by Country, 2018 to 2033
Table 8: North America Market Volume (Tons) Forecast by Country, 2018 to 2033
Table 9: North America Market Value (US$ Million) Forecast by Type, 2018 to 2033
Table 10: North America Market Volume (Tons) Forecast by Type, 2018 to 2033
Table 11: North America Market Value (US$ Million) Forecast by End Use, 2018 to 2033
Table 12: North America Market Volume (Tons) Forecast by End Use, 2018 to 2033
Table 13: Latin America Market Value (US$ Million) Forecast by Country, 2018 to 2033
Table 14: Latin America Market Volume (Tons) Forecast by Country, 2018 to 2033
Table 15: Latin America Market Value (US$ Million) Forecast by Type, 2018 to 2033
Table 16: Latin America Market Volume (Tons) Forecast by Type, 2018 to 2033
Table 17: Latin America Market Value (US$ Million) Forecast by End Use, 2018 to 2033
Table 18: Latin America Market Volume (Tons) Forecast by End Use, 2018 to 2033
Table 19: Western Europe Market Value (US$ Million) Forecast by Country, 2018 to 2033
Table 20: Western Europe Market Volume (Tons) Forecast by Country, 2018 to 2033
Table 21: Western Europe Market Value (US$ Million) Forecast by Type, 2018 to 2033
Table 22: Western Europe Market Volume (Tons) Forecast by Type, 2018 to 2033
Table 23: Western Europe Market Value (US$ Million) Forecast by End Use, 2018 to 2033
Table 24: Western Europe Market Volume (Tons) Forecast by End Use, 2018 to 2033
Table 25: Eastern Europe Market Value (US$ Million) Forecast by Country, 2018 to 2033
Table 26: Eastern Europe Market Volume (Tons) Forecast by Country, 2018 to 2033
Table 27: Eastern Europe Market Value (US$ Million) Forecast by Type, 2018 to 2033
Table 28: Eastern Europe Market Volume (Tons) Forecast by Type, 2018 to 2033
Table 29: Eastern Europe Market Value (US$ Million) Forecast by End Use, 2018 to 2033
Table 30: Eastern Europe Market Volume (Tons) Forecast by End Use, 2018 to 2033
Table 31: South Asia and Pacific Market Value (US$ Million) Forecast by Country, 2018 to 2033
Table 32: South Asia and Pacific Market Volume (Tons) Forecast by Country, 2018 to 2033
Table 33: South Asia and Pacific Market Value (US$ Million) Forecast by Type, 2018 to 2033
Table 34: South Asia and Pacific Market Volume (Tons) Forecast by Type, 2018 to 2033
Table 35: South Asia and Pacific Market Value (US$ Million) Forecast by End Use, 2018 to 2033
Table 36: South Asia and Pacific Market Volume (Tons) Forecast by End Use, 2018 to 2033
Table 37: East Asia Market Value (US$ Million) Forecast by Country, 2018 to 2033
Table 38: East Asia Market Volume (Tons) Forecast by Country, 2018 to 2033
Table 39: East Asia Market Value (US$ Million) Forecast by Type, 2018 to 2033
Table 40: East Asia Market Volume (Tons) Forecast by Type, 2018 to 2033
Table 41: East Asia Market Value (US$ Million) Forecast by End Use, 2018 to 2033
Table 42: East Asia Market Volume (Tons) Forecast by End Use, 2018 to 2033
Table 43: Middle East and Africa Market Value (US$ Million) Forecast by Country, 2018 to 2033
Table 44: Middle East and Africa Market Volume (Tons) Forecast by Country, 2018 to 2033
Table 45: Middle East and Africa Market Value (US$ Million) Forecast by Type, 2018 to 2033
Table 46: Middle East and Africa Market Volume (Tons) Forecast by Type, 2018 to 2033
Table 47: Middle East and Africa Market Value (US$ Million) Forecast by End Use, 2018 to 2033
Table 48: Middle East and Africa Market Volume (Tons) Forecast by End Use, 2018 to 2033
Figure 1: Global Market Value (US$ Million) by Type, 2023 to 2033
Figure 2: Global Market Value (US$ Million) by End Use, 2023 to 2033
Figure 3: Global Market Value (US$ Million) by Region, 2023 to 2033
Figure 4: Global Market Value (US$ Million) Analysis by Region, 2018 to 2033
Figure 5: Global Market Volume (Tons) Analysis by Region, 2018 to 2033
Figure 6: Global Market Value Share (%) and BPS Analysis by Region, 2023 to 2033
Figure 7: Global Market Y-o-Y Growth (%) Projections by Region, 2023 to 2033
Figure 8: Global Market Value (US$ Million) Analysis by Type, 2018 to 2033
Figure 9: Global Market Volume (Tons) Analysis by Type, 2018 to 2033
Figure 10: Global Market Value Share (%) and BPS Analysis by Type, 2023 to 2033
Figure 11: Global Market Y-o-Y Growth (%) Projections by Type, 2023 to 2033
Figure 12: Global Market Value (US$ Million) Analysis by End Use, 2018 to 2033
Figure 13: Global Market Volume (Tons) Analysis by End Use, 2018 to 2033
Figure 14: Global Market Value Share (%) and BPS Analysis by End Use, 2023 to 2033
Figure 15: Global Market Y-o-Y Growth (%) Projections by End Use, 2023 to 2033
Figure 16: Global Market Attractiveness by Type, 2023 to 2033
Figure 17: Global Market Attractiveness by End Use, 2023 to 2033
Figure 18: Global Market Attractiveness by Region, 2023 to 2033
Figure 19: North America Market Value (US$ Million) by Type, 2023 to 2033
Figure 20: North America Market Value (US$ Million) by End Use, 2023 to 2033
Figure 21: North America Market Value (US$ Million) by Country, 2023 to 2033
Figure 22: North America Market Value (US$ Million) Analysis by Country, 2018 to 2033
Figure 23: North America Market Volume (Tons) Analysis by Country, 2018 to 2033
Figure 24: North America Market Value Share (%) and BPS Analysis by Country, 2023 to 2033
Figure 25: North America Market Y-o-Y Growth (%) Projections by Country, 2023 to 2033
Figure 26: North America Market Value (US$ Million) Analysis by Type, 2018 to 2033
Figure 27: North America Market Volume (Tons) Analysis by Type, 2018 to 2033
Figure 28: North America Market Value Share (%) and BPS Analysis by Type, 2023 to 2033
Figure 29: North America Market Y-o-Y Growth (%) Projections by Type, 2023 to 2033
Figure 30: North America Market Value (US$ Million) Analysis by End Use, 2018 to 2033
Figure 31: North America Market Volume (Tons) Analysis by End Use, 2018 to 2033
Figure 32: North America Market Value Share (%) and BPS Analysis by End Use, 2023 to 2033
Figure 33: North America Market Y-o-Y Growth (%) Projections by End Use, 2023 to 2033
Figure 34: North America Market Attractiveness by Type, 2023 to 2033
Figure 35: North America Market Attractiveness by End Use, 2023 to 2033
Figure 36: North America Market Attractiveness by Country, 2023 to 2033
Figure 37: Latin America Market Value (US$ Million) by Type, 2023 to 2033
Figure 38: Latin America Market Value (US$ Million) by End Use, 2023 to 2033
Figure 39: Latin America Market Value (US$ Million) by Country, 2023 to 2033
Figure 40: Latin America Market Value (US$ Million) Analysis by Country, 2018 to 2033
Figure 41: Latin America Market Volume (Tons) Analysis by Country, 2018 to 2033
Figure 42: Latin America Market Value Share (%) and BPS Analysis by Country, 2023 to 2033
Figure 43: Latin America Market Y-o-Y Growth (%) Projections by Country, 2023 to 2033
Figure 44: Latin America Market Value (US$ Million) Analysis by Type, 2018 to 2033
Figure 45: Latin America Market Volume (Tons) Analysis by Type, 2018 to 2033
Figure 46: Latin America Market Value Share (%) and BPS Analysis by Type, 2023 to 2033
Figure 47: Latin America Market Y-o-Y Growth (%) Projections by Type, 2023 to 2033
Figure 48: Latin America Market Value (US$ Million) Analysis by End Use, 2018 to 2033
Figure 49: Latin America Market Volume (Tons) Analysis by End Use, 2018 to 2033
Figure 50: Latin America Market Value Share (%) and BPS Analysis by End Use, 2023 to 2033
Figure 51: Latin America Market Y-o-Y Growth (%) Projections by End Use, 2023 to 2033
Figure 52: Latin America Market Attractiveness by Type, 2023 to 2033
Figure 53: Latin America Market Attractiveness by End Use, 2023 to 2033
Figure 54: Latin America Market Attractiveness by Country, 2023 to 2033
Figure 55: Western Europe Market Value (US$ Million) by Type, 2023 to 2033
Figure 56: Western Europe Market Value (US$ Million) by End Use, 2023 to 2033
Figure 57: Western Europe Market Value (US$ Million) by Country, 2023 to 2033
Figure 58: Western Europe Market Value (US$ Million) Analysis by Country, 2018 to 2033
Figure 59: Western Europe Market Volume (Tons) Analysis by Country, 2018 to 2033
Figure 60: Western Europe Market Value Share (%) and BPS Analysis by Country, 2023 to 2033
Figure 61: Western Europe Market Y-o-Y Growth (%) Projections by Country, 2023 to 2033
Figure 62: Western Europe Market Value (US$ Million) Analysis by Type, 2018 to 2033
Figure 63: Western Europe Market Volume (Tons) Analysis by Type, 2018 to 2033
Figure 64: Western Europe Market Value Share (%) and BPS Analysis by Type, 2023 to 2033
Figure 65: Western Europe Market Y-o-Y Growth (%) Projections by Type, 2023 to 2033
Figure 66: Western Europe Market Value (US$ Million) Analysis by End Use, 2018 to 2033
Figure 67: Western Europe Market Volume (Tons) Analysis by End Use, 2018 to 2033
Figure 68: Western Europe Market Value Share (%) and BPS Analysis by End Use, 2023 to 2033
Figure 69: Western Europe Market Y-o-Y Growth (%) Projections by End Use, 2023 to 2033
Figure 70: Western Europe Market Attractiveness by Type, 2023 to 2033
Figure 71: Western Europe Market Attractiveness by End Use, 2023 to 2033
Figure 72: Western Europe Market Attractiveness by Country, 2023 to 2033
Figure 73: Eastern Europe Market Value (US$ Million) by Type, 2023 to 2033
Figure 74: Eastern Europe Market Value (US$ Million) by End Use, 2023 to 2033
Figure 75: Eastern Europe Market Value (US$ Million) by Country, 2023 to 2033
Figure 76: Eastern Europe Market Value (US$ Million) Analysis by Country, 2018 to 2033
Figure 77: Eastern Europe Market Volume (Tons) Analysis by Country, 2018 to 2033
Figure 78: Eastern Europe Market Value Share (%) and BPS Analysis by Country, 2023 to 2033
Figure 79: Eastern Europe Market Y-o-Y Growth (%) Projections by Country, 2023 to 2033
Figure 80: Eastern Europe Market Value (US$ Million) Analysis by Type, 2018 to 2033
Figure 81: Eastern Europe Market Volume (Tons) Analysis by Type, 2018 to 2033
Figure 82: Eastern Europe Market Value Share (%) and BPS Analysis by Type, 2023 to 2033
Figure 83: Eastern Europe Market Y-o-Y Growth (%) Projections by Type, 2023 to 2033
Figure 84: Eastern Europe Market Value (US$ Million) Analysis by End Use, 2018 to 2033
Figure 85: Eastern Europe Market Volume (Tons) Analysis by End Use, 2018 to 2033
Figure 86: Eastern Europe Market Value Share (%) and BPS Analysis by End Use, 2023 to 2033
Figure 87: Eastern Europe Market Y-o-Y Growth (%) Projections by End Use, 2023 to 2033
Figure 88: Eastern Europe Market Attractiveness by Type, 2023 to 2033
Figure 89: Eastern Europe Market Attractiveness by End Use, 2023 to 2033
Figure 90: Eastern Europe Market Attractiveness by Country, 2023 to 2033
Figure 91: South Asia and Pacific Market Value (US$ Million) by Type, 2023 to 2033
Figure 92: South Asia and Pacific Market Value (US$ Million) by End Use, 2023 to 2033
Figure 93: South Asia and Pacific Market Value (US$ Million) by Country, 2023 to 2033
Figure 94: South Asia and Pacific Market Value (US$ Million) Analysis by Country, 2018 to 2033
Figure 95: South Asia and Pacific Market Volume (Tons) Analysis by Country, 2018 to 2033
Figure 96: South Asia and Pacific Market Value Share (%) and BPS Analysis by Country, 2023 to 2033
Figure 97: South Asia and Pacific Market Y-o-Y Growth (%) Projections by Country, 2023 to 2033
Figure 98: South Asia and Pacific Market Value (US$ Million) Analysis by Type, 2018 to 2033
Figure 99: South Asia and Pacific Market Volume (Tons) Analysis by Type, 2018 to 2033
Figure 100: South Asia and Pacific Market Value Share (%) and BPS Analysis by Type, 2023 to 2033
Figure 101: South Asia and Pacific Market Y-o-Y Growth (%) Projections by Type, 2023 to 2033
Figure 102: South Asia and Pacific Market Value (US$ Million) Analysis by End Use, 2018 to 2033
Figure 103: South Asia and Pacific Market Volume (Tons) Analysis by End Use, 2018 to 2033
Figure 104: South Asia and Pacific Market Value Share (%) and BPS Analysis by End Use, 2023 to 2033
Figure 105: South Asia and Pacific Market Y-o-Y Growth (%) Projections by End Use, 2023 to 2033
Figure 106: South Asia and Pacific Market Attractiveness by Type, 2023 to 2033
Figure 107: South Asia and Pacific Market Attractiveness by End Use, 2023 to 2033
Figure 108: South Asia and Pacific Market Attractiveness by Country, 2023 to 2033
Figure 109: East Asia Market Value (US$ Million) by Type, 2023 to 2033
Figure 110: East Asia Market Value (US$ Million) by End Use, 2023 to 2033
Figure 111: East Asia Market Value (US$ Million) by Country, 2023 to 2033
Figure 112: East Asia Market Value (US$ Million) Analysis by Country, 2018 to 2033
Figure 113: East Asia Market Volume (Tons) Analysis by Country, 2018 to 2033
Figure 114: East Asia Market Value Share (%) and BPS Analysis by Country, 2023 to 2033
Figure 115: East Asia Market Y-o-Y Growth (%) Projections by Country, 2023 to 2033
Figure 116: East Asia Market Value (US$ Million) Analysis by Type, 2018 to 2033
Figure 117: East Asia Market Volume (Tons) Analysis by Type, 2018 to 2033
Figure 118: East Asia Market Value Share (%) and BPS Analysis by Type, 2023 to 2033
Figure 119: East Asia Market Y-o-Y Growth (%) Projections by Type, 2023 to 2033
Figure 120: East Asia Market Value (US$ Million) Analysis by End Use, 2018 to 2033
Figure 121: East Asia Market Volume (Tons) Analysis by End Use, 2018 to 2033
Figure 122: East Asia Market Value Share (%) and BPS Analysis by End Use, 2023 to 2033
Figure 123: East Asia Market Y-o-Y Growth (%) Projections by End Use, 2023 to 2033
Figure 124: East Asia Market Attractiveness by Type, 2023 to 2033
Figure 125: East Asia Market Attractiveness by End Use, 2023 to 2033
Figure 126: East Asia Market Attractiveness by Country, 2023 to 2033
Figure 127: Middle East and Africa Market Value (US$ Million) by Type, 2023 to 2033
Figure 128: Middle East and Africa Market Value (US$ Million) by End Use, 2023 to 2033
Figure 129: Middle East and Africa Market Value (US$ Million) by Country, 2023 to 2033
Figure 130: Middle East and Africa Market Value (US$ Million) Analysis by Country, 2018 to 2033
Figure 131: Middle East and Africa Market Volume (Tons) Analysis by Country, 2018 to 2033
Figure 132: Middle East and Africa Market Value Share (%) and BPS Analysis by Country, 2023 to 2033
Figure 133: Middle East and Africa Market Y-o-Y Growth (%) Projections by Country, 2023 to 2033
Figure 134: Middle East and Africa Market Value (US$ Million) Analysis by Type, 2018 to 2033
Figure 135: Middle East and Africa Market Volume (Tons) Analysis by Type, 2018 to 2033
Figure 136: Middle East and Africa Market Value Share (%) and BPS Analysis by Type, 2023 to 2033
Figure 137: Middle East and Africa Market Y-o-Y Growth (%) Projections by Type, 2023 to 2033
Figure 138: Middle East and Africa Market Value (US$ Million) Analysis by End Use, 2018 to 2033
Figure 139: Middle East and Africa Market Volume (Tons) Analysis by End Use, 2018 to 2033
Figure 140: Middle East and Africa Market Value Share (%) and BPS Analysis by End Use, 2023 to 2033
Figure 141: Middle East and Africa Market Y-o-Y Growth (%) Projections by End Use, 2023 to 2033
Figure 142: Middle East and Africa Market Attractiveness by Type, 2023 to 2033
Figure 143: Middle East and Africa Market Attractiveness by End Use, 2023 to 2033
Figure 144: Middle East and Africa Market Attractiveness by Country, 2023 to 2033
The United States, the United Kingdom and France dominate the global market.
The market is forecast to register a CAGR of 4.6% through 2033.
From 2018 to 2022, the market registered a CAGR of 3.9%.
Rising health concerns disrupts the current market trends.
The global market size is to reach USD 741.7 million by 2033.
Explore Functional Food Ingredients Insights
Thank you!
You will receive an email from our Business Development Manager. Please be sure to check your SPAM/JUNK folder too.