Beverage Stabilizer Market Size and Share Forecast Outlook 2025 to 2035

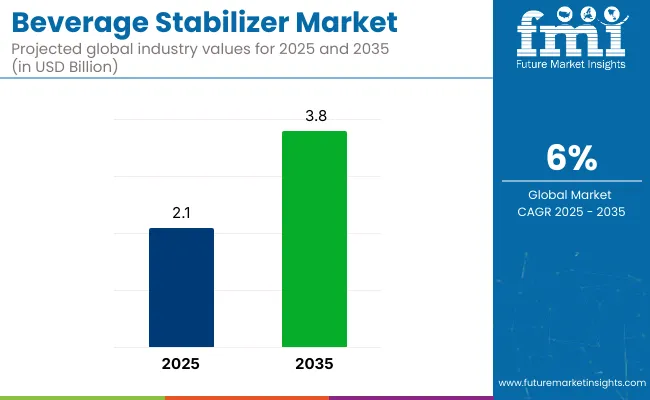
The global beverage stabilizer market is expected to reach USD 2.1 billion by 2025. Global sales are set to grow at 6% CAGR and reach USD 3.8 billion by 2035. Beverage stabilizers operate at the intersection of the global hydrocolloids market, valued at over USD 11 billion in 2025, and the broader functional beverage sector, expected to exceed USD 330 billion by 2030.
Quick Stats of Beverage Stabilizer Market

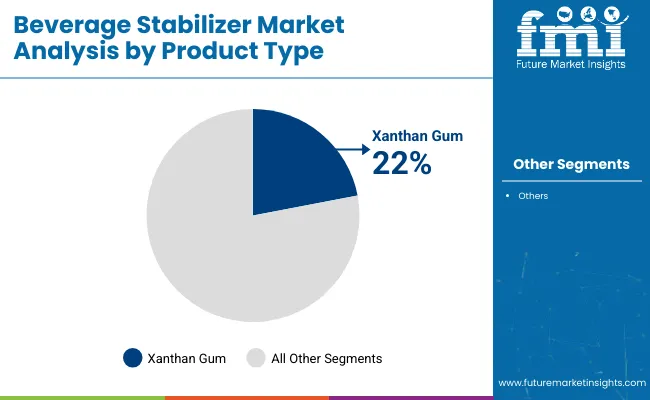
  • Top product type, 2025: Xanthan gum - 22% share
  • Fastest-growing product, 2025 to 2035: Pectin - 6.8% CAGR
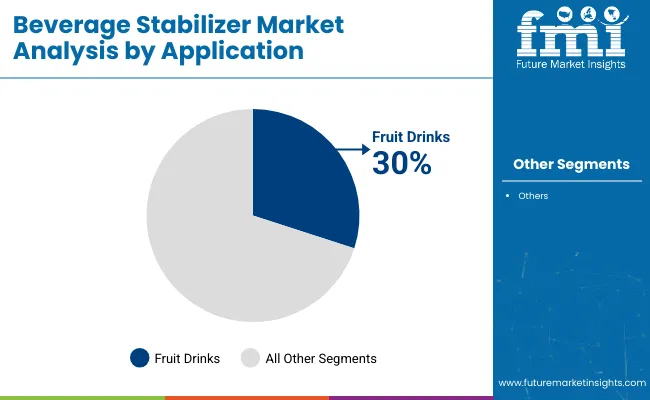
  • Top application, 2025: Fruit drinks - 30% share
  • Largest cmarket, 2025: United States - 22% share

Beverage Stabilizer Market

Metric Value
Market Size in 2025 USD 2.1 billion
Projected Market Size in 2035 USD 3.8 billion
CAGR (2025 to 2035) 6%

These ingredients represent less than 2% of total beverage input by volume but account for over 15% of formulation R&D cost. Positioned within the food additives industry, stabilizers contribute directly to the USD 60 billion clean-label ingredients movement. As plant-based and low-sugar drinks gain market share, stabilizers become essential not just for product performance but for brand positioning across every tier of the global beverage supply chain.

Demand is increasing, led by a rise in functional, plant-based, and shelf-stable beverages across mature consumer markets. Stabilizers have moved from supporting roles to critical components in product formulation. texture, clarity, and consistency are no longer negotiable.

Functional drinks now fill entire retail walls, yet proteins, botanicals and minerals refuse to remain homogenous without viscosity control. Plant-based milks show the same fragility; oat or pea particles settle fast unless a hydrocolloid network intervenes. Carbonated energy drinks push acidity and carbonation beyond what legacy emulsifiers can tolerate, so new stabilizer systems get drafted into service. Sugar reduction strengthens the case. When sucrose is cut, mouthfeel thins, color drifts, aroma fades.

Stabilizers bridge that sensory gap and leave calorie counts intact. Global regulators are intensifying the trend by taxing added sugar and encouraging simpler labels. Reformulation budgets grow, natural gums and citrus fibers displace synthetic blends, cost per kilogram rises, market value expands. Shelf-stable stock-up items gained favor, chilled distribution faced disruption. Extended shelf life demands water activity management, phase stability and haze control across wide temperature swings. Stabilizers sit at the center of those tasks.

Growth migrates from North America and Western Europe to East Asia, Latin America and the Gulf as taste profiles diversify yet technical hurdles remain identical. In that landscape a stabilizer ceases to be a minor cost line; it becomes a strategic lever that decides whether a concept becomes a global SKU or stays an underperforming regional novelty. Investors watching ingredient markets will treat reliable hydrocolloid supply as a proxy for beverage innovation health and will reward suppliers that couple technical support with resilient, traceable sourcing.

Analyzing Beverage Stabilizers Market by Top Investment Segments

Beverage Stabilizer Market Analysis by Top Investment Segments: The market is structured by product type into Gum Arabic, Carboxymethyl Cellulose, Xanthan Gum, Carrageenan, Pectin, and Others; by application into Fruit Drinks, Dairy Beverages, Soft Drinks, Alcoholic Beverages, and Others; and by region into North America, Latin America, Europe, East Asia, South Asia, Oceania, and the Middle East and Africa.

Xanthan Gum Commands Largest Share at 22% in 2025

USD 1.1 billion in 2025 marks xanthan gum’s value in beverage applications and holds nearly 22% share of the market. Volume data collected from major bottling facilities indicates xanthan accounts for roughly 40 percent of all hydrocolloids dosed into ready-to-drink beverages. Shear-stable viscosity at low inclusion rates drives the preference.

Global formulators have shifted toward xanthan to compensate for sugar-reduction mouthfeel loss and to hold insoluble botanicals in suspension. Between 2026 and 2035 the segment is projected to expand at 6.3 annually as dairy-alternative coffees and high-acid energy tonics scale.
  • Pectin is rising fast, backed by clean-label momentum and demand from premium fruit juice and plant-based dairy alternatives.
  • “Others” (like gellan gum and guar blends) are capturing niche innovation zones, particularly in vegan and functional drinks.

Beverage Stabilizer Market Analysis By Product Type

Fruit Drinks Likely to Account for 30% Share in 2025

Fruit drinks lead stabilizer demand with a 30% share in 2025, largely because they require continuous suspension of pulp, fiber, and added nutrients without compromising visual clarity or mouthfeel. These beverages often operate in acidic environments where natural sedimentation is high, making stabilizers like xanthan gum and pectin indispensable.

From shelf-stable juices to fortified blends, stabilizers help maintain texture uniformity, extend shelf life, and prevent phase separation. Moreover, fruit drinks enjoy universal consumption across demographics, driving consistent volume in both developed and emerging markets. Their high sugar content has also prompted brands to experiment with low-calorie versions, where stabilizers play a key role in rebuilding lost viscosity and body.
  • RTD alcoholic beverages are the fastest-growing segment, driven by rising demand for clear, shelf-stable cocktails and hard seltzers with low sugar and calorie claims. Stabilizers enable flavor suspension without clouding or sediment.
  • Dairy beverages remain stable in emerging markets but face flat growth in the West due to plant-based shifts and growing clean-label scrutiny around synthetic gums.

Beverage Stabilizer Market Analysis By Application

Beverage Stabilizer Market Dynamics

Beverage stabilizers are no longer behind-the-scenes additives, they’ve become essential to the success of modern formulations. The rise in demand is fueled by three converging shifts: clean-label expectations, plant-based and protein-rich product innovation, and the explosion of ready-to-drink (RTD) formats. Consumers now demand low-sugar, low-calorie beverages that look good, taste consistent, and remain stable over time.

Without stabilizers like xanthan gum, pectin, and gellan, categories such as oat milk, vitamin water, or RTD cocktails would struggle to survive shelf-life, transport, or retail display. Clean-label trends further push adoption of natural gums like guar and gum Arabic, which are perceived as safer and more familiar. At the same time, beverage brands are leaning into stabilizers to maintain clarity, texture, and flavor without artificial thickeners.

Yet, growth isn’t frictionless. Natural stabilizers face serious raw material volatility especially gum Arabic, which is heavily dependent on politically unstable African sourcing regions. Regulatory hurdles across markets complicate global rollouts, with some ingredients approved in the USA or EU but restricted in Asia or the Middle East. Premium stabilizers also cost more, making adoption harder in price-sensitive regions or for challenger brands. Still, the role of stabilizers is evolving fast.

Ingredient suppliers are no longer just vendors they’re co-development partners, engineering custom gum systems for high-viscosity, high-acid, or micronutrient-rich beverage formats. Sustainability is also reshaping procurement: traceability, upcycled inputs, and carbon labeling are influencing brand decisions. Country-level trends reflect these dynamics Thailand and South Korea outpace mature economies like the USA, Germany, or Japan, thanks to their dynamic RTD and functional drink sectors.
Beverage Stabilizer Market Analysis by Top Countries

Country Wise Analysis Of Beverage Stabilizer Market

United States Beverage Stabilizer Sales Analysis

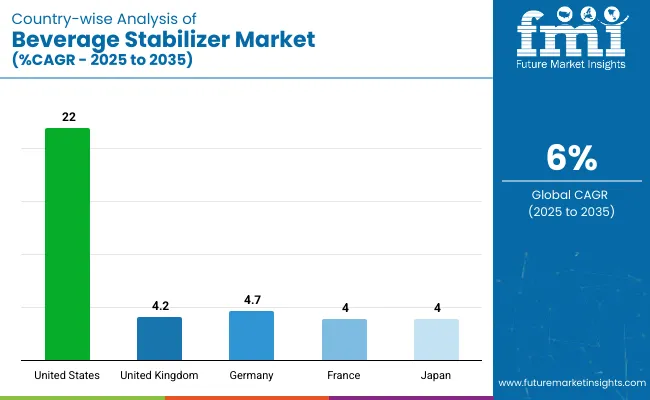
Sales of beverage stabilizers in the USA are projected to reach USD 462 million in 2025, making up 22% of global market share. Demand for xanthan gum, gellan gum, and pectin remains strong due to their widespread use in plant-based milks, protein-enriched smoothies, and sugar-reduced sodas.

Per capita RTD beverage intake stands at 38 liters. Major players focus on clean-label hydrocolloids to comply with FDA-recommended sugar reduction guidelines. Production facilities in Illinois, California, and Texas streamline stabilizer blending for national distribution. Beverage emulsion systems, especially for flavored waters and citrus-based energy drinks, rely on custom gum and starch blends for stable dispersion and visual clarity.

  • The USA holds nearly 22% global share
  • 38 L per capita RTD functional beverage consumption
  • Sales led by xanthan and gellan gum applications
  • Beverage emulsion demand growing in citrus RTDs

UK Beverage Stabilizer Industry Intelligence

The UK beverage stabilizer market is expected to generate USD 88 million in sales in 2025, representing 4.2% of global revenue. Demand for gum Arabic and xanthan gum is high among manufacturers of low-sugar soft drinks and premium non-alcoholic beverages. Average per capita intake of sugar-free beverages is 27 liters.

Reformulation efforts surged following the sugar levy, leading to increased usage of high-efficiency natural stabilizers. Brands use EU-sourced ingredients to meet traceability and sustainability goals. Beverage emulsion usage is growing in adult mixers, botanical sodas, and cloudy tonics where flavor oils require stable dispersion.

  • 4.2% global share held by the UK market in 2025
  • 27 L per capita sugar-free beverage intake
  • High demand for gum Arabic in mixers and tonics
  • Beverage emulsions critical for flavor suspension

Germany Beverage Stabilizer Demand Analysis

Germany is forecasted to produce USD 99 million in beverage stabilizer sales by 2025, contributing 4.7% to the global market. Per capita functional beverage consumption stands at 22 liters, led by fortified waters, RTD protein drinks, and botanical infusions. Demand for citrus fiber and gum Arabic is high, with over 60% of new beverage SKUs labeled additive-free.

Local R&D partnerships support gum innovation for high-solid syrups and premium beverages. The beverage emulsion segment sees steady growth in vitamin-enriched and plant-based clear drinks requiring stable oil-phase dispersion and clarity maintenance.

  • 4.7% global share is held by Germany in 2025
  • 22 L functional beverage intake per capita
  •  Sales driven by additive-free premium SKUs
  •  Emulsion systems used in fortified clear drinks

France Beverage Stabilizer Market

France’s beverage stabilizer market is projected to generate USD 152 million in sales by 2025, accounting for 4.0% of the global stabilizer market. Per capita functional beverage consumption is approximately 22 liters, largely driven by low-sugar sodas, fortified waters, and botanical soft drinks.

Demand is particularly strong for pectin and xanthan gum, which are favored in clean-label or additive-light premium products. French beverage brands increasingly partner with European suppliers to meet stringent traceability and sustainability expectations. Meanwhile, beverage emulsions are growing in importance for crafted mixers, botanical tonics, and vitamin-fortified clear beverages where stable oil dispersion and clarity are essential.

  • 4% global share held by France in 2025
  • 22 L functional beverage intake per capita
  • Sales driven by clean-label pectin and xanthan applications
  • Emulsion systems used in premium clear drinks

Japan Beverage Stabilizer Market

Japan’s beverage stabilizer market will reach USD 84 million in sales by 2025, representing 4.0% of global revenue. Demand is concentrated in low-acyl gellan gum and xanthan for green tea, fiber beverages, and senior-focused nutritional drinks. Per capita green tea beverage intake is 45 liters.

Temperature-sensitive vending formats require gums with high thermal tolerance. Soluble fiber and stabilizer blends are used to formulate gut-health beverages with gentle viscosity. Beverage emulsion applications focus on clear functional teas and citrus-based vitamin drinks, where phase separation must be minimized.

  • 4% global share held by Japan in 2025
  • 45 L green tea beverage intake per capita
  • Sales led by stabilizers in senior nutrition drinks
  • Emulsion usage in citrus RTDs and functional teas

Beverage Stabilizer Market Players and their Strategies

Hydrocolloid pure-plays CP Kelco and Nexira prioritize technical depth in gellan, pectin, and gum Arabic. Agribusiness scale leaders ADM and Cargill leverage integrated supply chains to pair stabilizers with sweeteners and fibers. Clean-label and fiber specialists Ingredion and Tate & Lyle push tapioca starches and soluble fibers for sugar-reduced drinks.

Emulsifier-stabilizer experts Palsgaard and Ashland target high-fat or acidic formulations with carbon-neutral, cellulose-based blends. Nutrition-system providers DuPont, DSM, and Glanbia bundle gums with proteins, probiotics, or micronutrients for medical and sports beverages. Custom solution firms Actaris and Advanced Food Systems serve small-batch brands, while W. R. Grace supplies processing aids for industrial beverages.

  • ADM: Focuses on vertically integrated, plant-based stabilizers with traceable, sustainable supply chains for wellness beverages.
  • Ashland: Specializes in cellulose-based stabilizers tailored for high-acid, high-protein, and emulsified beverages.
  • Cargill: Offers a full hydrocolloid portfolio with integrated sweetener-stabilizer systems for global CPG co-development.
  • CP Kelco: Hydrocolloid specialist focused on gellan and pectin for clean-label, plant-based, and low-sugar drinks.
  • DuPont (IFF): Develops multifunctional systems combining stabilizers with proteins, probiotics, and flavors.
  • Ingredion: Positions clean-label starches and fibers through regional R&D hubs for sugar-reduced drinks.
  • Kerry Group: Integrates flavor, nutrition, and texture in premium beverage solutions with strong consumer insight tools.
  • Palsgaard: Offers carbon-neutral emulsifier-stabilizer systems for fat-rich beverages and APAC markets.
  • Tate & Lyle: Focuses on fiber-rich, clean-label stabilizers aligned with digestive wellness and sugar reduction.
  • DSM: Targets medical and senior beverages with micronutrient-stabilizer combinations backed by clinical data.
  • Actaris: Delivers fast, customized stabilizer solutions for artisanal and small-batch beverage producers.
  • Glanbia Nutritionals: Specializes in texture-enhancing stabilizers for high-protein and performance nutrition drinks.
  • Nexira: Leads in organic gum Arabic with a focus on traceability and emulsion performance.
  • W.R. Grace & Co.: Supplies technical stabilizer aids for industrial beverage and precision formulations.

Report Scope of Beverage Stabilizer Market

Attribute Coverage & Parameters
Market size (2025) USD 2.1 billion
Market size (2035) USD 3.8 billion
CAGR (2025 to 2035) 6.0%
Base year / Historical range 2024 base
Forecast period 2025 to 2035
Unit of measurement Revenue, USD billion
Product-type segments Gum Arabic, Carboxymethyl Cellulose, Xanthan Gum, Carrageenan, Pectin, Others (gellan, guar, blends)
Application segments Fruit Drinks, Dairy Beverages, Soft Drinks, Alcoholic/RTD Beverages, Others (sports, nutraceutical shots)
Regional coverage North America, Latin America, Europe, East Asia, South Asia, Oceania, Middle East & Africa
Deep-dive country cuts United States, United Kingdom, Germany, France, Japan and 40+ countries
Key players profiled CP Kelco, Cargill, Ingredion, Kerry Group, Tate & Lyle, Palsgaard, IFF (DuPont), Givaudan
Additional attributes Revenue share by distribution channel (B2B ingredients vs. contract blending), regulatory landscape summary (FDA, EFSA, Codex); supply-chain risk assessment for natural gums

Key Segmentation

By Product Type:

  • Gum Arabic
  • Carboxymethyl Cellulose
  • Xanthan Gum
  • Carrageenan
  • Pectin
  • Others

By Application:

  • Fruit Drinks
  • Dairy Beverages
  • Soft Drinks
  • Alcoholic Beverages
  • Others

By Region:

  • North America
  • Latin America
  • Europe
  • South Asia
  • East Asia
  • Oceania
  • Middle East Africa

Table of Content

  1. Executive Summary
    • Global Market Outlook
    • Demand-side Trends
    • Supply-side Trends
    • Technology Roadmap Analysis
    • Analysis and Recommendations
  2. Market Overview
    • Market Coverage / Taxonomy
    • Market Definition / Scope / Limitations
  3. Market Background
    • Market Dynamics
      • Drivers
      • Restraints
      • Opportunity
      • Trends
    • Scenario Forecast
      • Demand in Optimistic Scenario
      • Demand in Likely Scenario
      • Demand in Conservative Scenario
    • Opportunity Map Analysis
    • Product Life Cycle Analysis
    • Supply Chain Analysis
      • Supply Side Participants and their Roles
        • Producers
        • Mid-Level Participants (Traders/ Agents/ Brokers)
        • Wholesalers and Distributors
      • Value Added and Value Created at Node in the Supply Chain
      • List of Raw Material Suppliers
      • List of Existing and Potential Buyer’s
    • Investment Feasibility Matrix
    • Value Chain Analysis
      • Profit Margin Analysis
      • Wholesalers and Distributors
      • Retailers
    • PESTLE and Porter’s Analysis
    • Regulatory Landscape
      • By Key Regions
      • By Key Countries
    • Regional Parent Market Outlook
    • Production and Consumption Statistics
    • Import and Export Statistics
  4. Global Market Analysis 2020 to 2024 and Forecast, 2020 to 2035
    • Historical Market Size Value (USD Billion) & Volume (tons) Analysis, 2020 to 2024
    • Current and Future Market Size Value (USD Billion) & Volume (tons) Projections, 2020 to 2035
      • Y-o-Y Growth Trend Analysis
      • Absolute $ Opportunity Analysis
  5. Global Market Pricing Analysis 2020 to 2024 and Forecast 2020 to 2035
  6. Global Market Analysis 2020 to 2024 and Forecast 2020 to 2035, By Product Type
    • Introduction / Key Findings
    • Historical Market Size Value (USD Billion) & Volume (tons) Analysis By Product Type, 2020 to 2024
    • Current and Future Market Size Value (USD Billion) & Volume (tons) Analysis and Forecast By Product Type, 2020 to 2035
      • Gum Arabic
      • Carboxymethyl Cellulose
      • Xanthan Gum
      • Carrageenan
      • Pectin
      • Others
    • Y-o-Y Growth Trend Analysis By Product Type, 2020 to 2024
    • Absolute $ Opportunity Analysis By Product Type, 2020 to 2035
  7. Global Market Analysis 2020 to 2024 and Forecast 2020 to 2035, By Application
    • Introduction / Key Findings
    • Historical Market Size Value (USD Billion) & Volume (tons) Analysis By Application, 2020 to 2024
    • Current and Future Market Size Value (USD Billion) & Volume (tons) Analysis and Forecast By Application, 2020 to 2035
      • Fruit Drinks
      • Dairy Beverages
      • Soft Drinks
      • Alcoholic Beverages
      • Others
    • Y-o-Y Growth Trend Analysis By Application, 2020 to 2024
    • Absolute $ Opportunity Analysis By Application, 2020 to 2035
  8. Global Market Analysis 2020 to 2024 and Forecast 2020 to 2035, By Region
    • Introduction
    • Historical Market Size Value (USD Billion) & Volume (tons) Analysis By Region, 2020 to 2024
    • Current Market Size Value (USD Billion) & Volume (tons) Analysis and Forecast By Region, 2020 to 2035
      • North America
      • Latin America
      • Western Europe
      • Eastern Europe
      • East Asia
      • South Asia & Pacific
      • Middle East and Africa
    • Market Attractiveness Analysis By Region
  9. North America Market Analysis 2020 to 2024 and Forecast 2020 to 2035, By Country
    • Historical Market Size Value (USD Billion) & Volume (tons) Trend Analysis By Market Taxonomy, 2020 to 2024
    • Market Size Value (USD Billion) & Volume (tons) Forecast By Market Taxonomy, 2020 to 2035
      • By Country
        • USA
        • Canada
        • Mexico
      • By Product Type
      • By Application
    • Market Attractiveness Analysis
      • By Country
      • By Product Type
      • By Application
    • Key Takeaways
  10. Latin America Market Analysis 2020 to 2024 and Forecast 2020 to 2035, By Country
    • Historical Market Size Value (USD Billion) & Volume (tons) Trend Analysis By Market Taxonomy, 2020 to 2024
    • Market Size Value (USD Billion) & Volume (tons) Forecast By Market Taxonomy, 2020 to 2035
      • By Country
        • Brazil
        • Argentina
        • Rest of LATAM
      • By Product Type
      • By Application
    • Market Attractiveness Analysis
      • By Country
      • By Product Type
      • By Application
    • Key Takeaways
  11. Western Europe Market Analysis 2020 to 2024 and Forecast 2020 to 2035, By Country
    • Historical Market Size Value (USD Billion) & Volume (tons) Trend Analysis By Market Taxonomy, 2020 to 2024
    • Market Size Value (USD Billion) & Volume (tons) Forecast By Market Taxonomy, 2020 to 2035
      • By Country
        • Germany
        • Italy
        • France
        • UK
        • Spain
        • BENELUX
        • Nordic
        • Rest of W.Europe
      • By Product Type
      • By Application
    • Market Attractiveness Analysis
      • By Country
      • By Product Type
      • By Application
    • Key Takeaways
  12. Eastern Europe Market Analysis 2020 to 2024 and Forecast 2020 to 2035, By Country
    • Historical Market Size Value (USD Billion) & Volume (tons) Trend Analysis By Market Taxonomy, 2020 to 2024
    • Market Size Value (USD Billion) & Volume (tons) Forecast By Market Taxonomy, 2020 to 2035
      • By Country
        • Russia
        • Hungary
        • Poland
        • Balkan & Baltics
        • Rest of E. Europe
      • By Product Type
      • By Application
    • Market Attractiveness Analysis
      • By Country
      • By Product Type
      • By Application
    • Key Takeaways
  13. East Asia Market Analysis 2020 to 2024 and Forecast 2020 to 2035, By Country
    • Historical Market Size Value (USD Billion) & Volume (tons) Trend Analysis By Market Taxonomy, 2020 to 2024
    • Market Size Value (USD Billion) & Volume (tons) Forecast By Market Taxonomy, 2020 to 2035
      • By Country
        • China
        • Japan
        • South Korea
      • By Product Type
      • By Application
    • Market Attractiveness Analysis
      • By Country
      • By Product Type
      • By Application
    • Key Takeaways
  14. South Asia & Pacific Market Analysis 2020 to 2024 and Forecast 2020 to 2035, By Country
    • Historical Market Size Value (USD Billion) & Volume (tons) Trend Analysis By Market Taxonomy, 2020 to 2024
    • Market Size Value (USD Billion) & Volume (tons) Forecast By Market Taxonomy, 2020 to 2035
      • By Country
        • India
        • Australia & New Zealand
        • ASEAN
        • Rest of SAP
      • By Product Type
      • By Application
    • Market Attractiveness Analysis
      • By Country
      • By Product Type
      • By Application
    • Key Takeaways
  15. Middle East and Africa Market Analysis 2020 to 2024 and Forecast 2020 to 2035, By Country
    • Historical Market Size Value (USD Billion) & Volume (tons) Trend Analysis By Market Taxonomy, 2020 to 2024
    • Market Size Value (USD Billion) & Volume (tons) Forecast By Market Taxonomy, 2020 to 2035
      • By Country
        • GCC Countries
        • Northern Africa
        • South Africa
        • Turkiye
        • Rest of MEA
      • By Product Type
      • By Application
    • Market Attractiveness Analysis
      • By Country
      • By Product Type
      • By Application
    • Key Takeaways
  16. Key Countries Market Analysis
    • USA
      • Pricing Analysis
      • Market Share Analysis, 2024
        • By Product Type
        • By Application
    • Canada
      • Pricing Analysis
      • Market Share Analysis, 2024
        • By Product Type
        • By Application
    • Brazil
      • Pricing Analysis
      • Market Share Analysis, 2024
        • By Product Type
        • By Application
    • Mexico
      • Pricing Analysis
      • Market Share Analysis, 2024
        • By Product Type
        • By Application
    • Argentina
      • Pricing Analysis
      • Market Share Analysis, 2024
        • By Product Type
        • By Application
  17. Market Structure Analysis
    • Competition Dashboard
    • Competition Benchmarking
    • Market Share Analysis of Top Players
      • By Regional
      • By Product Type
      • By Application
  18. Competition Analysis
    • Competition Deep Dive
      • CP Kelco
        • Overview
        • Product Portfolio
        • Profitability by Market Segments (Product/Age /Sales Channel/Region)
        • Sales Footprint
        • Strategy Overview
          • Marketing Strategy
          • Product Strategy
          • Channel Strategy
      • Cargill
        • Overview
        • Product Portfolio
        • Profitability by Market Segments (Product/Age /Sales Channel/Region)
        • Sales Footprint
        • Strategy Overview
          • Marketing Strategy
          • Product Strategy
          • Channel Strategy
      • Ingredion
        • Overview
        • Product Portfolio
        • Profitability by Market Segments (Product/Age /Sales Channel/Region)
        • Sales Footprint
        • Strategy Overview
          • Marketing Strategy
          • Product Strategy
          • Channel Strategy
      • Kerry Group
        • Overview
        • Product Portfolio
        • Profitability by Market Segments (Product/Age /Sales Channel/Region)
        • Sales Footprint
        • Strategy Overview
          • Marketing Strategy
          • Product Strategy
          • Channel Strategy
      • Tate & Lyle
        • Overview
        • Product Portfolio
        • Profitability by Market Segments (Product/Age /Sales Channel/Region)
        • Sales Footprint
        • Strategy Overview
          • Marketing Strategy
          • Product Strategy
          • Channel Strategy
      • Palsgaard
        • Overview
        • Product Portfolio
        • Profitability by Market Segments (Product/Age /Sales Channel/Region)
        • Sales Footprint
        • Strategy Overview
          • Marketing Strategy
          • Product Strategy
          • Channel Strategy
      • IFF (DuPont)
        • Overview
        • Product Portfolio
        • Profitability by Market Segments (Product/Age /Sales Channel/Region)
        • Sales Footprint
        • Strategy Overview
          • Marketing Strategy
          • Product Strategy
          • Channel Strategy
      • Givaudan
        • Overview
        • Product Portfolio
        • Profitability by Market Segments (Product/Age /Sales Channel/Region)
        • Sales Footprint
        • Strategy Overview
          • Marketing Strategy
          • Product Strategy
          • Channel Strategy
  19. Assumptions & Acronyms Used
  20. Research Methodology

List of Tables

  • Table 1: Global Market Value (USD Billion) Forecast by Region, 2020 to 2035
  • Table 2: Global Market Volume (tons) Forecast by Region, 2020 to 2035
  • Table 3: Global Market Value (USD Billion) Forecast by Product Type, 2020 to 2035
  • Table 4: Global Market Volume (tons) Forecast by Product Type, 2020 to 2035
  • Table 5: Global Market Value (USD Billion) Forecast by Application, 2020 to 2035
  • Table 6: Global Market Volume (tons) Forecast by Application, 2020 to 2035
  • Table 7: North America Market Value (USD Billion) Forecast by Country, 2020 to 2035
  • Table 8: North America Market Volume (tons) Forecast by Country, 2020 to 2035
  • Table 9: North America Market Value (USD Billion) Forecast by Product Type, 2020 to 2035
  • Table 10: North America Market Volume (tons) Forecast by Product Type, 2020 to 2035
  • Table 11: North America Market Value (USD Billion) Forecast by Application, 2020 to 2035
  • Table 12: North America Market Volume (tons) Forecast by Application, 2020 to 2035
  • Table 13: Latin America Market Value (USD Billion) Forecast by Country, 2020 to 2035
  • Table 14: Latin America Market Volume (tons) Forecast by Country, 2020 to 2035
  • Table 15: Latin America Market Value (USD Billion) Forecast by Product Type, 2020 to 2035
  • Table 16: Latin America Market Volume (tons) Forecast by Product Type, 2020 to 2035
  • Table 17: Latin America Market Value (USD Billion) Forecast by Application, 2020 to 2035
  • Table 18: Latin America Market Volume (tons) Forecast by Application, 2020 to 2035
  • Table 19: Western Europe Market Value (USD Billion) Forecast by Country, 2020 to 2035
  • Table 20: Western Europe Market Volume (tons) Forecast by Country, 2020 to 2035
  • Table 21: Western Europe Market Value (USD Billion) Forecast by Product Type, 2020 to 2035
  • Table 22: Western Europe Market Volume (tons) Forecast by Product Type, 2020 to 2035
  • Table 23: Western Europe Market Value (USD Billion) Forecast by Application, 2020 to 2035
  • Table 24: Western Europe Market Volume (tons) Forecast by Application, 2020 to 2035
  • Table 25: Eastern Europe Market Value (USD Billion) Forecast by Country, 2020 to 2035
  • Table 26: Eastern Europe Market Volume (tons) Forecast by Country, 2020 to 2035
  • Table 27: Eastern Europe Market Value (USD Billion) Forecast by Product Type, 2020 to 2035
  • Table 28: Eastern Europe Market Volume (tons) Forecast by Product Type, 2020 to 2035
  • Table 29: Eastern Europe Market Value (USD Billion) Forecast by Application, 2020 to 2035
  • Table 30: Eastern Europe Market Volume (tons) Forecast by Application, 2020 to 2035
  • Table 31: East Asia Market Value (USD Billion) Forecast by Country, 2020 to 2035
  • Table 32: East Asia Market Volume (tons) Forecast by Country, 2020 to 2035
  • Table 33: East Asia Market Value (USD Billion) Forecast by Product Type, 2020 to 2035
  • Table 34: East Asia Market Volume (tons) Forecast by Product Type, 2020 to 2035
  • Table 35: East Asia Market Value (USD Billion) Forecast by Application, 2020 to 2035
  • Table 36: East Asia Market Volume (tons) Forecast by Application, 2020 to 2035
  • Table 37: South Asia & Pacific Market Value (USD Billion) Forecast by Country, 2020 to 2035
  • Table 38: South Asia & Pacific Market Volume (tons) Forecast by Country, 2020 to 2035
  • Table 39: South Asia & Pacific Market Value (USD Billion) Forecast by Product Type, 2020 to 2035
  • Table 40: South Asia & Pacific Market Volume (tons) Forecast by Product Type, 2020 to 2035
  • Table 41: South Asia & Pacific Market Value (USD Billion) Forecast by Application, 2020 to 2035
  • Table 42: South Asia & Pacific Market Volume (tons) Forecast by Application, 2020 to 2035
  • Table 43: Middle East and Africa Market Value (USD Billion) Forecast by Country, 2020 to 2035
  • Table 44: Middle East and Africa Market Volume (tons) Forecast by Country, 2020 to 2035
  • Table 45: Middle East and Africa Market Value (USD Billion) Forecast by Product Type, 2020 to 2035
  • Table 46: Middle East and Africa Market Volume (tons) Forecast by Product Type, 2020 to 2035
  • Table 47: Middle East and Africa Market Value (USD Billion) Forecast by Application, 2020 to 2035
  • Table 48: Middle East and Africa Market Volume (tons) Forecast by Application, 2020 to 2035

List of Figures

  • Figure 1: Global Market Volume (tons) Forecast 2020 to 2035
  • Figure 2: Global Market Pricing Analysis
  • Figure 3: Global Market Value (USD Billion) Forecast 2020 to 2035
  • Figure 4: Global Market Value Share and BPS Analysis by Product Type, 2025 and 2035
  • Figure 5: Global Market Y-o-Y Growth Comparison by Product Type, 2025 to 2035
  • Figure 6: Global Market Attractiveness Analysis by Product Type
  • Figure 7: Global Market Value Share and BPS Analysis by Application, 2025 and 2035
  • Figure 8: Global Market Y-o-Y Growth Comparison by Application, 2025 to 2035
  • Figure 9: Global Market Attractiveness Analysis by Application
  • Figure 10: Global Market Value (USD Billion) Share and BPS Analysis by Region, 2025 and 2035
  • Figure 11: Global Market Y-o-Y Growth Comparison by Region, 2025 to 2035
  • Figure 12: Global Market Attractiveness Analysis by Region
  • Figure 13: North America Market Incremental $ Opportunity, 2025 to 2035
  • Figure 14: Latin America Market Incremental $ Opportunity, 2025 to 2035
  • Figure 15: Western Europe Market Incremental $ Opportunity, 2025 to 2035
  • Figure 16: Eastern Europe Market Incremental $ Opportunity, 2025 to 2035
  • Figure 17: East Asia Market Incremental $ Opportunity, 2025 to 2035
  • Figure 18: South Asia & Pacific Market Incremental $ Opportunity, 2025 to 2035
  • Figure 19: Middle East and Africa Market Incremental $ Opportunity, 2025 to 2035
  • Figure 20: North America Market Value Share and BPS Analysis by Country, 2025 and 2035
  • Figure 21: North America Market Value Share and BPS Analysis by Product Type, 2025 and 2035
  • Figure 22: North America Market Y-o-Y Growth Comparison by Product Type, 2025 to 2035
  • Figure 23: North America Market Attractiveness Analysis by Product Type
  • Figure 24: North America Market Value Share and BPS Analysis by Application, 2025 and 2035
  • Figure 25: North America Market Y-o-Y Growth Comparison by Application, 2025 to 2035
  • Figure 26: North America Market Attractiveness Analysis by Application
  • Figure 27: Latin America Market Value Share and BPS Analysis by Country, 2025 and 2035
  • Figure 28: Latin America Market Value Share and BPS Analysis by Product Type, 2025 and 2035
  • Figure 29: Latin America Market Y-o-Y Growth Comparison by Product Type, 2025 to 2035
  • Figure 30: Latin America Market Attractiveness Analysis by Product Type
  • Figure 31: Latin America Market Value Share and BPS Analysis by Application, 2025 and 2035
  • Figure 32: Latin America Market Y-o-Y Growth Comparison by Application, 2025 to 2035
  • Figure 33: Latin America Market Attractiveness Analysis by Application
  • Figure 34: Western Europe Market Value Share and BPS Analysis by Country, 2025 and 2035
  • Figure 35: Western Europe Market Value Share and BPS Analysis by Product Type, 2025 and 2035
  • Figure 36: Western Europe Market Y-o-Y Growth Comparison by Product Type, 2025 to 2035
  • Figure 37: Western Europe Market Attractiveness Analysis by Product Type
  • Figure 38: Western Europe Market Value Share and BPS Analysis by Application, 2025 and 2035
  • Figure 39: Western Europe Market Y-o-Y Growth Comparison by Application, 2025 to 2035
  • Figure 40: Western Europe Market Attractiveness Analysis by Application
  • Figure 41: Eastern Europe Market Value Share and BPS Analysis by Country, 2025 and 2035
  • Figure 42: Eastern Europe Market Value Share and BPS Analysis by Product Type, 2025 and 2035
  • Figure 43: Eastern Europe Market Y-o-Y Growth Comparison by Product Type, 2025 to 2035
  • Figure 44: Eastern Europe Market Attractiveness Analysis by Product Type
  • Figure 45: Eastern Europe Market Value Share and BPS Analysis by Application, 2025 and 2035
  • Figure 46: Eastern Europe Market Y-o-Y Growth Comparison by Application, 2025 to 2035
  • Figure 47: Eastern Europe Market Attractiveness Analysis by Application
  • Figure 48: East Asia Market Value Share and BPS Analysis by Country, 2025 and 2035
  • Figure 49: East Asia Market Value Share and BPS Analysis by Product Type, 2025 and 2035
  • Figure 50: East Asia Market Y-o-Y Growth Comparison by Product Type, 2025 to 2035
  • Figure 51: East Asia Market Attractiveness Analysis by Product Type
  • Figure 52: East Asia Market Value Share and BPS Analysis by Application, 2025 and 2035
  • Figure 53: East Asia Market Y-o-Y Growth Comparison by Application, 2025 to 2035
  • Figure 54: East Asia Market Attractiveness Analysis by Application
  • Figure 55: South Asia & Pacific Market Value Share and BPS Analysis by Country, 2025 and 2035
  • Figure 56: South Asia & Pacific Market Value Share and BPS Analysis by Product Type, 2025 and 2035
  • Figure 57: South Asia & Pacific Market Y-o-Y Growth Comparison by Product Type, 2025 to 2035
  • Figure 58: South Asia & Pacific Market Attractiveness Analysis by Product Type
  • Figure 59: South Asia & Pacific Market Value Share and BPS Analysis by Application, 2025 and 2035
  • Figure 60: South Asia & Pacific Market Y-o-Y Growth Comparison by Application, 2025 to 2035
  • Figure 61: South Asia & Pacific Market Attractiveness Analysis by Application
  • Figure 62: Middle East and Africa Market Value Share and BPS Analysis by Country, 2025 and 2035
  • Figure 63: Middle East and Africa Market Value Share and BPS Analysis by Product Type, 2025 and 2035
  • Figure 64: Middle East and Africa Market Y-o-Y Growth Comparison by Product Type, 2025 to 2035
  • Figure 65: Middle East and Africa Market Attractiveness Analysis by Product Type
  • Figure 66: Middle East and Africa Market Value Share and BPS Analysis by Application, 2025 and 2035
  • Figure 67: Middle East and Africa Market Y-o-Y Growth Comparison by Application, 2025 to 2035
  • Figure 68: Middle East and Africa Market Attractiveness Analysis by Application
  • Figure 69: Global Market - Tier Structure Analysis
  • Figure 70: Global Market - Company Share Analysis

Frequently Asked Questions

How big is the beverage stabilizer market and how fast is it growing?

The market is valued at USD 2.1 billion in 2025 and is projected to reach USD 3.8 billion by 2035, expanding at a 6.0% compound annual growth rate during the forecast period.

Which product type accounts for the largest beverage stabilizer market share in 2025?

Xanthan gum leads with roughly 22% of global revenue because it performs reliably across a wide pH and temperature range, making it a versatile choice for dairy, fruit, and low-sugar formulations.

What beverage category uses beverage stabilizers the most?

Fruit drinks command about 30% of stabilizer demand in 2025. They need strong suspension systems to keep pulp and nutrients evenly dispersed while preserving clarity and shelf life.

Why is demand for beverage stabilizers rising so quickly?

Clean-label reformulation, growth in plant-based and protein-rich drinks, and the surge of ready-to-drink (RTD) formats all require advanced gum systems to maintain texture, flavor distribution, and visual appeal without added sugars or synthetic ingredients.

What risks could limit future growth of beverage stabilizers?

Volatile supplies of natural gums, regional regulatory discrepancies, and the higher cost of premium clean-label stabilizers can delay product launches, increase formulation costs, and squeeze margins especially in price-sensitive markets.

Explore Similar Insights

Future Market Insights

Beverage Stabilizer Market