
- Market Size (2026)
- USD 479.3 Mn
- Forecast (2036)
- USD 987.8 Mn
- CAGR (2026 to 2036)
- 7.5%
How big is the Bit Error Rate Testers Market in 2026?
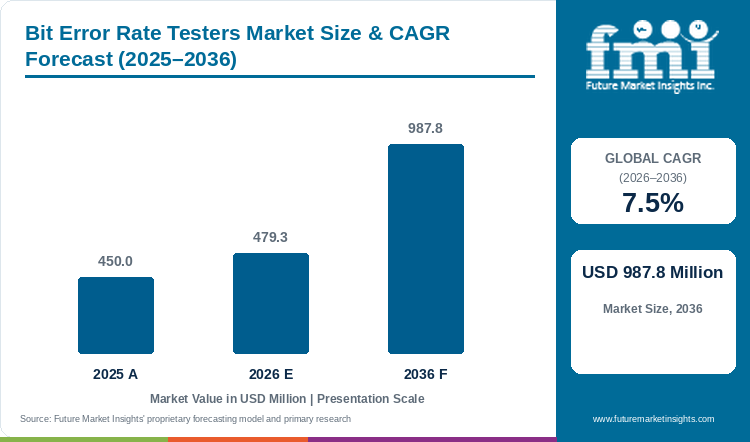
By 2036, FMI expects the global bit error rate testers market to reach USD 987.8 million, growing at 7.5% a year from 2026 to 2036. The market was valued at USD 450.0 million in 2025. FMI estimates USD 479.3 million for 2026.
Bit Error Rate Testers Market Size and Forecast
Table 1: Bit Error Rate Testers Market Size and Forecast
| Market size and forecast | Value |
|---|---|
| Market size in 2025 | USD 450.0 million |
| Estimated market size in 2026 | USD 479.3 million |
| Projected market size by 2036 | USD 987.8 million |
| CAGR from 2026 to 2036 | 7.5% |
Source: Future Market Insights analysis of the bit error rate testers market, 2026.
Instrument replacement is a decision about measurement coverage across several product generations. A laboratory buying additional channels for established interfaces has different requirements from a transceiver manufacturer qualifying a new electrical lane. SHF introduced its redesigned 11106 A error analyzer in June 2026 with PAM4 measurements up to 128.0 Gbps per channel. Keysight's March 2025 interconnect platform announcement combined hardware with software for validation from 200GE to 1600GE. FMI reads these as customers purchasing a measurement process they can repeat across components, complete links and successive designs.
Lower-speed revenue persists alongside the move to faster interfaces. Telecommunications leads end-use spending in 2026, and FMI expects Data Centres and Networking to become the larger end use by 2036. The opportunity for suppliers therefore spans support for established interfaces and investment in faster production and development benches. Lane rate, modulation, supported interfaces and the relationship between hardware and software determine the scope of a purchase. These decisions sit within the wider general purpose electronic test and measurement instruments market, while the valuation here isolates bit error rate testers and their modules.
Key Market Trends & Insights
- Error analysis is extending beyond a single aggregate BER result. VIAVI's March 2026 discussion of 1.6T validation identifies link training, physical coding and forward error correction as connected challenges. The commercial implication is a stronger role for integrated analysis software alongside the measurement hardware.
- Interoperability events expose suppliers to several generations of interfaces at once. OIF's September 2026 ECOC demonstration covered 448G and 224G electrical interfaces alongside management specifications and co-packaging. Support for a published interface requires attention to its specific implementation and maturity.
- Production buyers have a different spending test from research laboratories. Anritsu positions the MP2110A as a combined sampling-oscilloscope and BERT platform for optical-module manufacturing inspection. A faster instrument becomes commercially useful when the additional coverage can be incorporated into repeatable manufacturing work.
Regional Highlights
- China and India expand faster than the global total. The 2036 outlook has China at 21.8% against 20.0% in 2026 and India at 5.0% against 4.0% in 2026.
- Share slips for Japan, Germany and the United Kingdom as revenue grows. FMI's 2036 shares are Japan 6.9% (from 8.0%), Germany 5.4% (from 6.0%) and the United Kingdom 3.5% (from 4.0%).
Analyst Perspective
“A BERT purchase has to survive the next interface revision as well as the current acceptance test. The strongest offer combines the required lane performance with clear software coverage and a credible service path. Production customers also need evidence that results correlate with the equipment their modules will encounter after shipment. Maximum advertised throughput is only one part of that purchasing decision.”
- Nikhil Kaitwade, Principal Consultant, FMI
How is the Bit Error Rate Testers Market segmented?
- By data rate: Up to 10 Gbps, 10 to 28 Gbps, 28 to 56 Gbps, and Above 56 Gbps.
- By end use: Telecommunications, Data Centres and Networking, Semiconductor and Electronics Manufacturing, Aerospace and Defense, and Research and Education.
- By form factor: Benchtop and Laboratory Platforms, Modular and Production Systems, and Handheld and Portable Testers.
- By region: North America, Western Europe, East Asia, South Asia, and Rest of world.
Why does the Up to 10 Gbps segment lead by Data Rate in the Bit Error Rate Testers Market in 2026?
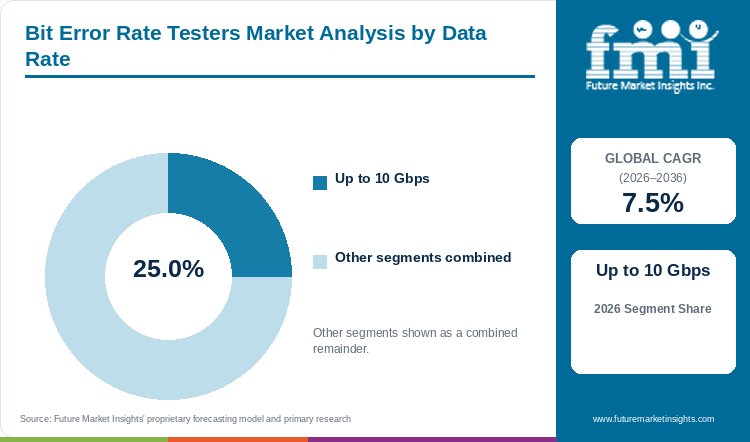
The Up to 10 Gbps segment holds 25.0% of the Bit Error Rate Testers Market by data rate in 2026.
Established interfaces continue to require validation after newer generations become available. The relevant commercial work includes replacement equipment, additional test positions and continued support for products with unchanged interface requirements. VIAVI continues to list a handheld 10G platform alongside higher-rate laboratory and transport offerings. This shows ongoing product coverage for the category.
The forecast gives the mature category a different financial profile from the high-speed segment. Revenue for Up to 10 Gbps reaches USD 140.8 million in 2036 at a 1.6% CAGR. Its share falls to 14.2%. Customers maintaining established equipment therefore remain commercially relevant, but this category supplies a smaller portion of total growth.
Product-life-cycle support becomes especially important in that setting. An installed test arrangement can remain commercially useful while the underlying product continues to ship. An equipment owner needs a clear distinction between maintaining that arrangement and qualifying a replacement. Suppliers serving mature applications must identify which interfaces and automation functions they can continue to support. Continuity for a defined test method provides a more relevant argument than the highest numerical speed in a brochure.
10 to 28 Gbps, 28 to 56 Gbps and Above 56 Gbps together hold the remaining 75.0% by data rate.
Table 2: Data Rate, 2026 Share
| Leading Share | 2026 market share |
|---|---|
| Up to 10 Gbps | 25.0% |
| All Other Segments Combined Share | 75.0% |
Source: Future Market Insights analysis of the bit error rate testers market, 2026.
Why does the Telecommunications segment lead by End Use in the Bit Error Rate Testers Market in 2026?
The Telecommunications segment holds 34.0% of the Bit Error Rate Testers Market by end use in 2026.
Telecommunications supports a broad range of purchasing occasions. Equipment development, manufacturing checks and network activation each use a different instrument format. One test-equipment portfolio explicitly separates laboratory platforms from handheld and remotely operated network test equipment. This breadth helps explain why telecommunications leads end use in the 2026 assessment.
The category is still growing in absolute terms. FMI forecasts telecommunications revenue of USD 296.0 million by 2036 at a 6.2% CAGR. Its declining share reflects the faster expansion of Data Centres and Networking, which reaches USD 378.2 million and 38.3% by 2036. The shift is therefore a change in relative spending.
Suppliers must also separate line-rate network validation from individual electrical-lane characterization. EXFO's BA-4000 combines electrical BER testing with tools addressing forward error correction and linear-drive pluggable optics. An optical-system headline such as 800G can involve multiple lanes and maps to a per-lane speed category only through the lane count. Related demand for optical transmitters informs equipment development priorities, while the tester itself remains a distinct purchase with its own qualification and replacement cycle.
Data Centres and Networking, Semiconductor and Electronics Manufacturing, Aerospace and Defense and Research and Education together hold the remaining 66.0% by end use.
Table 3: End Use, 2026 Share
| Leading Share | 2026 market share |
|---|---|
| Telecommunications | 34.0% |
| All Other Segments Combined Share | 66.0% |
Source: Future Market Insights analysis of the bit error rate testers market, 2026.
Why does the Benchtop and Laboratory Platforms segment lead by Form Factor in the Bit Error Rate Testers Market in 2026?
The Benchtop and Laboratory Platforms segment holds 52.0% of the Bit Error Rate Testers Market by form factor in 2026.
Benchtop and laboratory platforms lead because bit error rate testing is first an engineering task. Designers of transceivers, optical modules and serial interfaces need to stress a receiver with controlled patterns and analyse errors under many conditions, which suits a fixed instrument with a wide configuration range.
Modular production systems and handheld testers compete on different grounds. A production line values throughput and a repeatable relationship between measurement and shipped-product performance, whereas a field technician values weight and quick turn-up.
FMI's 2026 assessment values Benchtop and Laboratory Platforms at USD 249.2 million. Suppliers whose software and hardware remain useful across several configurations hold the stronger claim on this budget.
Modular and Production Systems and Handheld and Portable Testers together represent the remaining 48.0% by form factor.
Table 4: Form Factor, 2026 Share
| Leading Share | 2026 market share |
|---|---|
| Benchtop and Laboratory Platforms | 52.0% |
| All Other Segments Combined Share | 48.0% |
Source: Future Market Insights analysis of the bit error rate testers market, 2026.
What are the key drivers restraints and opportunities?
Faster electrical lanes and optical interconnects support equipment upgrades. Measurement complexity and uncertain product migration increase purchase scrutiny. Production correlation and reusable automation offer suppliers a route to additional business.
Driver
Successive interface generations create new receiver-validation and error-analysis requirements in component development and optical-module production.
Restraint
A complete measurement configuration can require several instruments and software options, making a nominal speed specification an incomplete basis for evaluating expenditure. General-purpose waveform instruments used in the same test setups are covered in FMI's oscilloscope market.
Opportunity
Manufacturers that demonstrate repeatable results across development and production can compete on qualification time and continuing application coverage.
How do purchasing rules and qualification affect bit error rate testers market demand?
The commercial driver is more specific than general growth in data traffic. New interfaces introduce electrical-lane behavior, coding and management requirements, and an existing acceptance process may need extension. A 2026 technical discussion describes several connected changes at 1.6T, including link training and forward error correction. OIF's interoperability programme also brings electrical interfaces and management specifications into a common demonstration setting. Those changes expand the work required before a supplier can release an interoperable product.
FMI expects this to favor instruments whose hardware and software remain useful across several configurations. Customers can add modules, software or channels where the original platform supports the necessary performance. Instrument makers therefore face a revenue mix of upgrades and new systems, with different development and service obligations.
What limits reliable bit error rate testers market supply and quality?
An apparently adequate speed rating can conceal a configuration mismatch. The receiver being evaluated may require a particular modulation, lane arrangement or error-analysis function. EXFO describes an additional challenge in linear-drive pluggable optics: signal impairments on the host side can pass into the optical path without the same conditioning used in retimed products. Purchasing decisions consequently depend on whether the proposed instrument reproduces a relevant operating condition.
Product availability adds a separate risk. Tektronix's BSX discontinuation makes migration planning a current commercial issue. An equipment owner has to check the available service route and the new platform's compatibility with established automation. This can extend evaluation work for an unchanged interface. Manufacturers with clear support terms and application migration assistance have a more concrete argument than a broad promise of future readiness.
Where can suppliers win additional business in the bit error rate testers market?
Production customers need a defensible relationship between measurement results and shipped-product performance. They also have to consider the number of channels available within the required test time. Introspect's SV7C provides parallel pattern generation and analysis across sixteen channels at up to 28.0 Gbps. The example shows that channel density can create differentiation below the highest speed category.
This opportunity is distinct from supplying general board tests. An in-circuit tester addresses a different part of electronics validation. A BERT supplier wins additional business when its particular measurement coverage fits the customer's serial interface or optical-module process. Useful automation, stable calibration and documented integration contribute to that fit.
Bit Error Rate Testers Market by Country (2026 to 2036)
Table 5: Bit Error Rate Testers Market Country Growth Forecast
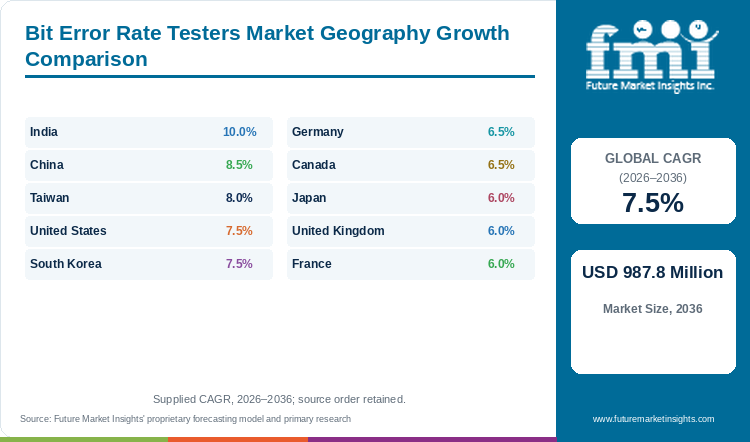
| Country | CAGR, 2026 to 2036 |
|---|---|
| India | 10.0% |
| China | 8.5% |
| Taiwan | 8.0% |
| United States | 7.5% |
| South Korea | 7.5% |
| Germany | 6.5% |
| Canada | 6.5% |
| Japan | 6.0% |
| United Kingdom | 6.0% |
| France | 6.0% |
Source: Future Market Insights analysis of the bit error rate testers market, 2026.
India
C-DOT's End-to-End Optical Network Testbed is intended to connect development with practical product validation. Its stated scope includes multi-vendor interoperability, optical-component characterization and line-card testing at 100G, 200G and 400G. This is relevant infrastructure for domestic suppliers that need access to a broader network environment before deployment.
India has the fastest national growth in the FMI outlook. Revenue is projected to rise from USD 19.2 million in 2026 to USD 49.5 million by 2036, at a 10.0% CAGR. The smaller starting base is important when interpreting that rate. It signals a larger proportional increase, while the United States and China remain much larger markets in absolute revenue. Its 10.0% CAGR runs 2.5 percentage points above the 7.5% global rate, and its global share rises from 4.0% to 5.0%.
For instrument vendors, accessible validation infrastructure can change how customers evaluate equipment. A supplier developing an optical product needs to know whether its laboratory results carry over into a multi-vendor setting. That creates a reason to demonstrate repeatability and compatibility with the customer's intended network tests. Domestic development spans products with different interface generations and different production volumes. Service availability, application training and a clear upgrade route can consequently influence adoption alongside instrument performance. FMI expects growth to follow the progression of local products through validation and commercial release. Public test infrastructure supports that progression, and individual factory or laboratory orders follow their own timing.
China
China's optical-network programme provides a specific setting for testing demand. An October 2025 Ministry of Industry and Information Technology notice calls for 400.0 Gbps and higher metropolitan optical transmission equipment. It sets a 2027 target for at least 50.0% 400.0 Gbps deployment at the outlets of medium and larger metropolitan computing centers.
The purchasing implication is a wider set of qualification tasks across equipment and component suppliers. A network programme creates demand for reliable products and leaves the number of new BERT instruments to each manufacturer's investment plan. Existing benches can remain useful for some interfaces. Additional investment depends on lane requirements, production volume and the ability to validate the intended network configuration.
FMI projects the Chinese market at USD 95.9 million in 2026 and USD 215.7 million in 2036, with an 8.5% CAGR over 2026 to 2036. The growth case is strongest where domestic equipment development moves into repeatable product qualification and manufacture. Suppliers need to distinguish metropolitan line-rate requirements from the electrical-lane rates used in tester classification. They also need a clear support arrangement for the precise hardware and software configuration being purchased. Faster network links make test coverage more demanding, and commercial orders follow individual laboratory and factory investment decisions. This leaves room for both high-speed development systems and additional production test positions at established rates. China supplies 20.0% of global revenue in 2026 and 21.8% by 2036.
Taiwan
Advanced packaging brings the electrical and optical sides of validation closer together in Taiwan. ITRI's fall 2026 publication describes cooperation between Raytek Semiconductor and French company NcodiN on optical interconnects and co-packaged optics. The partners combine packaging and photonics expertise. The announcement describes a development collaboration.
For testing suppliers, packaging changes the point at which useful measurements must be obtained. A component characterized before integration can behave differently in a completed assembly. A development programme therefore has to connect measurements across stages and identify which changes are attributable to the device, package or surrounding link. This creates a commercial argument for application expertise and repeatable comparison between configurations.
FMI forecasts Taiwanese BERT revenue of USD 19.2 million for 2026 and USD 41.2 million for 2036, growing at an 8.0% CAGR. Its role is distinct from a market centered primarily on network activation. The opportunity follows component and assembly qualification and the eventual requirements of manufacturing. Vendors must demonstrate the appropriate lane coverage and access to the measurement point within the customer's design. They also need to show that a proposed solution remains practical when a prototype process is repeated. Collaboration announcements indicate the direction of development, while qualified products and production commitments determine actual instrument demand. A successful supplier explains the measurement configuration precisely and ties any aggregate optical-throughput claim to a stated per-channel specification.
United States
The United States combines instrument development with demand from customers building high-speed computing and network products. Keysight's March 2025 announcement is a direct example of a supplier packaging interconnect hardware with validation software. FMI forecasts national revenue rising from USD 148.6 million in 2026 to USD 304.7 million in 2036, at a 7.5% CAGR during the period. In the bit error rate testers market, the United States grows in line with global revenue at 7.5% a year. The United States' 2026 revenue stands first of ten.
Measurement confidence is a material purchasing issue in this market. NIST's current high-frequency electronics programme addresses calibration and characterization across semiconductor devices and advanced communications. The programme illustrates the technical environment in which instrument vendors have to substantiate performance and measurement uncertainty.
For a commercial buyer, the relevant comparison extends to the instruments already installed in the laboratory. A new BERT may have to operate alongside existing scopes, automation and receiver-test software. Replacing an entire bench has different costs from adding a compatible module. FMI consequently expects suppliers to compete on integration evidence and a credible application-support path as well as lane performance. A strong demonstration identifies the configuration actually offered for sale and avoids a maximum family specification that requires unpriced options. The largest national revenue base therefore supports both advanced purchases and scrutiny of the total cost of maintaining a useful measurement capability.
South Korea
Component commercialization is the central argument for South Korea. ETRI's June 2026 publication described a domestically developed 200.0 Gbps-class photodetector and reported technology transfer to Wooriro. The source presents an advanced device development and a commercialization path.
An early demonstration can use a flexible laboratory arrangement. A manufacturer subsequently has to determine the coverage and test time needed for successive lots. Receiver performance must also be evaluated in the context of the intended optical module and its electrical connections. Those questions remain open after a device-level speed achievement.
FMI forecasts South Korean BERT revenue at USD 24.0 million in 2026 and USD 49.2 million in 2036, equivalent to a 7.5% CAGR. The commercial opportunity lies in equipment that helps domestic component activity progress through qualification and production. Buyers are likely to scrutinize whether an instrument's modulation and error-analysis capabilities match the actual receiver. They also need confidence that the laboratory result can be reproduced after changes in fixtures, packaging or software. Vendors with a clear plan for supporting those changes have a stronger sales case than those relying on a broad AI-investment narrative. Continued semiconductor and optical-device development supports the market, while individual production commitments determine the timing and scale of equipment orders. In the bit error rate testers market, South Korea contributes USD 25.2 million of new revenue, fifth of ten. Its share of global revenue holds at 5.0%.
Germany
Specialist product engineering gives Germany a position in both the supply and use of BERT equipment. Berlin-based SHF introduced its redesigned error analyzer in June 2026, retaining established functionality while adding PAM4 measurement capabilities. The release illustrates how a specialist competes through a defined measurement function and compatibility with its associated pattern generator.
Germany's research infrastructure adds a separate source of demand. Fraunhofer HHI and Japan's NICT demonstrated a prototype for exchanging optical-testbed information between Berlin and Sendai in 2025. That activity focuses on sharing useful network observations across research environments.
National revenue is forecast by FMI to reach USD 53.7 million in 2036 from USD 28.8 million in 2026. The 2026 to 2036 CAGR is 6.5%. Commercially, the country supports purchases where the buyer needs control over the measurement method and a close technical relationship with the supplier. A specialist analyzer can be attractive if its interfaces and support fit an existing development process. Broader platform vendors can compete where customers need several functions within a common automation environment. The practical contest is therefore between configurations that solve a particular qualification problem. Germany moves from 6.0% of global revenue in 2026 to 5.4% in 2036. The USD 24.9 million rise over the decade ranks Germany sixth for increase. Germany's 2026 revenue ranks fourth of ten. Revenue in Germany multiplies 1.9 times by 2036, compared with 2.1 times worldwide.
Canada
Canada's photonics commercialization plans are changing the context for equipment investment. In May 2026, the federal government announced that work would begin to spin off the NRC's Canadian Photonics Fabrication Centre into a commercial entity. The stated purpose includes attracting capital and scaling capability.
FMI forecasts national BERT revenue of USD 9.6 million in 2026 and USD 17.9 million in 2036. The 2026 to 2036 CAGR is 6.5%. The country also hosts Introspect Technology, whose parallel SerDes tester illustrates a commercial focus on channel density and flexible interface testing. Domestic instrument development and photonic-device activity provide different opportunities within the same national market. Revenue in Canada multiplies 1.9 times by 2036, compared with 2.1 times worldwide.
For purchasers moving toward a more commercial production model, instrument decisions have to account for continuing operation and repeatable acceptance criteria. A development bench can prioritize flexibility, while a production arrangement must also support consistent execution and maintenance. The supplier's application knowledge can be valuable during that transition. It remains necessary to distinguish a facility's broad capital requirements from the smaller portion attributable to BERT equipment. FMI expects Canadian growth to follow the conversion of photonics activity into sustained customer programmes, together with ongoing replacement and development demand. Equipment vendors should therefore evaluate the specific qualification workload and commercial milestones behind each opportunity.
Japan
Japan's research base is advancing transmission methods that require careful interpretation of error performance. In May 2025, NICT and Sumitomo Electric reported an experimental transmission of approximately 1.0 petabits per second over 1,808.0 kilometers using a standard-cladding-diameter nineteen-core fiber. The demonstration is a research result.
Its relevance lies in the measurement work required to characterize new transmission systems. Researchers have to relate received information to coding and channel conditions. That kind of activity creates demand for specialist instrumentation, although its purchasing cycle differs from a factory adding standard production stations. Japan also has a domestic instrument supplier in Anritsu, whose current MP2110A documentation emphasizes optical-module manufacturing inspection. Research and production therefore support separate routes into the market.
FMI expects national revenue to increase from USD 38.3 million in 2026 to USD 68.3 million by 2036, representing a 6.0% CAGR. Buyers need instruments matched to the component or transmission experiment and a support organization able to resolve application-specific problems. For production, repeatability and the number of usable test channels remain important. For advanced research, flexibility and access to the necessary measurement functions carry more weight. Instrument vendors serving both groups need separate evidence that a manufacturing configuration is ready for routine use. At 6.0%, the CAGR for Japan is 1.5 points below the global 7.5%.
United Kingdom
The UK AI Hardware Plan published in June 2026 places system-level demonstration and testing within the route to commercialization. It identifies silicon photonics through Southampton-led Cornerstone and heterogeneous integration through Sheffield-led CHIMES among relevant capabilities. The plan is broader than BERT equipment. Its commercial significance is the emphasis on proving hardware in a system that a customer can assess.
FMI projects the United Kingdom market to increase from USD 19.2 million to USD 34.2 million between 2026 and 2036, a 6.0% CAGR. Purchasing opportunities are likely to be concentrated in particular development programmes and shared facilities. A research group with an advanced device may need few instruments and a technically demanding configuration. The equipment supplier must understand that distinction when evaluating the addressable account. The United Kingdom adds USD 15.0 million over the decade. Global revenue attributed to the United Kingdom is 4.0% in 2026 and 3.5% in 2036.
The strongest offer is one that helps a development team produce credible results with a defined path to further validation. That can involve connecting an electrical-lane measurement to optical or packaged-device performance. It can also require adapting existing automation when a prototype changes. Instrument makers therefore benefit from a close understanding of each programme's next qualification milestone. The country's outlook reflects those specialized purchases and continuing replacement demand. A supplier's ability to support a technically small but demanding project can be commercially decisive.
France
France's photonics position is supported by facilities that cover several stages of a device's development. CEA-Leti lists automated on-wafer measurement probers with high-frequency and temperature testing, alongside packaged-device testing and co-packaging capability. This is a direct description of technical infrastructure.
The relevant commercial issue is how a device developer connects electrical performance to an integrated optical product. A measurement arrangement at wafer level can lose access after packaging. Instrument requirements consequently depend on the test stage and the evidence needed by the next customer. This can support demand for specialist configurations even where the number of benches is relatively limited.
FMI expects French revenue to rise from USD 14.4 million in 2026 to USD 25.6 million by 2036, at a 6.0% CAGR. The 2026 Taiwan-France interconnect collaboration also illustrates a route from French photonics development into international packaging relationships. Its significance for testers is the need to compare results across organizations and development stages. Suppliers serving this market need to establish compatibility with existing optical and electrical equipment and clarify the software needed for a complete measurement. Continued technical engagement can help sustain an account as a design changes. France adds USD 11.2 million over the decade. France supplies 3.0% of global revenue in 2026 and 2.6% by 2036. The national opportunity therefore depends on the depth of development and qualification work as well as the eventual scale of manufacture.
Who are the notable companies in the Bit Error Rate Testers Market?
Notable companies in the Bit Error Rate Testers Market include Keysight Technologies, Anritsu, VIAVI Solutions, EXFO and Teledyne LeCroy.
Keysight Technologies, Anritsu, VIAVI Solutions and EXFO address overlapping but different parts of high-speed testing. Keysight's family includes modular physical-layer instruments and integrated interconnect validation. Anritsu combines signal-quality analysis with optical-module manufacturing equipment. VIAVI spans laboratory and network-test applications, while EXFO's BA-4000 documentation focuses on electrical BER testing for components and optical interconnects.
Specialists add distinct configurations. Introspect Technology emphasizes compact parallel SerDes testing, and SHF Communication Technologies provides pattern-generation and error-analysis instruments. These offers can compete for a particular laboratory requirement without matching every feature of a broad platform vendor. Teledyne LeCroy's PeRT3 documentation describes protocol-aware receiver testing, providing a useful comparison for established serial-interface applications.
Historical product names require separate treatment. Tektronix explicitly marks BERTScope BSX as discontinued. Rohde & Schwarz documents a BERT option within a vector signal generator, which is a different application context from a high-speed serial BERT platform. Micram Instruments is also included in the company coverage, with current product availability and support requiring direct commercial confirmation. FMI assigns no company shares, and the ten names include discontinued and application-specific products.
Broad laboratory and network-test platforms: Keysight Technologies, Anritsu, VIAVI Solutions and EXFO.
Specialist and interface-focused instrumentation: Introspect Technology, SHF Communication Technologies and Teledyne LeCroy.
Legacy or application-specific comparison: Tektronix, Rohde & Schwarz and Micram Instruments.
Key Developments in the Bit Error Rate Testers Market
- In June 2026, SHF introduced the 11106 A error analyzer as the successor to its 11104 A, adding PAM4 measurement capabilities and a revised software interface.
Key Players in the Bit Error Rate Testers Market
- Keysight Technologies
- Anritsu
- VIAVI Solutions
- EXFO
- Teledyne LeCroy
- Introspect Technology
- SHF Communication Technologies
- Tektronix
- Rohde & Schwarz
- Micram Instruments
Bit Error Rate Testers Market Report Scope
Table 6: Bit Error Rate Testers Market Report Scope
| Coverage field | Report scope |
|---|---|
| Market definition | Instruments and modules used to measure error performance and signal integrity of digital links in the covered applications. |
| Included products | Standalone BERT instruments and BERT modules for telecom, data-center, semiconductor and electronics testing. |
| Boundaries | Excludes the full value of unrelated oscilloscope, general-purpose generator, network-security and production-test markets. |
| Quantitative Units | USD million |
| Volume basis | Units of standalone instruments and BERT modules, not channels, installed benches or customers. |
| Data-rate coverage | Up to 10 Gbps, 10 to 28 Gbps, 28 to 56 Gbps and Above 56 Gbps. |
| End-use coverage | Telecommunications, Data Centres and Networking, Semiconductor and Electronics Manufacturing, Aerospace and Defense, Research and Education. |
| Geographic coverage | United States, China, Japan, Germany, South Korea, India, United Kingdom, Taiwan, France and Canada. |
| Competitive coverage | Ten named companies, with active platforms distinguished from specialist, application-specific and legacy references. |
| Form Factor coverage | Benchtop and Laboratory Platforms, Modular and Production Systems, Handheld and Portable Testers. |
Source: Future Market Insights analysis of the bit error rate testers market, 2026.
Bit Error Rate Testers Market Research Methodology
The assessment combines FMI's market, segment, volume and country outlook with secondary review of original manufacturer documentation and public research and policy sources. Analysis distinguishes individual-lane capability from aggregate network throughput and keeps standalone instruments separate from module and channel counts. Competitive positions reflect documented product roles and current availability. Forecast statements, shares and country comparisons use the same 2026 to 2036 basis as the global outlook.
Bit Error Rate Testers Market by Segments
Bit Error Rate Testers Market segmented by Data Rate:
- Up to 10 Gbps
- 10 to 28 Gbps
- 28 to 56 Gbps
- Above 56 Gbps
Bit Error Rate Testers Market segmented by End Use:
- Telecommunications
- Data Centres and Networking
- Semiconductor and Electronics Manufacturing
- Aerospace and Defense
- Research and Education
Bit Error Rate Testers Market segmented by Form Factor:
- Benchtop and Laboratory Platforms
- Modular and Production Systems
- Handheld and Portable Testers
Bit Error Rate Testers Market by Region
- North America
- United States
- Canada
- Western Europe
- Germany
- United Kingdom
- France
- East Asia
- China
- Japan
- South Korea
- Taiwan
- South Asia
- India
- Other geographic coverage
- Rest of world, aggregate
Research Sources and Bibliography
- Anritsu. (n.d.). BERTWave MP2110A. Accessed November 9, 2026.
- CEA-Leti. (n.d.). Silicon Photonics. Accessed November 9, 2026.
- Centre for Development of Telematics. (n.d.). End to End Optical Network Testbed. Accessed November 9, 2026.
- Department for Science, Innovation and Technology, United Kingdom. (2026, June 8). UK AI Hardware Plan.
- Electronics and Telecommunications Research Institute. (2026, June). ETRI Develops Korea's First 200Gbps Photodetector. ETRI Webzine, volume 89. https://www.etri.re.kr/webzine/eng/202606/sub05.html
- EXFO. (n.d.). BA-4000 Electrical 800G Bit Error Rate Tester. Accessed November 9, 2026. https://www.exfo.com/en/products/lab-manufacturing-testing/electrical-ber-tester-sampling-oscilloscope/electrical-bit-error-rate-testing/ba-4000-bit-analyzer/
- Fraunhofer Heinrich-Hertz-Institut. (2025, March). Fraunhofer HHI and NICT Unveil International Optical Testbed Data Space. https://www.hhi.fraunhofer.de/en/press/news/2025/fraunhofer-hhi-and-nict-unveil-groundbreaking-international-optical-testbed-data-space-to-enable-ai-ml-driven-networks.html
- Industrial Technology Research Institute. (2026, Fall). New Taiwan-France Partnership for Next-Gen Co-Packaged Optics. ITRI Today, issue 126. https://itritoday.itri.org/126/content/en/unit_03-3.html
- Introspect Technology. (n.d.). SV7C Personalized SerDes Tester. Accessed November 9, 2026. https://introspect.ca/product/sv7c/
- Keysight Technologies. (2025, March 26). Keysight Debuts 1.6T Platform and First-of-its-Kind Software to Automate Validation of Network Interconnect Performance. https://www.keysight.com/in/en/about/newsroom/news-releases/2025/0326-pr25-051-keysight-debuts-1-6t-platform-and-first-of-its-kind-software-to-automate-validation-of-network-interconnect-performance.html
- Keysight Technologies. (n.d.). M8000 Series Bit Error Ratio Testers. Accessed November 9, 2026. https://www.keysight.com/us/en/products/bit-error-ratio-testers/m8000-series-bit-error-ratio-testers
- Ministry of Industry and Information Technology, China. (2025, October 17). Notice on the Metropolitan Millisecond Computing Special Action, document 54 of 2025. Chinese-language policy text dated October 14, 2025. https://app.www.gov.cn/govdata/gov/202510/17/538593/article.html
- National Institute of Information and Communications Technology and Sumitomo Electric Industries. (2025, May 29). World Record Achieved in Transmission Capacity and Distance with 19-core Optical Fiber. https://www.nict.go.jp/en/press/2025/05/29-1.html
- National Institute of Standards and Technology. (n.d.). High-Frequency Electronics. Accessed November 9, 2026. https://www.nist.gov/programs-projects/high-frequency-electronics
- National Research Council Canada. (2026, May 4). Future Spin-off of the NRC's Canadian Photonics Fabrication Centre. https://www.canada.ca/en/national-research-council/news/2026/05/future-spin-off-of-the-nrcs-canadian-photonics-fabrication-centre.html
- Optical Internetworking Forum. (2026). OIF Interoperability Demos and Showcase Displays. Accessed November 9, 2026. https://www.oiforum.com/meetings-events/oif-interoperability-demos-showcase-displays/
- Rohde & Schwarz. (n.d.). SMBV100B Bit Error Rate Tester User Manual, SMBVB-K80 Option. Accessed November 9, 2026. https://www.rohde-schwarz.com/us/manual/rs-smbv100b-bit-error-rate-tester-user-manual_78701-534530.html
- SHF Communication Technologies. (2026, June 1). New Error Analyzer. https://www.shf-communication.com/news/new-error-analyzer/
- Teledyne LeCroy. (n.d.). PeRT3 Phoenix Protocol Enabled Receiver and Transmitter Tolerance Tester Datasheet. Accessed November 9, 2026. https://cdn.teledynelecroy.com/files/pdf/pert3_phoenix_datasheet.pdf
- Tektronix. (n.d.). BERTScope BSX Series Discontinued. Accessed November 9, 2026. https://www.tek.com/en/products/bit-error-rate-tester/bsx-series-bertscope-bit-error-rate-tester
- VIAVI Solutions. (2026, March 6). 1.6TB Getting Ready for Prime Time. https://blog.viavisolutions.com/2026/03/06/1-6tb-getting-ready-for-prime-time/
- VIAVI Solutions. (n.d.). Bit Error Rate Test. Accessed November 9, 2026. https://www.viavisolutions.com/en-us/products/bit-error-rate-test-bert
Table of Content
- Key Takeaways
- Market Size and CAGR
- Top Growth Driver
- Fastest Growing Segment
- Leading Region
- Key Companies
- Emerging Opportunities
- Executive Summary
- Global Market Outlook
- Demand-side Trends
- Supply-side Trends
- Technology Roadmap Analysis
- Analysis and Recommendations
- Analyst Perspective (What is happening? Why now? What should investors know?)
- Key Questions Answered
- How large is the market?
- What is the CAGR?
- What are key trends?
- Which region dominates?
- Who are the leaders?
Read More...
- Market Overview
- Market Coverage / Taxonomy
- Market Definition / Scope / Limitations
- Research Methodology
- Chapter Orientation
- Analytical Lens and Working Hypotheses
- Market Structure, Signals, and Trend Drivers
- Benchmarking and Cross-market Comparability
- Market Sizing, Forecasting, and Opportunity Mapping
- Research Design and Evidence Framework
- Desk Research Programme (Secondary Evidence)
- Expert Input and Fieldwork (Primary Evidence)
- Tooling, Models, and Reference Databases
- Data Engineering and Model Build
- Quality Assurance and Audit Trail
- Market Background
- Market Dynamics (Drivers, Restraints, Opportunity, Trends)
- Scenario Forecast (Optimistic, Likely, Conservative)
- Impact Analysis
- AI Impact
- Sustainability Impact
- Regulatory Impact
- Technology Impact
- Consumer / Buyer Analysis
- Purchase Drivers
- Adoption Barriers
- Buyer Journey
- Opportunity Map Analysis
- Product Life Cycle Analysis
- Supply Chain Analysis
- Investment Feasibility Matrix
- Value Chain Analysis
- PESTLE and Porter's Analysis
- Regulatory Landscape
- Regional Parent Market Outlook
- Production and Consumption Statistics
- Import and Export Statistics
- Global Market Analysis and Forecast, 2021 to 2036
- Historical Market Size Value (USD Million) Analysis, 2021 to 2025
- Current and Future Market Size Value (USD Million) Projections, 2026 to 2036
- Y-o-Y Growth Trend Analysis
- Absolute $ Opportunity Analysis
- Global Market Pricing Analysis, 2021 to 2036
- Global Market Analysis and Forecast, By Data Rate, 2021 to 2036
- Introduction / Key Findings
- Historical Market Size Value (USD Million) Analysis By Data Rate, 2021 to 2025
- Current and Future Market Size Value (USD Million) Analysis and Forecast By Data Rate, 2026 to 2036
- Up to 10 Gbps
- 10 to 28 Gbps
- 28 to 56 Gbps
- Above 56 Gbps
- Y-o-Y Growth Trend Analysis By Data Rate, 2021 to 2025
- Absolute $ Opportunity Analysis By Data Rate, 2026 to 2036
- Global Market Analysis and Forecast, By End Use, 2021 to 2036
- Introduction / Key Findings
- Historical Market Size Value (USD Million) Analysis By End Use, 2021 to 2025
- Current and Future Market Size Value (USD Million) Analysis and Forecast By End Use, 2026 to 2036
- Telecommunications
- Data Centres and Networking
- Semiconductor and Electronics Manufacturing
- Aerospace and Defense
- Research and Education
- Y-o-Y Growth Trend Analysis By End Use, 2021 to 2025
- Absolute $ Opportunity Analysis By End Use, 2026 to 2036
- Global Market Analysis and Forecast, By Form Factor, 2021 to 2036
- Introduction / Key Findings
- Historical Market Size Value (USD Million) Analysis By Form Factor, 2021 to 2025
- Current and Future Market Size Value (USD Million) Analysis and Forecast By Form Factor, 2026 to 2036
- Benchtop and Laboratory Platforms
- Modular and Production Systems
- Handheld and Portable Testers
- Y-o-Y Growth Trend Analysis By Form Factor, 2021 to 2025
- Absolute $ Opportunity Analysis By Form Factor, 2026 to 2036
- Global Market Analysis and Forecast, By Region, 2021 to 2036
- Introduction
- Historical Market Size Value (USD Million) Analysis By Region, 2021 to 2025
- Current Market Size Value (USD Million) Analysis and Forecast By Region, 2026 to 2036
- North America
- Western Europe
- East Asia
- South Asia
- Market Attractiveness Analysis By Region
- North America Market Analysis and Forecast, By Country, 2021 to 2036
- Historical Market Size Value (USD Million) Trend Analysis By Market Taxonomy, 2021 to 2025
- Market Size Value (USD Million) Forecast By Market Taxonomy, 2026 to 2036
- By Country
- United States
- Canada
- By Data Rate
- By End Use
- By Form Factor
- By Country
- Market Attractiveness Analysis
- By Country
- By Data Rate
- By End Use
- By Form Factor
- Key Takeaways
- Western Europe Market Analysis and Forecast, By Country
- Historical Market Size Value (USD Million) Trend Analysis By Market Taxonomy, 2021 to 2025
- Market Size Value (USD Million) Forecast By Market Taxonomy, 2026 to 2036
- By Country
- Germany
- United Kingdom
- France
- By Data Rate
- By End Use
- By Form Factor
- By Country
- Market Attractiveness Analysis
- By Country
- By Data Rate
- By End Use
- By Form Factor
- Key Takeaways
- East Asia Market Analysis and Forecast, By Country
- Historical Market Size Value (USD Million) Trend Analysis By Market Taxonomy, 2021 to 2025
- Market Size Value (USD Million) Forecast By Market Taxonomy, 2026 to 2036
- By Country
- China
- Japan
- South Korea
- Taiwan
- By Data Rate
- By End Use
- By Form Factor
- By Country
- Market Attractiveness Analysis
- By Country
- By Data Rate
- By End Use
- By Form Factor
- Key Takeaways
- South Asia Market Analysis and Forecast, By Country
- Historical Market Size Value (USD Million) Trend Analysis By Market Taxonomy, 2021 to 2025
- Market Size Value (USD Million) Forecast By Market Taxonomy, 2026 to 2036
- By Country
- India
- Other geographic coverage
- Rest of world, aggregate
- By Data Rate
- By End Use
- By Form Factor
- By Country
- Market Attractiveness Analysis
- By Country
- By Data Rate
- By End Use
- By Form Factor
- Key Takeaways
- Key Countries Market Analysis
- United States
- Pricing Analysis
- Market Share Analysis, 2025
- By Data Rate
- By End Use
- By Form Factor
- Canada
- Pricing Analysis
- Market Share Analysis, 2025
- By Data Rate
- By End Use
- By Form Factor
- Germany
- Pricing Analysis
- Market Share Analysis, 2025
- By Data Rate
- By End Use
- By Form Factor
- United Kingdom
- Pricing Analysis
- Market Share Analysis, 2025
- By Data Rate
- By End Use
- By Form Factor
- France
- Pricing Analysis
- Market Share Analysis, 2025
- By Data Rate
- By End Use
- By Form Factor
- India
- Pricing Analysis
- Market Share Analysis, 2025
- By Data Rate
- By End Use
- By Form Factor
- China
- Pricing Analysis
- Market Share Analysis, 2025
- By Data Rate
- By End Use
- By Form Factor
- Japan
- Pricing Analysis
- Market Share Analysis, 2025
- By Data Rate
- By End Use
- By Form Factor
- South Korea
- Pricing Analysis
- Market Share Analysis, 2025
- By Data Rate
- By End Use
- By Form Factor
- Taiwan
- Pricing Analysis
- Market Share Analysis, 2025
- By Data Rate
- By End Use
- By Form Factor
- United States
- Market Structure Analysis
- Competition Dashboard
- Competition Benchmarking
- Market Share Analysis of Top Players
- By Regional
- By Data Rate
- By End Use
- By Form Factor
- Emerging Startups
- Innovation Benchmarking
- Competition Analysis
- Competition Deep Dive
- Keysight Technologies
- Overview
- Product Portfolio
- Profitability by Market Segments
- Sales Footprint
- Strategy Overview
- Marketing Strategy
- Product Strategy
- Channel Strategy
- Anritsu
- VIAVI Solutions
- EXFO
- SHF Communication Technologies
- Introspect Technology
- Tektronix
- Teledyne LeCroy
- Rohde & Schwarz
- Micram Instruments
- Keysight Technologies
- Case Studies
- Success Stories
- Recent Developments
- Competition Deep Dive
- Assumptions & Acronyms Used
List of Tables
- Table 1: Global Market Value (USD Million) Forecast by Region, 2021 to 2036
- Table 2: Global Market Value (USD Million) Forecast by Data Rate, 2021 to 2036
- Table 3: Global Market Value (USD Million) Forecast by End Use, 2021 to 2036
- Table 4: Global Market Value (USD Million) Forecast by Form Factor, 2021 to 2036
- Table 5: North America Market Value (USD Million) Forecast by Country, 2021 to 2036
- Table 6: North America Market Value (USD Million) Forecast by Data Rate, 2021 to 2036
- Table 7: North America Market Value (USD Million) Forecast by End Use, 2021 to 2036
- Table 8: North America Market Value (USD Million) Forecast by Form Factor, 2021 to 2036
- Table 9: Western Europe Market Value (USD Million) Forecast by Country, 2021 to 2036
- Table 10: Western Europe Market Value (USD Million) Forecast by Data Rate, 2021 to 2036
- Table 11: Western Europe Market Value (USD Million) Forecast by End Use, 2021 to 2036
- Table 12: Western Europe Market Value (USD Million) Forecast by Form Factor, 2021 to 2036
- Table 13: East Asia Market Value (USD Million) Forecast by Country, 2021 to 2036
- Table 14: East Asia Market Value (USD Million) Forecast by Data Rate, 2021 to 2036
- Table 15: East Asia Market Value (USD Million) Forecast by End Use, 2021 to 2036
- Table 16: East Asia Market Value (USD Million) Forecast by Form Factor, 2021 to 2036
- Table 17: South Asia Market Value (USD Million) Forecast by Country, 2021 to 2036
- Table 18: South Asia Market Value (USD Million) Forecast by Data Rate, 2021 to 2036
- Table 19: South Asia Market Value (USD Million) Forecast by End Use, 2021 to 2036
- Table 20: South Asia Market Value (USD Million) Forecast by Form Factor, 2021 to 2036
List of Figures
- Figure 1: Global Market Pricing Analysis
- Figure 2: Global Market Value (USD Million) Forecast 2021-2036
- Figure 3: Global Market Value Share and BPS Analysis by Data Rate, 2026 and 2036
- Figure 4: Global Market Y-o-Y Growth Comparison by Data Rate, 2026-2036
- Figure 5: Global Market Attractiveness Analysis by Data Rate
- Figure 6: Global Market Value Share and BPS Analysis by End Use, 2026 and 2036
- Figure 7: Global Market Y-o-Y Growth Comparison by End Use, 2026-2036
- Figure 8: Global Market Attractiveness Analysis by End Use
- Figure 9: Global Market Value Share and BPS Analysis by Form Factor, 2026 and 2036
- Figure 10: Global Market Y-o-Y Growth Comparison by Form Factor, 2026-2036
- Figure 11: Global Market Attractiveness Analysis by Form Factor
- Figure 12: Global Market Value (USD Million) Share and BPS Analysis by Region, 2026 and 2036
- Figure 13: Global Market Y-o-Y Growth Comparison by Region, 2026-2036
- Figure 14: Global Market Attractiveness Analysis by Region
- Figure 15: North America Market Incremental Dollar Opportunity, 2026-2036
- Figure 16: Western Europe Market Incremental Dollar Opportunity, 2026-2036
- Figure 17: East Asia Market Incremental Dollar Opportunity, 2026-2036
- Figure 18: South Asia Market Incremental Dollar Opportunity, 2026-2036
- Figure 19: North America Market Value Share and BPS Analysis by Country, 2026 and 2036
- Figure 20: North America Market Value Share and BPS Analysis by Data Rate, 2026 and 2036
- Figure 21: North America Market Y-o-Y Growth Comparison by Data Rate, 2026-2036
- Figure 22: North America Market Attractiveness Analysis by Data Rate
- Figure 23: North America Market Value Share and BPS Analysis by End Use, 2026 and 2036
- Figure 24: North America Market Y-o-Y Growth Comparison by End Use, 2026-2036
- Figure 25: North America Market Attractiveness Analysis by End Use
- Figure 26: North America Market Value Share and BPS Analysis by Form Factor, 2026 and 2036
- Figure 27: North America Market Y-o-Y Growth Comparison by Form Factor, 2026-2036
- Figure 28: North America Market Attractiveness Analysis by Form Factor
- Figure 29: Western Europe Market Value Share and BPS Analysis by Country, 2026 and 2036
- Figure 30: Western Europe Market Value Share and BPS Analysis by Data Rate, 2026 and 2036
- Figure 31: Western Europe Market Y-o-Y Growth Comparison by Data Rate, 2026-2036
- Figure 32: Western Europe Market Attractiveness Analysis by Data Rate
- Figure 33: Western Europe Market Value Share and BPS Analysis by End Use, 2026 and 2036
- Figure 34: Western Europe Market Y-o-Y Growth Comparison by End Use, 2026-2036
- Figure 35: Western Europe Market Attractiveness Analysis by End Use
- Figure 36: Western Europe Market Value Share and BPS Analysis by Form Factor, 2026 and 2036
- Figure 37: Western Europe Market Y-o-Y Growth Comparison by Form Factor, 2026-2036
- Figure 38: Western Europe Market Attractiveness Analysis by Form Factor
- Figure 39: East Asia Market Value Share and BPS Analysis by Country, 2026 and 2036
- Figure 40: East Asia Market Value Share and BPS Analysis by Data Rate, 2026 and 2036
- Figure 41: East Asia Market Y-o-Y Growth Comparison by Data Rate, 2026-2036
- Figure 42: East Asia Market Attractiveness Analysis by Data Rate
- Figure 43: East Asia Market Value Share and BPS Analysis by End Use, 2026 and 2036
- Figure 44: East Asia Market Y-o-Y Growth Comparison by End Use, 2026-2036
- Figure 45: East Asia Market Attractiveness Analysis by End Use
- Figure 46: East Asia Market Value Share and BPS Analysis by Form Factor, 2026 and 2036
- Figure 47: East Asia Market Y-o-Y Growth Comparison by Form Factor, 2026-2036
- Figure 48: East Asia Market Attractiveness Analysis by Form Factor
- Figure 49: South Asia Market Value Share and BPS Analysis by Country, 2026 and 2036
- Figure 50: South Asia Market Value Share and BPS Analysis by Data Rate, 2026 and 2036
- Figure 51: South Asia Market Y-o-Y Growth Comparison by Data Rate, 2026-2036
- Figure 52: South Asia Market Attractiveness Analysis by Data Rate
- Figure 53: South Asia Market Value Share and BPS Analysis by End Use, 2026 and 2036
- Figure 54: South Asia Market Y-o-Y Growth Comparison by End Use, 2026-2036
- Figure 55: South Asia Market Attractiveness Analysis by End Use
- Figure 56: South Asia Market Value Share and BPS Analysis by Form Factor, 2026 and 2036
- Figure 57: South Asia Market Y-o-Y Growth Comparison by Form Factor, 2026-2036
- Figure 58: South Asia Market Attractiveness Analysis by Form Factor
- Figure 59: Global Market - Tier Structure Analysis
- Figure 60: Global Market - Company Share Analysis
Frequently Asked Questions
How big is the bit error rate testers market in 2026?
FMI estimates the market at USD 479.3 million in 2026, up from USD 450.0 million in 2025. It is forecast to reach USD 987.8 million by 2036 at a 7.5% CAGR.
Which data rate leads the bit error rate testers market in 2026?
Up to 10 Gbps leads by data rate with 25.0% in 2026. All other segments together hold 75.0%.
Which end use and form factor lead in 2026?
Telecommunications holds 34.0% by end use and Benchtop and Laboratory Platforms holds 52.0% by form factor in FMI's 2026 assessment.
Which market is forecast to grow fastest through 2036?
India has the highest forecast CAGR at 10.0% during 2026 to 2036, followed by China at 8.5%.
Why is an aggregate network speed insufficient for comparing testers?
A network's combined throughput can span several electrical lanes. Buyers must compare the required lane rate, modulation and analysis functions within the actual instrument configuration.[6][8]
Preview the report firsthand - request a free sample
Get SampleGet the brochure for pricing and purchase details.
Get PDF
