Boiler Safety System Market Size and Share Forecast Outlook 2025 to 2035

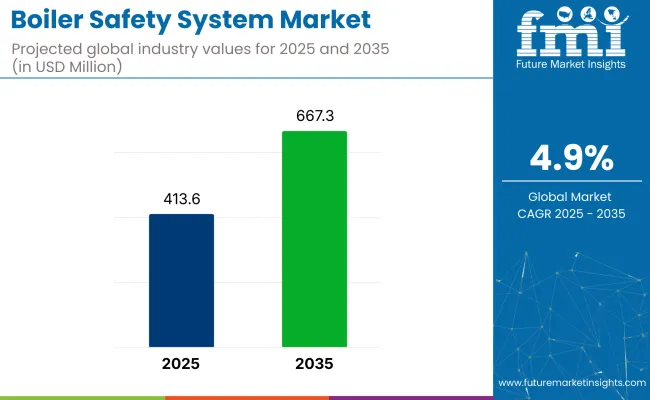
The boiler safety system market is expected to grow from USD 413.6 million in 2025 to USD 667.3 million by 2035, reflecting a CAGR of 4.9% over the forecast period. Growth is expected to be driven by increasing industrial compliance requirements, operational safety mandates, and rising awareness around fire prevention and explosion control in boiler systems.
Quick Stats in Boiler Safety System Market

  • Market Size (2025): USD 413.6 million
  • Market Forecast (2035): USD 667.3 million
  • CAGR (2025 to 2035): 4.9%
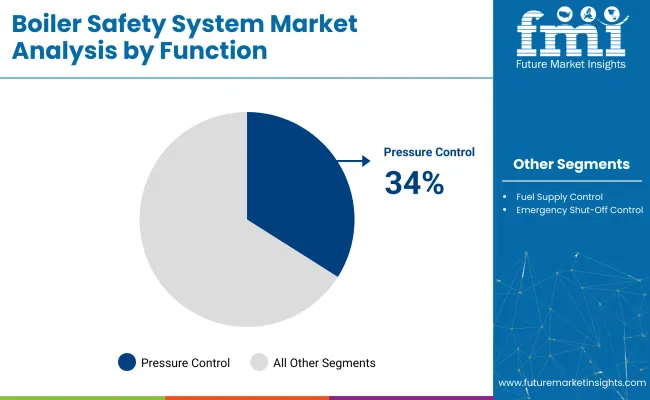
  • Top Function Segment: Pressure Control (34% share in 2025)
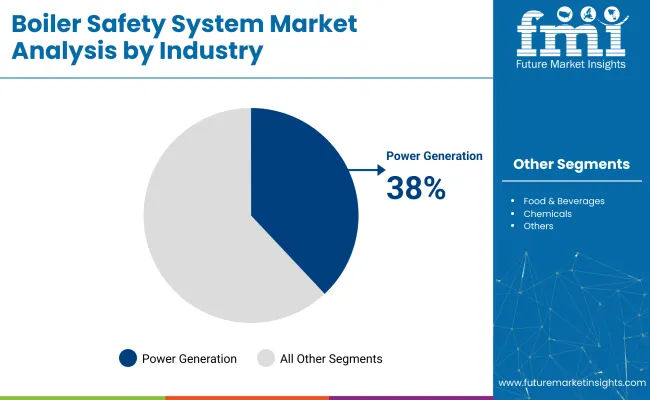
  • Leading Industry: Power Generation (38% share in 2025)
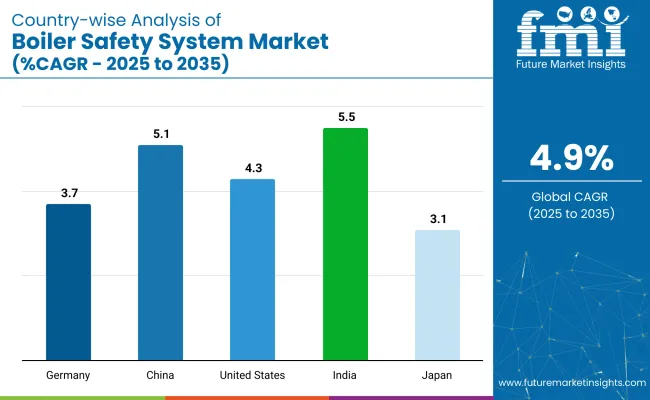
  • Key Growth Country: India (5.5% CAGR)

Boiler Safety System Market

Metric Value
Industry Size (2025E) USD 413.6 million
Industry Value (2035F) USD 667.3 million
CAGR (2025 to 2035) 4.9%

In May 2025, China’s Special Equipment Inspection and Research Institute released new Technical Specifications for Intelligent Safety Monitoring of Boilers. The regulations mandate that new boilers incorporate multimodal AI early-warning systems. These systems combine acoustic imaging, infrared thermal scanning, and pressure fluctuation analytics to detect issues such as tube leaks or coking at least 24 hours in advance, with less than 0.5% false alarms.

Petrochemical zones in Saudi Arabia and Indonesia accelerated the adoption of multi-layered burner management systems to meet insurance-driven safety thresholds. Supply chains are shifting toward cloud-linked safety modules, with real-time diagnostics sent to centralized maintenance hubs. This digitization is reshaping spare parts procurement, lifecycle tracking, and technician response strategies across both industrial and commercial boiler installations.

As of 2025, the boiler safety system market holds a critical but targeted share within its broader industrial segments. Within the global industrial boilers market, it contributes around 5-7%, as safety mechanisms are essential in every boiler installation for regulatory compliance and risk mitigation. In the industrial safety systems market, its share is approximately 3-4%, primarily due to its specialized application compared to broader plant-wide safety controls.

Within the power plant equipment market, it accounts for 2-3%, especially in thermal power facilities where boiler integrity is vital. In the process automation and control market, the share is about 1.5-2.5%, as it integrates with automated shutdown systems. In the HVAC equipment market, it contributes roughly 1-2%, mainly in commercial boiler safety setups.

Analyzing Boiler Safety System Market by Top Investment Segments

Pressure control is projected to lead the function segment with a 34% market share by 2025, while power generation is expected to dominate the industry segment with 38%. Electromechanical boiler safety systems will command the largest share by product type at 40%.

Pressure Control to Lead the Function Segment with 34% Market Share

Pressure control systems are expected to dominate the function segment with a 34% market share in 2025, due to their essential role in preventing boiler overpressure incidents.
  • Automatic regulation of steam pressure helps reduce operational hazards in large industrial and utility boilers, ensuring uninterrupted performance.
  • Advanced sensors and valves contribute to real-time monitoring and shutdown responses.
  • Demand is driven by stricter safety regulations in industries such as oil & gas, chemicals, and power generation, where high-capacity boilers are common.
  • Manufacturers are also integrating digital pressure control features to improve diagnostics and system feedback.

Boiler Safety System Market Analysis By Function

Power Generation to Dominate the Industry Segment with 38% Market Share

The power generation sector is anticipated to hold 38% of the market share in 2025, owing to its high reliance on industrial boilers for thermal energy production.
  • Safety systems installed in power plants are engineered to handle extreme conditions, providing automated responses to pressure and temperature fluctuations.
  • Smart diagnostics also enable better predictive maintenance in these environments.
  • Expansion of coal, nuclear, and biomass-based plants in Asia and Africa is accelerating installations. Global efforts to modernize existing power infrastructure are also pushing the adoption of safety upgrades in legacy boilers.

Boiler Safety System Market Analysis By Industry

Electromechanical Systems to Lead the Product Type Segment with 40% Market Share

Electromechanical systems are projected to account for 40% of the product type segment in 2025, favored for their simplicity and reliability in critical boiler operations.

  • Systems using mechanical actuators and electrical feedback loops offer quick response in high-risk environments. Integration of alarms, sensors, and cut-off switches helps prevent dangerous failures in heating systems.
  • Industrial operators value their long service life and cost-effective maintenance compared to digital-only systems. Increasing usage in retrofitting older boilers is also driving the market, especially in North America and Western Europe.

Top Boiler Safety System Market Dynamics

The boiler safety system market is growing due to increasing industrial safety regulations, growing energy demand, and the need for reliable thermal operations across manufacturing, chemical, and power generation sectors. Safety systems are critical in preventing overpressure, flame failure, and temperature fluctuations.

Strong Demand from Industrial Boilers and Power Plants

Industrial facilities and thermal power plants rely on safety systems to maintain operational control and protect equipment from dangerous failures. Pressure relief valves, flame detectors, water level sensors, and emergency shutdown systems are standard safety components. These systems ensure compliance with safety codes and reduce operational risk.

  • Used in steam boilers and thermal plants to prevent hazardous malfunctions.
  • Includes pressure valves, flame sensors, and water level controllers.
  • Supports safety compliance and reduces the risks of explosions or fire.

Rising Adoption in Commercial Buildings and Institutional Facilities

Hospitals, universities, and large commercial buildings use boiler safety systems to monitor heating infrastructure and ensure uninterrupted service. Demand is growing for intelligent systems that offer remote monitoring, fault detection, and automatic shutdown in emergency scenarios. These systems enhance safety in environments with continuous heating needs.
  • Used in HVAC boilers for hospitals, schools, and offices.
  • Automatic shutdown features help prevent system failure and overheating.
  • Remote monitoring tools support building management and maintenance.

Top Countries Manufacturing, Retrofitting, Regulating, and Driving Demand for Boiler Safety Systems

Country Wise Analysis Of Boiler Safety System Market

Countries CAGR (2025 to 2035)
India 5.5%
China 5.1%
United States 4.3%
Germany 3.7%
Japan 3.1%

India’s momentum is being driven by expansion in industrial boilers, thermal power capacity, and domestic manufacturing. China is advancing its safety system usage through upgrades in process industries and regulatory mandates. In contrast, developed economies such as the United States (4.3%), Germany (3.7%), and Japan (3.1%) are expanding steadily at 0.67-0.84x the global rate.

The USA emphasizes digital flame monitoring and pressure relief systems in large thermal facilities. Germany focuses on boiler automation and emission-reduction safety. Japan prioritizes compact safety modules for space-constrained commercial buildings. As regulatory enforcement tightens and industrial uptime becomes critical, both safety-led and compliance-driven countries are shaping this evolving market.

The report provides insights across 40+ countries. The five below are highlighted for their strategic influence and growth trajectory.

In-depth Analysis of Boiler Safety System Market in India

Indian market is projected to grow at a CAGR of 5.5% through 2035. Growth is being driven by rapid expansion in the textile, chemical, and sugar processing industries. State-run boiler inspectorates are tightening compliance in small and mid-size units.

Local manufacturers are supplying flame safeguard controls, low-water cutoffs, and pressure interlocks to support retrofit cycles. Government schemes promoting industrial safety have improved system adoption in Tier 2 and Tier 3 clusters. India’s position as a manufacturing hub and regulatory enforcer ensures continued spare and retrofit demand.

  • Flame controls and low-water cutoffs are used in mid-size industrial boilers
  • Public-sector monitoring is increasing retrofit adoption in older units
  • Local brands providing safety system kits for quick field installation

Sales Analysis of Boiler Safety System Market in China

China’s market is expected to grow at a CAGR of 5.1% from 2025 to 2035. Industrial boilers used in the food, textile, and metal sectors are being upgraded with automatic shutdown systems and flame scanners. Government pressure on reducing boiler explosions and carbon emissions is accelerating replacement cycles.

Domestic automation firms are bundling safety systems with temperature sensors and digital controllers. Growth is being concentrated in Tier 1 and Tier 2 manufacturing zones. China’s scale and regulatory push make it a critical driver of system-level adoption.

  • Upgrades to automatic shutdown and flame verification in mid-scale boilers
  • Domestic OEMs bundling sensors with safety controllers
  • Tiered enforcement targeting dense industrial provinces

Demand Outlook for Boiler Safety System Market in the United States

The USA market is forecast to grow at a CAGR of 4.3% through 2035. Upgrades in institutional and commercial heating systems are creating demand for digital safety interlocks and dual-fuel flame sensors. Hospitals, universities, and federal buildings are retrofitting existing steam boilers with redundant safety protocols.

NFPA and ASME guidelines are pushing utilities and facility managers to adopt high-spec modules. Aftermarket demand for smart shutoff and high-limit control systems remains strong. USA growth is tied to maintenance-driven upgrades and regulatory compliance.

  • Dual-fuel burner systems retrofitted with advanced safety components
  • Institutional boiler upgrades guided by NFPA/ASME protocols
  • Safety retrofits prioritized in older heating infrastructure

Opportunity Analysis of Boiler Safety System Market in Germany

Germany’s market is projected to grow at a CAGR of 3.7% during the forecast period. Usage is rising in district heating plants, energy recovery boilers, and food processing units. Demand is focused on flame detectors, draft pressure regulators, and low-gas cutoffs in response to EU safety mandates.

Domestic automation companies are integrating safety modules into broader boiler control panels. Energy-efficiency targets are encouraging upgrades to oxygen-trimmed combustion and burner lockout systems. Germany’s market reflects its regulatory precision and focus on low-emission operation.

  • Flame and gas-pressure sensors used in energy-efficient heating units
  • Boiler control upgrades incorporating integrated safety panels
  • EU codes mandating multi-layered safety across small and mid-size plants

Growth Forecast for Boiler Safety System Market in Japan

Demand in Japan is forecast to grow at a CAGR of 3.1% through 2035. Compact commercial boiler systems in hospitals, office buildings, and high-rise housing are adopting space-efficient safety modules. Urban safety codes require integrated shutdown and thermal overload systems.

Japanese OEMs are prioritizing reliability, noise suppression, and low-maintenance flame sensing. System demand is increasing in hospitality and food service sectors that rely on continuous boiler operation. Market growth is being shaped by aging infrastructure and urban space limitations.

  • Safety modules miniaturized for space-constrained commercial buildings
  • Shutdown protocols standardized across aging heat systems
  • Growth led by foodservice, hotel, and hospital boiler upgrades

Leading Boiler Safety System Manufacturers

The boiler safety system market is moderately consolidated, with major players such as Honeywell, Siemens, and Forbs Marshall setting industry benchmarks through advanced automation and monitoring technologies. These companies focus on integrating smart sensors, flame safeguard controls, and pressure regulation systems to improve safety compliance across industrial and commercial heating operations.

Honeywell leads with its scalable burner management systems, while Siemens delivers precision-engineered combustion controls for high-capacity boilers. Forbs Marshall has a strong presence in Asia, offering integrated safety and efficiency solutions.

Danfoss and Endress+Hauser contribute by providing critical components like pressure switches, flow meters, and temperature sensors that ensure operational reliability and prevent system failure under extreme conditions.

Recent Boiler Safety System Industry News

In October 2024, Siemens acquired Danfoss Fire Safety to enhance its fire suppression capabilities. The deal strengthens Siemens position in industrial safety, including boiler systems, by adding high-pressure water-mist technology. The acquisition supports energy-efficient, automated safety solutions and expands Siemens' footprint in the boiler safety system market.

Leading Players in Boiler Safety System Industry

  • Honeywell
  • Siemens
  • Forbs Marshall
  • Danfoss
  • Endress+Hauser

Report Coverage and Scope Summary

Report Attributes Details
Market Size (2025) USD 413.6 million
Projected Market Size (2035) USD 667.3 million
CAGR (2025 to 2035) 4.9%
Base Year for Estimation 2024
Historical Period 2020 to 2024
Projections Period 2025 to 2035
Quantitative Units USD million for market value
Functions Analyzed (Segment 1) Temperature Control, Pressure Control, Fuel Supply Control, Emergency Shut-off Control
Industries Analyzed (Segment 2) Power Generation, Food & Beverages, Chemicals, Oil & Gas, Other Industrial Sectors, Commercial Use
Product Types Analyzed (Segment 3) Electromechanical Controllers, Electronic Controllers
Regions Covered North America, Latin America, Eastern Europe, Western Europe, East Asia, South Asia & Pacific, Middle East & Africa
Countries Covered United States, Canada, Germany, United Kingdom, France, Japan, China, India, South Korea, Brazil
Key Players Honeywell, Siemens, Forbs Marshall, Danfoss, Endress+Hauser
Additional Attributes Dollar sales by function and industry, increasing demand for advanced control systems, focus on industrial safety compliance, and widespread deployment across the power and process industries

Key Segments

By Function:

The market is segmented by function into temperature control, pressure control, fuel supply control, and emergency shut-off control.

By Industry:

Based on industry, the key application areas include power generation, food & beverages, chemicals, oil & gas, other industrial sectors, and commercial use.

By Product Type:

By product type, the market comprises electromechanical controllers and electronic controllers.

By Region:

Regionally, the market spans North America, Latin America, Eastern Europe, Western Europe, East Asia, South Asia & Pacific, and the Middle East & Africa.

Table of Content

  1. Executive Summary
    • Global Market Outlook
    • Demand-side Trends
    • Supply-side Trends
    • Technology Roadmap Analysis
    • Analysis and Recommendations
  2. Market Overview
    • Market Coverage/Taxonomy
    • Market Definition/Scope/Limitations
  3. Market Background
    • Market Dynamics
      • Drivers
      • Restraints
      • Opportunity
      • Trends
    • Scenario Forecast
      • Demand in Optimistic Scenario
      • Demand in Likely Scenario
      • Demand in Conservative Scenario
    • Opportunity Map Analysis
    • Product Life Cycle Analysis
    • Supply Chain Analysis
      • Supply Side Participants and their Roles
        • Producers
        • Mid-Level Participants (Traders/ Agents/ Brokers)
        • Wholesalers and Distributors
      • Value Added and Value Created at Node in the Supply Chain
      • List of Raw Material Suppliers
      • List of Existing and Potential Buyer’s
    • Investment Feasibility Matrix
    • Value Chain Analysis
      • Profit Margin Analysis
      • Wholesalers and Distributors
      • Retailers
    • PESTLE and Porter’s Analysis
    • Regulatory Landscape
      • By Key Regions
      • By Key Countries
    • Regional Parent Market Outlook
    • Production and Consumption Statistics
    • Import and Export Statistics
  4. Global Market Analysis 2020 to 2024 and Forecast, 2025 to 2035
    • Historical Market Size Value (USD Million) & Volume (Units) Analysis, 2020 to 2024
    • Current and Future Market Size Value (USD Million) & Volume (Units) Projections, 2025 to 2035
      • Y-o-Y Growth Trend Analysis
      • Absolute $ Opportunity Analysis
  5. Global Market Pricing Analysis 2020 to 2024 and Forecast 2025 to 2035
  6. Global Market Analysis 2020 to 2024 and Forecast 2025 to 2035, By Function
    • Introduction/Key Findings
    • Historical Market Size Value (USD Million) & Volume (Units) Analysis By Function, 2020 to 2024
    • Current and Future Market Size Value (USD Million) & Volume (Units) Analysis and Forecast By Function, 2025 to 2035
      • Temperature Control
      • Pressure Control
      • Fuel Supply Control
      • Emergency Shut-off Control
    • Y-o-Y Growth Trend Analysis By Function, 2020 to 2024
    • Absolute $ Opportunity Analysis By Function, 2025 to 2035
  7. Global Market Analysis 2020 to 2024 and Forecast 2025 to 2035, By Industry
    • Introduction/Key Findings
    • Historical Market Size Value (USD Million) & Volume (Units) Analysis By Industry, 2020 to 2024
    • Current and Future Market Size Value (USD Million) & Volume (Units) Analysis and Forecast By Industry, 2025 to 2035
      • Power Generation
      • Food & Beverages
      • Chemicals
      • Oil & Gas
      • Other Industrial
      • Commercial
    • Y-o-Y Growth Trend Analysis By Industry, 2020 to 2024
    • Absolute $ Opportunity Analysis By Industry, 2025 to 2035
  8. Global Market Analysis 2020 to 2024 and Forecast 2025 to 2035, By Product Type
    • Introduction/Key Findings
    • Historical Market Size Value (USD Million) & Volume (Units) Analysis By Product Type, 2020 to 2024
    • Current and Future Market Size Value (USD Million) & Volume (Units) Analysis and Forecast By Product Type, 2025 to 2035
      • Electromechanical Controllers
      • Electronic Controllers
    • Y-o-Y Growth Trend Analysis By Product Type, 2020 to 2024
    • Absolute $ Opportunity Analysis By Product Type, 2025 to 2035
  9. Global Market Analysis 2020 to 2024 and Forecast 2025 to 2035, By Region
    • Introduction
    • Historical Market Size Value (USD Million) & Volume (Units) Analysis By Region, 2020 to 2024
    • Current Market Size Value (USD Million) & Volume (Units) Analysis and Forecast By Region, 2025 to 2035
      • North America
      • Latin America
      • Western Europe
      • Eastern Europe
      • East Asia
      • South Asia & Pacific
      • Middle East and Africa
    • Market Attractiveness Analysis By Region
  10. North America Market Analysis 2020 to 2024 and Forecast 2025 to 2035, By Country
    • Historical Market Size Value (USD Million) & Volume (Units) Trend Analysis By Market Taxonomy, 2020 to 2024
    • Market Size Value (USD Million) & Volume (Units) Forecast By Market Taxonomy, 2025 to 2035
      • By Country
        • USA
        • Canada
        • Mexico
      • By Function
      • By Industry
      • By Product Type
    • Market Attractiveness Analysis
      • By Country
      • By Function
      • By Industry
      • By Product Type
    • Key Takeaways
  11. Latin America Market Analysis 2020 to 2024 and Forecast 2025 to 2035, By Country
    • Historical Market Size Value (USD Million) & Volume (Units) Trend Analysis By Market Taxonomy, 2020 to 2024
    • Market Size Value (USD Million) & Volume (Units) Forecast By Market Taxonomy, 2025 to 2035
      • By Country
        • Brazil
        • Argentina
        • Rest of LATAM
      • By Function
      • By Industry
      • By Product Type
    • Market Attractiveness Analysis
      • By Country
      • By Function
      • By Industry
      • By Product Type
    • Key Takeaways
  12. Western Europe Market Analysis 2020 to 2024 and Forecast 2025 to 2035, By Country
    • Historical Market Size Value (USD Million) & Volume (Units) Trend Analysis By Market Taxonomy, 2020 to 2024
    • Market Size Value (USD Million) & Volume (Units) Forecast By Market Taxonomy, 2025 to 2035
      • By Country
        • Germany
        • Italy
        • France
        • UK
        • Spain
        • BENELUX
        • Nordic
        • Rest of W.Europe
      • By Function
      • By Industry
      • By Product Type
    • Market Attractiveness Analysis
      • By Country
      • By Function
      • By Industry
      • By Product Type
    • Key Takeaways
  13. Eastern Europe Market Analysis 2020 to 2024 and Forecast 2025 to 2035, By Country
    • Historical Market Size Value (USD Million) & Volume (Units) Trend Analysis By Market Taxonomy, 2020 to 2024
    • Market Size Value (USD Million) & Volume (Units) Forecast By Market Taxonomy, 2025 to 2035
      • By Country
        • Russia
        • Hungary
        • Poland
        • Balkan & Baltics
        • Rest of E. Europe
      • By Function
      • By Industry
      • By Product Type
    • Market Attractiveness Analysis
      • By Country
      • By Function
      • By Industry
      • By Product Type
    • Key Takeaways
  14. East Asia Market Analysis 2020 to 2024 and Forecast 2025 to 2035, By Country
    • Historical Market Size Value (USD Million) & Volume (Units) Trend Analysis By Market Taxonomy, 2020 to 2024
    • Market Size Value (USD Million) & Volume (Units) Forecast By Market Taxonomy, 2025 to 2035
      • By Country
        • China
        • Japan
        • South Korea
      • By Function
      • By Industry
      • By Product Type
    • Market Attractiveness Analysis
      • By Country
      • By Function
      • By Industry
      • By Product Type
    • Key Takeaways
  15. South Asia & Pacific Market Analysis 2020 to 2024 and Forecast 2025 to 2035, By Country
    • Historical Market Size Value (USD Million) & Volume (Units) Trend Analysis By Market Taxonomy, 2020 to 2024
    • Market Size Value (USD Million) & Volume (Units) Forecast By Market Taxonomy, 2025 to 2035
      • By Country
        • India
        • Australia & New Zealand
        • ASEAN
        • Rest of SAP
      • By Function
      • By Industry
      • By Product Type
    • Market Attractiveness Analysis
      • By Country
      • By Function
      • By Industry
      • By Product Type
    • Key Takeaways
  16. Middle East and Africa Market Analysis 2020 to 2024 and Forecast 2025 to 2035, By Country
    • Historical Market Size Value (USD Million) & Volume (Units) Trend Analysis By Market Taxonomy, 2020 to 2024
    • Market Size Value (USD Million) & Volume (Units) Forecast By Market Taxonomy, 2025 to 2035
      • By Country
        • GCC Countries
        • Northern Africa
        • South Africa
        • Turkiye
        • Rest of MEA
      • By Function
      • By Industry
      • By Product Type
    • Market Attractiveness Analysis
      • By Country
      • By Function
      • By Industry
      • By Product Type
    • Key Takeaways
  17. Key Countries Market Analysis
    • USA
      • Pricing Analysis
      • Market Share Analysis, 2024
        • By Function
        • By Industry
        • By Product Type
    • Canada
      • Pricing Analysis
      • Market Share Analysis, 2024
        • By Function
        • By Industry
        • By Product Type
    • Brazil
      • Pricing Analysis
      • Market Share Analysis, 2024
        • By Function
        • By Industry
        • By Product Type
    • Mexico
      • Pricing Analysis
      • Market Share Analysis, 2024
        • By Function
        • By Industry
        • By Product Type
    • Argentina
      • Pricing Analysis
      • Market Share Analysis, 2024
        • By Function
        • By Industry
        • By Product Type
  18. Market Structure Analysis
    • Competition Dashboard
    • Competition Benchmarking
    • Market Share Analysis of Top Players
      • By Regional
      • By Function
      • By Industry
      • By Product Type
  19. Competition Analysis
    • Competition Deep Dive
      • Honeywell
        • Overview
        • Product Portfolio
        • Profitability by Market Segments (Product/Age /Sales Channel/Region)
        • Sales Footprint
        • Strategy Overview
          • Marketing Strategy
          • Product Strategy
          • Channel Strategy
      • Siemens
        • Overview
        • Product Portfolio
        • Profitability by Market Segments (Product/Age /Sales Channel/Region)
        • Sales Footprint
        • Strategy Overview
          • Marketing Strategy
          • Product Strategy
          • Channel Strategy
      • Forbs Marshall
        • Overview
        • Product Portfolio
        • Profitability by Market Segments (Product/Age /Sales Channel/Region)
        • Sales Footprint
        • Strategy Overview
          • Marketing Strategy
          • Product Strategy
          • Channel Strategy
      • Danfoss
        • Overview
        • Product Portfolio
        • Profitability by Market Segments (Product/Age /Sales Channel/Region)
        • Sales Footprint
        • Strategy Overview
          • Marketing Strategy
          • Product Strategy
          • Channel Strategy
      • Endress+Hauser
        • Overview
        • Product Portfolio
        • Profitability by Market Segments (Product/Age /Sales Channel/Region)
        • Sales Footprint
        • Strategy Overview
          • Marketing Strategy
          • Product Strategy
          • Channel Strategy
  20. Assumptions & Acronyms Used
  21. Research Methodology

List of Tables

  • Table 1: Global Market Value (USD Million) Forecast by Region, 2020-2035
  • Table 2: Global Market Volume (Units) Forecast by Region, 2020-2035
  • Table 3: Global Market Value (USD Million) Forecast by Function, 2020-2035
  • Table 4: Global Market Volume (Units) Forecast by Function, 2020-2035
  • Table 5: Global Market Value (USD Million) Forecast by Industry, 2020-2035
  • Table 6: Global Market Volume (Units) Forecast by Industry, 2020-2035
  • Table 7: Global Market Value (USD Million) Forecast by Product Type, 2020-2035
  • Table 8: Global Market Volume (Units) Forecast by Product Type, 2020-2035
  • Table 9: North America Market Value (USD Million) Forecast by Country, 2020-2035
  • Table 10: North America Market Volume (Units) Forecast by Country, 2020-2035
  • Table 11: North America Market Value (USD Million) Forecast by Function, 2020-2035
  • Table 12: North America Market Volume (Units) Forecast by Function, 2020-2035
  • Table 13: North America Market Value (USD Million) Forecast by Industry, 2020-2035
  • Table 14: North America Market Volume (Units) Forecast by Industry, 2020-2035
  • Table 15: North America Market Value (USD Million) Forecast by Product Type, 2020-2035
  • Table 16: North America Market Volume (Units) Forecast by Product Type, 2020-2035
  • Table 17: Latin America Market Value (USD Million) Forecast by Country, 2020-2035
  • Table 18: Latin America Market Volume (Units) Forecast by Country, 2020-2035
  • Table 19: Latin America Market Value (USD Million) Forecast by Function, 2020-2035
  • Table 20: Latin America Market Volume (Units) Forecast by Function, 2020-2035
  • Table 21: Latin America Market Value (USD Million) Forecast by Industry, 2020-2035
  • Table 22: Latin America Market Volume (Units) Forecast by Industry, 2020-2035
  • Table 23: Latin America Market Value (USD Million) Forecast by Product Type, 2020-2035
  • Table 24: Latin America Market Volume (Units) Forecast by Product Type, 2020-2035
  • Table 25: Western Europe Market Value (USD Million) Forecast by Country, 2020-2035
  • Table 26: Western Europe Market Volume (Units) Forecast by Country, 2020-2035
  • Table 27: Western Europe Market Value (USD Million) Forecast by Function, 2020-2035
  • Table 28: Western Europe Market Volume (Units) Forecast by Function, 2020-2035
  • Table 29: Western Europe Market Value (USD Million) Forecast by Industry, 2020-2035
  • Table 30: Western Europe Market Volume (Units) Forecast by Industry, 2020-2035
  • Table 31: Western Europe Market Value (USD Million) Forecast by Product Type, 2020-2035
  • Table 32: Western Europe Market Volume (Units) Forecast by Product Type, 2020-2035
  • Table 33: Eastern Europe Market Value (USD Million) Forecast by Country, 2020-2035
  • Table 34: Eastern Europe Market Volume (Units) Forecast by Country, 2020-2035
  • Table 35: Eastern Europe Market Value (USD Million) Forecast by Function, 2020-2035
  • Table 36: Eastern Europe Market Volume (Units) Forecast by Function, 2020-2035
  • Table 37: Eastern Europe Market Value (USD Million) Forecast by Industry, 2020-2035
  • Table 38: Eastern Europe Market Volume (Units) Forecast by Industry, 2020-2035
  • Table 39: Eastern Europe Market Value (USD Million) Forecast by Product Type, 2020-2035
  • Table 40: Eastern Europe Market Volume (Units) Forecast by Product Type, 2020-2035
  • Table 41: East Asia Market Value (USD Million) Forecast by Country, 2020-2035
  • Table 42: East Asia Market Volume (Units) Forecast by Country, 2020-2035
  • Table 43: East Asia Market Value (USD Million) Forecast by Function, 2020-2035
  • Table 44: East Asia Market Volume (Units) Forecast by Function, 2020-2035
  • Table 45: East Asia Market Value (USD Million) Forecast by Industry, 2020-2035
  • Table 46: East Asia Market Volume (Units) Forecast by Industry, 2020-2035
  • Table 47: East Asia Market Value (USD Million) Forecast by Product Type, 2020-2035
  • Table 48: East Asia Market Volume (Units) Forecast by Product Type, 2020-2035
  • Table 49: South Asia & Pacific Market Value (USD Million) Forecast by Country, 2020-2035
  • Table 50: South Asia & Pacific Market Volume (Units) Forecast by Country, 2020-2035
  • Table 51: South Asia & Pacific Market Value (USD Million) Forecast by Function, 2020-2035
  • Table 52: South Asia & Pacific Market Volume (Units) Forecast by Function, 2020-2035
  • Table 53: South Asia & Pacific Market Value (USD Million) Forecast by Industry, 2020-2035
  • Table 54: South Asia & Pacific Market Volume (Units) Forecast by Industry, 2020-2035
  • Table 55: South Asia & Pacific Market Value (USD Million) Forecast by Product Type, 2020-2035
  • Table 56: South Asia & Pacific Market Volume (Units) Forecast by Product Type, 2020-2035
  • Table 57: Middle East and Africa Market Value (USD Million) Forecast by Country, 2020-2035
  • Table 58: Middle East and Africa Market Volume (Units) Forecast by Country, 2020-2035
  • Table 59: Middle East and Africa Market Value (USD Million) Forecast by Function, 2020-2035
  • Table 60: Middle East and Africa Market Volume (Units) Forecast by Function, 2020-2035
  • Table 61: Middle East and Africa Market Value (USD Million) Forecast by Industry, 2020-2035
  • Table 62: Middle East and Africa Market Volume (Units) Forecast by Industry, 2020-2035
  • Table 63: Middle East and Africa Market Value (USD Million) Forecast by Product Type, 2020-2035
  • Table 64: Middle East and Africa Market Volume (Units) Forecast by Product Type, 2020-2035

List of Figures

  • Figure 1: Global Market Volume (Units) Forecast 2020-2035
  • Figure 2: Global Market Pricing Analysis
  • Figure 3: Global Market Value (USD Million) Forecast 2020-2035
  • Figure 4: Global Market Value Share and BPS Analysis by Function, 2025 and 2035
  • Figure 5: Global Market Y-o-Y Growth Comparison by Function, 2025-2035
  • Figure 6: Global Market Attractiveness Analysis by Function
  • Figure 7: Global Market Value Share and BPS Analysis by Industry, 2025 and 2035
  • Figure 8: Global Market Y-o-Y Growth Comparison by Industry, 2025-2035
  • Figure 9: Global Market Attractiveness Analysis by Industry
  • Figure 10: Global Market Value Share and BPS Analysis by Product Type, 2025 and 2035
  • Figure 11: Global Market Y-o-Y Growth Comparison by Product Type, 2025-2035
  • Figure 12: Global Market Attractiveness Analysis by Product Type
  • Figure 13: Global Market Value (USD Million) Share and BPS Analysis by Region, 2025 and 2035
  • Figure 14: Global Market Y-o-Y Growth Comparison by Region, 2025-2035
  • Figure 15: Global Market Attractiveness Analysis by Region
  • Figure 16: North America Market Incremental $ Opportunity, 2025-2035
  • Figure 17: Latin America Market Incremental $ Opportunity, 2025-2035
  • Figure 18: Western Europe Market Incremental $ Opportunity, 2025-2035
  • Figure 19: Eastern Europe Market Incremental $ Opportunity, 2025-2035
  • Figure 20: East Asia Market Incremental $ Opportunity, 2025-2035
  • Figure 21: South Asia & Pacific Market Incremental $ Opportunity, 2025-2035
  • Figure 22: Middle East and Africa Market Incremental $ Opportunity, 2025-2035
  • Figure 23: North America Market Value Share and BPS Analysis by Country, 2025 and 2035
  • Figure 24: North America Market Value Share and BPS Analysis by Function, 2025 and 2035
  • Figure 25: North America Market Y-o-Y Growth Comparison by Function, 2025-2035
  • Figure 26: North America Market Attractiveness Analysis by Function
  • Figure 27: North America Market Value Share and BPS Analysis by Industry, 2025 and 2035
  • Figure 28: North America Market Y-o-Y Growth Comparison by Industry, 2025-2035
  • Figure 29: North America Market Attractiveness Analysis by Industry
  • Figure 30: North America Market Value Share and BPS Analysis by Product Type, 2025 and 2035
  • Figure 31: North America Market Y-o-Y Growth Comparison by Product Type, 2025-2035
  • Figure 32: North America Market Attractiveness Analysis by Product Type
  • Figure 33: Latin America Market Value Share and BPS Analysis by Country, 2025 and 2035
  • Figure 34: Latin America Market Value Share and BPS Analysis by Function, 2025 and 2035
  • Figure 35: Latin America Market Y-o-Y Growth Comparison by Function, 2025-2035
  • Figure 36: Latin America Market Attractiveness Analysis by Function
  • Figure 37: Latin America Market Value Share and BPS Analysis by Industry, 2025 and 2035
  • Figure 38: Latin America Market Y-o-Y Growth Comparison by Industry, 2025-2035
  • Figure 39: Latin America Market Attractiveness Analysis by Industry
  • Figure 40: Latin America Market Value Share and BPS Analysis by Product Type, 2025 and 2035
  • Figure 41: Latin America Market Y-o-Y Growth Comparison by Product Type, 2025-2035
  • Figure 42: Latin America Market Attractiveness Analysis by Product Type
  • Figure 43: Western Europe Market Value Share and BPS Analysis by Country, 2025 and 2035
  • Figure 44: Western Europe Market Value Share and BPS Analysis by Function, 2025 and 2035
  • Figure 45: Western Europe Market Y-o-Y Growth Comparison by Function, 2025-2035
  • Figure 46: Western Europe Market Attractiveness Analysis by Function
  • Figure 47: Western Europe Market Value Share and BPS Analysis by Industry, 2025 and 2035
  • Figure 48: Western Europe Market Y-o-Y Growth Comparison by Industry, 2025-2035
  • Figure 49: Western Europe Market Attractiveness Analysis by Industry
  • Figure 50: Western Europe Market Value Share and BPS Analysis by Product Type, 2025 and 2035
  • Figure 51: Western Europe Market Y-o-Y Growth Comparison by Product Type, 2025-2035
  • Figure 52: Western Europe Market Attractiveness Analysis by Product Type
  • Figure 53: Eastern Europe Market Value Share and BPS Analysis by Country, 2025 and 2035
  • Figure 54: Eastern Europe Market Value Share and BPS Analysis by Function, 2025 and 2035
  • Figure 55: Eastern Europe Market Y-o-Y Growth Comparison by Function, 2025-2035
  • Figure 56: Eastern Europe Market Attractiveness Analysis by Function
  • Figure 57: Eastern Europe Market Value Share and BPS Analysis by Industry, 2025 and 2035
  • Figure 58: Eastern Europe Market Y-o-Y Growth Comparison by Industry, 2025-2035
  • Figure 59: Eastern Europe Market Attractiveness Analysis by Industry
  • Figure 60: Eastern Europe Market Value Share and BPS Analysis by Product Type, 2025 and 2035
  • Figure 61: Eastern Europe Market Y-o-Y Growth Comparison by Product Type, 2025-2035
  • Figure 62: Eastern Europe Market Attractiveness Analysis by Product Type
  • Figure 63: East Asia Market Value Share and BPS Analysis by Country, 2025 and 2035
  • Figure 64: East Asia Market Value Share and BPS Analysis by Function, 2025 and 2035
  • Figure 65: East Asia Market Y-o-Y Growth Comparison by Function, 2025-2035
  • Figure 66: East Asia Market Attractiveness Analysis by Function
  • Figure 67: East Asia Market Value Share and BPS Analysis by Industry, 2025 and 2035
  • Figure 68: East Asia Market Y-o-Y Growth Comparison by Industry, 2025-2035
  • Figure 69: East Asia Market Attractiveness Analysis by Industry
  • Figure 70: East Asia Market Value Share and BPS Analysis by Product Type, 2025 and 2035
  • Figure 71: East Asia Market Y-o-Y Growth Comparison by Product Type, 2025-2035
  • Figure 72: East Asia Market Attractiveness Analysis by Product Type
  • Figure 73: South Asia & Pacific Market Value Share and BPS Analysis by Country, 2025 and 2035
  • Figure 74: South Asia & Pacific Market Value Share and BPS Analysis by Function, 2025 and 2035
  • Figure 75: South Asia & Pacific Market Y-o-Y Growth Comparison by Function, 2025-2035
  • Figure 76: South Asia & Pacific Market Attractiveness Analysis by Function
  • Figure 77: South Asia & Pacific Market Value Share and BPS Analysis by Industry, 2025 and 2035
  • Figure 78: South Asia & Pacific Market Y-o-Y Growth Comparison by Industry, 2025-2035
  • Figure 79: South Asia & Pacific Market Attractiveness Analysis by Industry
  • Figure 80: South Asia & Pacific Market Value Share and BPS Analysis by Product Type, 2025 and 2035
  • Figure 81: South Asia & Pacific Market Y-o-Y Growth Comparison by Product Type, 2025-2035
  • Figure 82: South Asia & Pacific Market Attractiveness Analysis by Product Type
  • Figure 83: Middle East and Africa Market Value Share and BPS Analysis by Country, 2025 and 2035
  • Figure 84: Middle East and Africa Market Value Share and BPS Analysis by Function, 2025 and 2035
  • Figure 85: Middle East and Africa Market Y-o-Y Growth Comparison by Function, 2025-2035
  • Figure 86: Middle East and Africa Market Attractiveness Analysis by Function
  • Figure 87: Middle East and Africa Market Value Share and BPS Analysis by Industry, 2025 and 2035
  • Figure 88: Middle East and Africa Market Y-o-Y Growth Comparison by Industry, 2025-2035
  • Figure 89: Middle East and Africa Market Attractiveness Analysis by Industry
  • Figure 90: Middle East and Africa Market Value Share and BPS Analysis by Product Type, 2025 and 2035
  • Figure 91: Middle East and Africa Market Y-o-Y Growth Comparison by Product Type, 2025-2035
  • Figure 92: Middle East and Africa Market Attractiveness Analysis by Product Type
  • Figure 93: Global Market - Tier Structure Analysis
  • Figure 94: Global Market - Company Share Analysis

Frequently Asked Questions

What is the current value of the boiler safety system market?

The global market is valued at USD 413.6 million in 2025.

What is the projected market size for boiler safety systems by 2035?

The market is expected to reach USD 667.3 million by 2035.

What is the expected CAGR for the boiler safety system market?

The market is projected to grow at a CAGR of 4.9% from 2025 to 2035.

Which function segment leads the boiler safety system market?

Pressure control is the top function segment, holding a 34% share in 2025.

Which country is the fastest-growing in this market?

India is the fastest-growing country, with a projected CAGR of 5.5% from 2025 to 2035.

Explore Similar Insights

Future Market Insights

Boiler Safety System Market