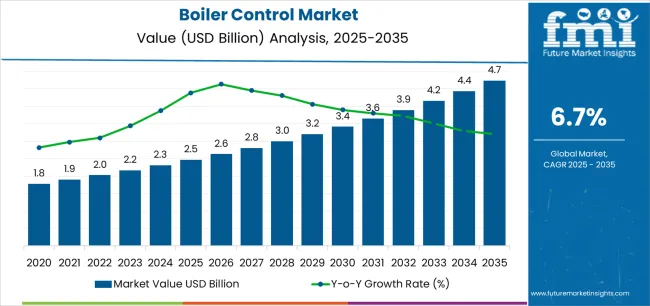
The global Boiler Control Market size is expected to attain a valuation of around USD 4.5 billion by 2034. It will likely reach a value of around USD 2.3 billion in 2024. The market is set to witness a CAGR of 7.1% in the assessment period 2024 to 2034.
The rising use of renewable energy sources across countries in Europe and Asia Pacific for power generation is anticipated to drive growth. At the same time, the high demand for energy-efficient boiler monitoring solutions in modern power plants will likely push growth.
The increasing need to optimize the overall performance of energy-efficient boilers is expected to augment the demand for automation. The high power generation capacity of certain power plants is also projected to propel the demand for boiler control.
With stringent laws pertaining to workers’ safety in several parts of the globe, boiler control is becoming essential to avoid damages or accidents in power plants. Increasing investments in real-time monitoring and the Internet of Things (IoT) to ensure the smooth operation of power plants are anticipated to create novel opportunities.
Attributes | Key Insights |
---|---|
Boiler Control Market Estimated Size (2024E) | USD 2.3 billion |
Projected Boiler Control Market Valuation (2034F) | USD 4.5 billion |
Value-based Boiler Control Market CAGR (2024 to 2034) | 7.1% |
The global boiler control market exhibited a CAGR of about 7.7% in the historical period. It is estimated to showcase a 7.1% CAGR in the forecast period. The market attained a valuation of USD 2.1 billion in 2023.
Historical CAGR (2019 to 2023) | 7.7% |
---|---|
Historical Valuation (2023) | USD 2.1 billion |
Analyzing Industrial Boiler Control System Market from 2019 to 2023
Remote Boiler Monitoring Market Outlook from 2024 to 2034
The table provides information about significant variations in growth rates and dynamic trends in the boiler control market. Readers can gain insights into changing consumer tastes and evolving market dynamics throughout an array of different periods.
The table offers an explanation of growth potential, scrutinizing the role that actual numbers and predictions have in determining the future path of the market.
Details | CAGR |
---|---|
H1 (2023 to 2033) | 6.5% |
H2 (2023 to 2033) | 7.7% |
H1 (2024 to 2034) | 6.6% |
H2 (2024 to 2034) | 7.6% |
The section below highlights the CAGRs of the leading countries in the boiler control market. The three main countries pushing boiler control demand include Japan, the United Kingdom, and China.
According to the analysis, Japan is set to lead the boiler control market by showcasing a CAGR of 8.3% in the forecast period. The country is anticipated to be followed by the United Kingdom and China, with CAGRs of 8.1% and 7.9%, respectively.
Countries | CAGR |
---|---|
United States | 7.4% |
United Kingdom | 8.1% |
China | 7.9% |
Japan | 8.3% |
South Korea | 4.2% |
Japan is estimated to showcase a considerable boiler control market share in the forecast period. It is expected to reach a valuation of USD 485.8 million in 2034. It will likely expand at a CAGR of around 8.3% from 2024 to 2034. Factors responsible for the country’s growth are:
The United Kingdom’s boiler control market is expected to showcase a CAGR of 8.1% in the assessment period. The country will likely reach a value of USD 181.8 million by 2034. Key factors propelling boiler control sales in the country are:
China’s boiler control market is projected to rise at a CAGR of 7.9% in the evaluation period. The country is anticipated to attain a value of about USD 719.3 million by 2034. A handful of factors pushing demand in China are:
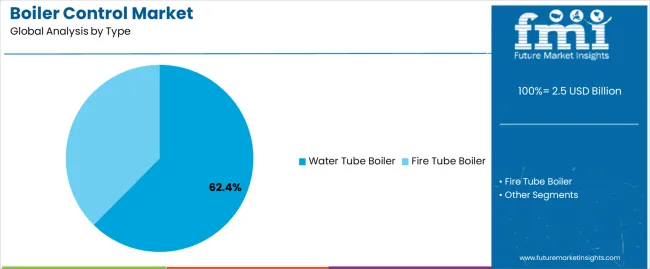
The below section shows the global trends in the boiler control industry in terms of type, components, and end-user. The water tube boiler segment is expected to lead the boiler control market based on type. It is set to showcase a CAGR of around 6.5% from 2024 to 2034.
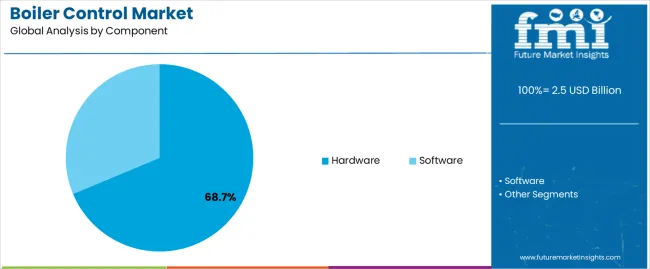
Based on the component, the hardware segment is anticipated to exhibit a dominant CAGR of 6.8% through 2034.
Segment | Value CAGR (2024 to 2034) |
---|---|
Hardware (Component) | 6.8% |
Water Tube Boiler (Type) | 6.5% |
Based on components, the hardware segment is estimated to lead the global boiler control market. It is expected to witness a CAGR of 6.8% in the forecast period. Factors accelerating the segment’s growth are:
In terms of type, the water tube boiler segment is projected to dominate the boiler control market. It will likely expand at a CAGR of 6.5% from 2024 to 2034. The segment is expected to rise at a fast pace due to the following factors:
Leading companies in the global boiler control market are focusing on research & development activities to discover new application areas and products.
They are participating in mergers & acquisitions, collaborations, and joint ventures to co-develop innovative solutions and gain a competitive edge. A few other market players are aiming to raise their brand loyalty by offering discounts and showcasing their new products across exhibitions.
Recent Boiler Control Market Developments
Table 1: Global Market Value (US$ billion) Forecast by Region, 2019 to 2034
Table 2: Global Market Value (US$ billion) Forecast by Type, 2019 to 2034
Table 3: Global Market Value (US$ billion) Forecast by Components, 2019 to 2034
Table 4: Global Market Value (US$ billion) Forecast by End-user, 2019 to 2034
Table 5: North America Market Value (US$ billion) Forecast by Country, 2019 to 2034
Table 6: North America Market Value (US$ billion) Forecast by Type, 2019 to 2034
Table 7: North America Market Value (US$ billion) Forecast by Components, 2019 to 2034
Table 8: North America Market Value (US$ billion) Forecast by End-user, 2019 to 2034
Table 9: Latin America Market Value (US$ billion) Forecast by Country, 2019 to 2034
Table 10: Latin America Market Value (US$ billion) Forecast by Type, 2019 to 2034
Table 11: Latin America Market Value (US$ billion) Forecast by Components, 2019 to 2034
Table 12: Latin America Market Value (US$ billion) Forecast by End-user, 2019 to 2034
Table 13: Western Europe Market Value (US$ billion) Forecast by Country, 2019 to 2034
Table 14: Western Europe Market Value (US$ billion) Forecast by Type, 2019 to 2034
Table 15: Western Europe Market Value (US$ billion) Forecast by Components, 2019 to 2034
Table 16: Western Europe Market Value (US$ billion) Forecast by End-user, 2019 to 2034
Table 17: Eastern Europe Market Value (US$ billion) Forecast by Country, 2019 to 2034
Table 18: Eastern Europe Market Value (US$ billion) Forecast by Type, 2019 to 2034
Table 19: Eastern Europe Market Value (US$ billion) Forecast by Components, 2019 to 2034
Table 20: Eastern Europe Market Value (US$ billion) Forecast by End-user, 2019 to 2034
Table 21: South Asia and Pacific Market Value (US$ billion) Forecast by Country, 2019 to 2034
Table 22: South Asia and Pacific Market Value (US$ billion) Forecast by Type, 2019 to 2034
Table 23: South Asia and Pacific Market Value (US$ billion) Forecast by Components, 2019 to 2034
Table 24: South Asia and Pacific Market Value (US$ billion) Forecast by End-user, 2019 to 2034
Table 25: East Asia Market Value (US$ billion) Forecast by Country, 2019 to 2034
Table 26: East Asia Market Value (US$ billion) Forecast by Type, 2019 to 2034
Table 27: East Asia Market Value (US$ billion) Forecast by Components, 2019 to 2034
Table 28: East Asia Market Value (US$ billion) Forecast by End-user, 2019 to 2034
Table 29: Middle East and Africa Market Value (US$ billion) Forecast by Country, 2019 to 2034
Table 30: Middle East and Africa Market Value (US$ billion) Forecast by Type, 2019 to 2034
Table 31: Middle East and Africa Market Value (US$ billion) Forecast by Components, 2019 to 2034
Table 32: Middle East and Africa Market Value (US$ billion) Forecast by End-user, 2019 to 2034
Figure 1: Global Market Value (US$ billion) by Type, 2024 to 2034
Figure 2: Global Market Value (US$ billion) by Components, 2024 to 2034
Figure 3: Global Market Value (US$ billion) by End-user, 2024 to 2034
Figure 4: Global Market Value (US$ billion) by Region, 2024 to 2034
Figure 5: Global Market Value (US$ billion) Analysis by Region, 2019 to 2034
Figure 6: Global Market Value Share (%) and BPS Analysis by Region, 2024 to 2034
Figure 7: Global Market Y-o-Y Growth (%) Projections by Region, 2024 to 2034
Figure 8: Global Market Value (US$ billion) Analysis by Type, 2019 to 2034
Figure 9: Global Market Value Share (%) and BPS Analysis by Type, 2024 to 2034
Figure 10: Global Market Y-o-Y Growth (%) Projections by Type, 2024 to 2034
Figure 11: Global Market Value (US$ billion) Analysis by Components, 2019 to 2034
Figure 12: Global Market Value Share (%) and BPS Analysis by Components, 2024 to 2034
Figure 13: Global Market Y-o-Y Growth (%) Projections by Components, 2024 to 2034
Figure 14: Global Market Value (US$ billion) Analysis by End-user, 2019 to 2034
Figure 15: Global Market Value Share (%) and BPS Analysis by End-user, 2024 to 2034
Figure 16: Global Market Y-o-Y Growth (%) Projections by End-user, 2024 to 2034
Figure 17: Global Market Attractiveness by Type, 2024 to 2034
Figure 18: Global Market Attractiveness by Components, 2024 to 2034
Figure 19: Global Market Attractiveness by End-user, 2024 to 2034
Figure 20: Global Market Attractiveness by Region, 2024 to 2034
Figure 21: North America Market Value (US$ billion) by Type, 2024 to 2034
Figure 22: North America Market Value (US$ billion) by Components, 2024 to 2034
Figure 23: North America Market Value (US$ billion) by End-user, 2024 to 2034
Figure 24: North America Market Value (US$ billion) by Country, 2024 to 2034
Figure 25: North America Market Value (US$ billion) Analysis by Country, 2019 to 2034
Figure 26: North America Market Value Share (%) and BPS Analysis by Country, 2024 to 2034
Figure 27: North America Market Y-o-Y Growth (%) Projections by Country, 2024 to 2034
Figure 28: North America Market Value (US$ billion) Analysis by Type, 2019 to 2034
Figure 29: North America Market Value Share (%) and BPS Analysis by Type, 2024 to 2034
Figure 30: North America Market Y-o-Y Growth (%) Projections by Type, 2024 to 2034
Figure 31: North America Market Value (US$ billion) Analysis by Components, 2019 to 2034
Figure 32: North America Market Value Share (%) and BPS Analysis by Components, 2024 to 2034
Figure 33: North America Market Y-o-Y Growth (%) Projections by Components, 2024 to 2034
Figure 34: North America Market Value (US$ billion) Analysis by End-user, 2019 to 2034
Figure 35: North America Market Value Share (%) and BPS Analysis by End-user, 2024 to 2034
Figure 36: North America Market Y-o-Y Growth (%) Projections by End-user, 2024 to 2034
Figure 37: North America Market Attractiveness by Type, 2024 to 2034
Figure 38: North America Market Attractiveness by Components, 2024 to 2034
Figure 39: North America Market Attractiveness by End-user, 2024 to 2034
Figure 40: North America Market Attractiveness by Country, 2024 to 2034
Figure 41: Latin America Market Value (US$ billion) by Type, 2024 to 2034
Figure 42: Latin America Market Value (US$ billion) by Components, 2024 to 2034
Figure 43: Latin America Market Value (US$ billion) by End-user, 2024 to 2034
Figure 44: Latin America Market Value (US$ billion) by Country, 2024 to 2034
Figure 45: Latin America Market Value (US$ billion) Analysis by Country, 2019 to 2034
Figure 46: Latin America Market Value Share (%) and BPS Analysis by Country, 2024 to 2034
Figure 47: Latin America Market Y-o-Y Growth (%) Projections by Country, 2024 to 2034
Figure 48: Latin America Market Value (US$ billion) Analysis by Type, 2019 to 2034
Figure 49: Latin America Market Value Share (%) and BPS Analysis by Type, 2024 to 2034
Figure 50: Latin America Market Y-o-Y Growth (%) Projections by Type, 2024 to 2034
Figure 51: Latin America Market Value (US$ billion) Analysis by Components, 2019 to 2034
Figure 52: Latin America Market Value Share (%) and BPS Analysis by Components, 2024 to 2034
Figure 53: Latin America Market Y-o-Y Growth (%) Projections by Components, 2024 to 2034
Figure 54: Latin America Market Value (US$ billion) Analysis by End-user, 2019 to 2034
Figure 55: Latin America Market Value Share (%) and BPS Analysis by End-user, 2024 to 2034
Figure 56: Latin America Market Y-o-Y Growth (%) Projections by End-user, 2024 to 2034
Figure 57: Latin America Market Attractiveness by Type, 2024 to 2034
Figure 58: Latin America Market Attractiveness by Components, 2024 to 2034
Figure 59: Latin America Market Attractiveness by End-user, 2024 to 2034
Figure 60: Latin America Market Attractiveness by Country, 2024 to 2034
Figure 61: Western Europe Market Value (US$ billion) by Type, 2024 to 2034
Figure 62: Western Europe Market Value (US$ billion) by Components, 2024 to 2034
Figure 63: Western Europe Market Value (US$ billion) by End-user, 2024 to 2034
Figure 64: Western Europe Market Value (US$ billion) by Country, 2024 to 2034
Figure 65: Western Europe Market Value (US$ billion) Analysis by Country, 2019 to 2034
Figure 66: Western Europe Market Value Share (%) and BPS Analysis by Country, 2024 to 2034
Figure 67: Western Europe Market Y-o-Y Growth (%) Projections by Country, 2024 to 2034
Figure 68: Western Europe Market Value (US$ billion) Analysis by Type, 2019 to 2034
Figure 69: Western Europe Market Value Share (%) and BPS Analysis by Type, 2024 to 2034
Figure 70: Western Europe Market Y-o-Y Growth (%) Projections by Type, 2024 to 2034
Figure 71: Western Europe Market Value (US$ billion) Analysis by Components, 2019 to 2034
Figure 72: Western Europe Market Value Share (%) and BPS Analysis by Components, 2024 to 2034
Figure 73: Western Europe Market Y-o-Y Growth (%) Projections by Components, 2024 to 2034
Figure 74: Western Europe Market Value (US$ billion) Analysis by End-user, 2019 to 2034
Figure 75: Western Europe Market Value Share (%) and BPS Analysis by End-user, 2024 to 2034
Figure 76: Western Europe Market Y-o-Y Growth (%) Projections by End-user, 2024 to 2034
Figure 77: Western Europe Market Attractiveness by Type, 2024 to 2034
Figure 78: Western Europe Market Attractiveness by Components, 2024 to 2034
Figure 79: Western Europe Market Attractiveness by End-user, 2024 to 2034
Figure 80: Western Europe Market Attractiveness by Country, 2024 to 2034
Figure 81: Eastern Europe Market Value (US$ billion) by Type, 2024 to 2034
Figure 82: Eastern Europe Market Value (US$ billion) by Components, 2024 to 2034
Figure 83: Eastern Europe Market Value (US$ billion) by End-user, 2024 to 2034
Figure 84: Eastern Europe Market Value (US$ billion) by Country, 2024 to 2034
Figure 85: Eastern Europe Market Value (US$ billion) Analysis by Country, 2019 to 2034
Figure 86: Eastern Europe Market Value Share (%) and BPS Analysis by Country, 2024 to 2034
Figure 87: Eastern Europe Market Y-o-Y Growth (%) Projections by Country, 2024 to 2034
Figure 88: Eastern Europe Market Value (US$ billion) Analysis by Type, 2019 to 2034
Figure 89: Eastern Europe Market Value Share (%) and BPS Analysis by Type, 2024 to 2034
Figure 90: Eastern Europe Market Y-o-Y Growth (%) Projections by Type, 2024 to 2034
Figure 91: Eastern Europe Market Value (US$ billion) Analysis by Components, 2019 to 2034
Figure 92: Eastern Europe Market Value Share (%) and BPS Analysis by Components, 2024 to 2034
Figure 93: Eastern Europe Market Y-o-Y Growth (%) Projections by Components, 2024 to 2034
Figure 94: Eastern Europe Market Value (US$ billion) Analysis by End-user, 2019 to 2034
Figure 95: Eastern Europe Market Value Share (%) and BPS Analysis by End-user, 2024 to 2034
Figure 96: Eastern Europe Market Y-o-Y Growth (%) Projections by End-user, 2024 to 2034
Figure 97: Eastern Europe Market Attractiveness by Type, 2024 to 2034
Figure 98: Eastern Europe Market Attractiveness by Components, 2024 to 2034
Figure 99: Eastern Europe Market Attractiveness by End-user, 2024 to 2034
Figure 100: Eastern Europe Market Attractiveness by Country, 2024 to 2034
Figure 101: South Asia and Pacific Market Value (US$ billion) by Type, 2024 to 2034
Figure 102: South Asia and Pacific Market Value (US$ billion) by Components, 2024 to 2034
Figure 103: South Asia and Pacific Market Value (US$ billion) by End-user, 2024 to 2034
Figure 104: South Asia and Pacific Market Value (US$ billion) by Country, 2024 to 2034
Figure 105: South Asia and Pacific Market Value (US$ billion) Analysis by Country, 2019 to 2034
Figure 106: South Asia and Pacific Market Value Share (%) and BPS Analysis by Country, 2024 to 2034
Figure 107: South Asia and Pacific Market Y-o-Y Growth (%) Projections by Country, 2024 to 2034
Figure 108: South Asia and Pacific Market Value (US$ billion) Analysis by Type, 2019 to 2034
Figure 109: South Asia and Pacific Market Value Share (%) and BPS Analysis by Type, 2024 to 2034
Figure 110: South Asia and Pacific Market Y-o-Y Growth (%) Projections by Type, 2024 to 2034
Figure 111: South Asia and Pacific Market Value (US$ billion) Analysis by Components, 2019 to 2034
Figure 112: South Asia and Pacific Market Value Share (%) and BPS Analysis by Components, 2024 to 2034
Figure 113: South Asia and Pacific Market Y-o-Y Growth (%) Projections by Components, 2024 to 2034
Figure 114: South Asia and Pacific Market Value (US$ billion) Analysis by End-user, 2019 to 2034
Figure 115: South Asia and Pacific Market Value Share (%) and BPS Analysis by End-user, 2024 to 2034
Figure 116: South Asia and Pacific Market Y-o-Y Growth (%) Projections by End-user, 2024 to 2034
Figure 117: South Asia and Pacific Market Attractiveness by Type, 2024 to 2034
Figure 118: South Asia and Pacific Market Attractiveness by Components, 2024 to 2034
Figure 119: South Asia and Pacific Market Attractiveness by End-user, 2024 to 2034
Figure 120: South Asia and Pacific Market Attractiveness by Country, 2024 to 2034
Figure 121: East Asia Market Value (US$ billion) by Type, 2024 to 2034
Figure 122: East Asia Market Value (US$ billion) by Components, 2024 to 2034
Figure 123: East Asia Market Value (US$ billion) by End-user, 2024 to 2034
Figure 124: East Asia Market Value (US$ billion) by Country, 2024 to 2034
Figure 125: East Asia Market Value (US$ billion) Analysis by Country, 2019 to 2034
Figure 126: East Asia Market Value Share (%) and BPS Analysis by Country, 2024 to 2034
Figure 127: East Asia Market Y-o-Y Growth (%) Projections by Country, 2024 to 2034
Figure 128: East Asia Market Value (US$ billion) Analysis by Type, 2019 to 2034
Figure 129: East Asia Market Value Share (%) and BPS Analysis by Type, 2024 to 2034
Figure 130: East Asia Market Y-o-Y Growth (%) Projections by Type, 2024 to 2034
Figure 131: East Asia Market Value (US$ billion) Analysis by Components, 2019 to 2034
Figure 132: East Asia Market Value Share (%) and BPS Analysis by Components, 2024 to 2034
Figure 133: East Asia Market Y-o-Y Growth (%) Projections by Components, 2024 to 2034
Figure 134: East Asia Market Value (US$ billion) Analysis by End-user, 2019 to 2034
Figure 135: East Asia Market Value Share (%) and BPS Analysis by End-user, 2024 to 2034
Figure 136: East Asia Market Y-o-Y Growth (%) Projections by End-user, 2024 to 2034
Figure 137: East Asia Market Attractiveness by Type, 2024 to 2034
Figure 138: East Asia Market Attractiveness by Components, 2024 to 2034
Figure 139: East Asia Market Attractiveness by End-user, 2024 to 2034
Figure 140: East Asia Market Attractiveness by Country, 2024 to 2034
Figure 141: Middle East and Africa Market Value (US$ billion) by Type, 2024 to 2034
Figure 142: Middle East and Africa Market Value (US$ billion) by Components, 2024 to 2034
Figure 143: Middle East and Africa Market Value (US$ billion) by End-user, 2024 to 2034
Figure 144: Middle East and Africa Market Value (US$ billion) by Country, 2024 to 2034
Figure 145: Middle East and Africa Market Value (US$ billion) Analysis by Country, 2019 to 2034
Figure 146: Middle East and Africa Market Value Share (%) and BPS Analysis by Country, 2024 to 2034
Figure 147: Middle East and Africa Market Y-o-Y Growth (%) Projections by Country, 2024 to 2034
Figure 148: Middle East and Africa Market Value (US$ billion) Analysis by Type, 2019 to 2034
Figure 149: Middle East and Africa Market Value Share (%) and BPS Analysis by Type, 2024 to 2034
Figure 150: Middle East and Africa Market Y-o-Y Growth (%) Projections by Type, 2024 to 2034
Figure 151: Middle East and Africa Market Value (US$ billion) Analysis by Components, 2019 to 2034
Figure 152: Middle East and Africa Market Value Share (%) and BPS Analysis by Components, 2024 to 2034
Figure 153: Middle East and Africa Market Y-o-Y Growth (%) Projections by Components, 2024 to 2034
Figure 154: Middle East and Africa Market Value (US$ billion) Analysis by End-user, 2019 to 2034
Figure 155: Middle East and Africa Market Value Share (%) and BPS Analysis by End-user, 2024 to 2034
Figure 156: Middle East and Africa Market Y-o-Y Growth (%) Projections by End-user, 2024 to 2034
Figure 157: Middle East and Africa Market Attractiveness by Type, 2024 to 2034
Figure 158: Middle East and Africa Market Attractiveness by Components, 2024 to 2034
Figure 159: Middle East and Africa Market Attractiveness by End-user, 2024 to 2034
Figure 160: Middle East and Africa Market Attractiveness by Country, 2024 to 2034
The boiler control market is set to reach USD 4.5 billion by 2034.
The market will likely expand at 7.1% CAGR from 2024 to 2034.
The boiler control market is expected to reach USD 2.3 billion in 2024.
They are important to avert boiler explosions by regulating pressure.
Electronic and pneumatic are the two types of boiler control systems.
Boilers help control fuel flow, airflow, and water flow.
Programmable Logical Controller (PLC) controls the water level and temperature.
A closed vessel is used to heat water or another fluid.
Explore Similar Insights
Thank you!
You will receive an email from our Business Development Manager. Please be sure to check your SPAM/JUNK folder too.