The boundary layer wind lidar market is valued at USD 275.5 million in 2025 and is expected to reach USD 573.1 million by 2035, with a CAGR of 7.6%. From 2021 to 2025, the market grows from USD 191.0 million to USD 275.5 million, passing through intermediate values of USD 205.5 million, USD 221.1 million, USD 238.0 million, and USD 256.0 million. This early growth phase shows a steady increase in market demand, driven by advancements in wind energy, environmental monitoring, and meteorological research. The adoption of boundary layer wind lidars in wind farm planning and atmospheric research applications fuels this upward trend, as these devices help to collect highly accurate wind data in the lower atmosphere, improving efficiency and safety in various sectors.
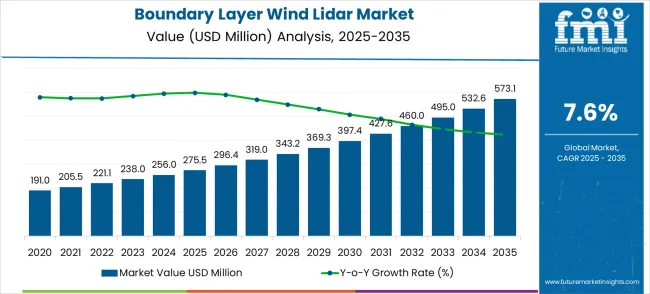
Between 2026 and 2030, the market is expected to continue its expansion from USD 275.5 million to USD 397.4 million, with values of USD 296.4 million, USD 319.0 million, USD 343.2 million, and USD 369.3 million in between. This phase reflects an acceleration in growth as boundary layer wind lidars are increasingly adopted for wind resource assessment, particularly in offshore wind farms. By 2030, the market is expected to reach USD 427.6 million, marking a notable increase in demand for lidar technologies. From 2031 to 2035, the market is expected to expand further, reaching USD 573.1 million, with intermediate values of USD 460.0 million, USD 495.0 million, and USD 532.6 million. This final phase is driven by global investments in wind energy, with lidar solutions playing a critical role in improving the performance and reliability of renewable energy systems.
| Metric | Value |
|---|---|
| Market Value (2025) | USD 275.5 million |
| Market Value (2035) | USD 573.1 million |
| CAGR (2025-2035) | 7.6% |
The wind energy market contributes about 30-35%, driven by the increasing demand for accurate wind measurements to optimize wind turbine placement and performance. Boundary layer wind lidars are widely used in wind resource assessment to better understand wind behavior at different altitudes. The environmental monitoring market adds roughly 20-25%, as these lidars are used to monitor atmospheric conditions, pollution levels, and air quality, providing valuable data for climate research and environmental protection efforts.
The aerospace and defense market contributes around 15-18%, with wind lidar technology being employed for weather forecasting, aircraft navigation, and surveillance applications, where accurate wind data is crucial. The research and development market accounts for approximately 12-15%, as boundary layer wind lidars are used in academic and industrial research to study atmospheric dynamics, wind patterns, and climate change. The civil engineering and construction market contributes about 8-10%, where these lidars are used for assessing wind conditions at construction sites, particularly for large infrastructure projects such as bridges, high-rise buildings, and offshore platforms.
Market expansion is being supported by the rapid increase in wind power installations worldwide and the corresponding need for precise atmospheric boundary layer measurements for optimal turbine placement and performance optimization. Modern wind farms rely on detailed wind profiling data to ensure maximum energy capture and minimize operational risks from turbulence and wind shear. Even minor variations in boundary layer conditions can significantly impact power generation efficiency, making comprehensive atmospheric monitoring essential for commercial wind operations.
The growing complexity of meteorological research and increasing focus on climate change studies are driving demand for advanced boundary layer wind lidar systems from research institutions and weather services with appropriate measurement capabilities and technical expertise. National meteorological agencies need continuous monitoring of atmospheric parameters such as wind, turbulence, clouds, and aerosols to provide accurate forecasting and contribute to effective climate research. Regulatory requirements for environmental impact assessments and climate modeling are establishing standardized atmospheric monitoring procedures that require specialized lidar instruments and trained operators.
The market is segmented by radar type, end-use industry, and region. By radar type, the market is divided into low and medium altitude radars and high altitude radars. Based on end-use industry, the market is categorized into wind power industry, meteorology and environment, and aerospace. Regionally, the market is divided into North America, Europe, Asia Pacific, Latin America, and Middle East & Africa.
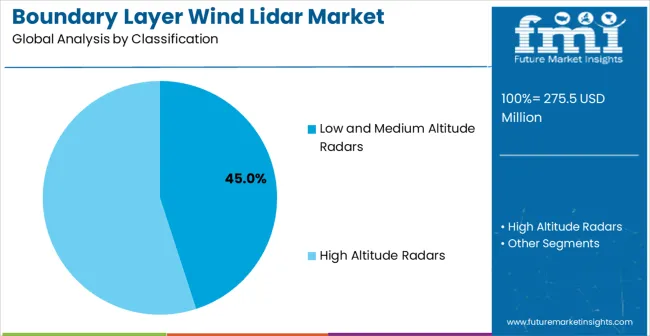
Low and medium altitude radars are projected to account for 45% of the boundary layer wind lidar market in 2025. This commanding share is supported by the widespread application of these systems for boundary layer meteorology, which typically focuses on atmospheric measurements up to 3000 meters altitude where most weather phenomena and wind energy applications occur. Low and medium altitude systems provide optimal performance for wind farm assessments, air quality monitoring, and weather forecasting applications. The segment benefits from established measurement protocols and comprehensive equipment availability from multiple manufacturers.
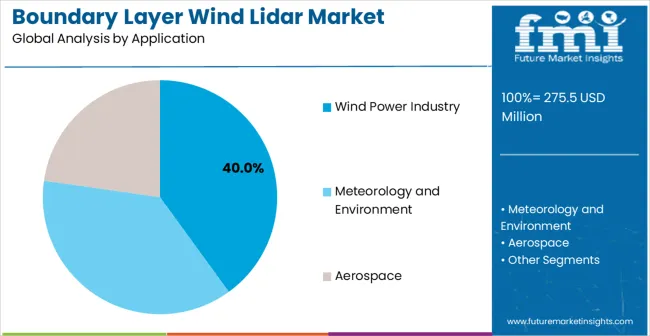
Meteorology and environment applications are projected to contribute 40% of the market in 2025, representing the primary driver of boundary layer wind lidar demand. These applications encompass weather forecasting, climate research, air quality monitoring, and atmospheric studies conducted by meteorological services, research institutions, and environmental agencies. The segment is supported by growing demand for high-resolution atmospheric data and the critical role of boundary layer measurements in understanding weather patterns and climate change impacts.
The boundary layer wind lidar market is advancing steadily due to increasing renewable energy investments and growing recognition of atmospheric monitoring importance for climate research and weather forecasting. The market faces challenges including high equipment costs, need for specialized technical expertise, and varying measurement requirements across different applications. Technology standardization efforts and training programs continue to influence service quality and market development patterns.
The growing integration of artificial intelligence and machine learning algorithms is enabling real-time analysis of boundary layer wind data and automated pattern recognition for improved atmospheric forecasting. Advanced processing systems equipped with cloud-based analytics provide enhanced measurement accuracy and reduced data interpretation time for users. Neural networks and machine learning applications are improving wind profile estimation capabilities and enabling more precise atmospheric boundary layer characterization. These technological advances support calibration of next-generation atmospheric monitoring systems including enhanced doppler processing and advanced signal analysis capabilities.
The increasing deployment of offshore wind farms is creating demand for specialized boundary layer wind lidar systems capable of operating in marine environments and providing accurate atmospheric measurements over water surfaces. Offshore installations require enhanced measurement capabilities for complex atmospheric conditions including sea-land interactions and marine boundary layer phenomena. These projects are particularly valuable for understanding offshore wind resources and optimizing turbine performance in challenging marine environments while supporting comprehensive environmental monitoring requirements.
| Country | CAGR (2025-2035) |
|---|---|
| China | 10.3% |
| India | 9.5% |
| Germany | 8.7% |
| Brazil | 8.0% |
| United States | 7.2% |
| United Kingdom | 6.5% |
| Japan | 5.7% |
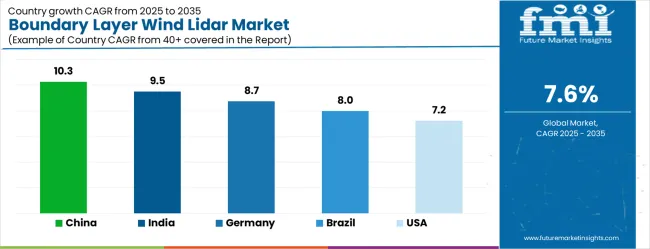
The boundary layer wind lidar market is experiencing robust growth across key global markets, with China leading at a 10.3% CAGR through 2035, driven by massive meteorological infrastructure investments, government-backed renewable energy expansion, and comprehensive atmospheric monitoring requirements. India follows at 9.5%, supported by growing meteorological capabilities and increasing recognition of atmospheric monitoring importance for agriculture and climate research. Germany demonstrates strong growth at 8.7%, emphasizing advanced technology integration and research excellence in atmospheric measurement systems. Brazil maintains steady expansion at 8.0%, driven by expanding atmospheric research programs and diverse climatic monitoring requirements. The United States shows consistent growth at 7.2%, focusing on comprehensive atmospheric monitoring and federal research investments. The United Kingdom records 6.5% growth, concentrating on offshore applications and maritime meteorology. Japan exhibits 5.7% growth, demonstrating focus on precision technology and specialized atmospheric research applications.
Revenue from boundary layer wind lidar in China is projected to exhibit the highest growth rate with a CAGR of 10.3% through 2035, driven by massive investments in meteorological monitoring infrastructure and rapid expansion of wind energy installations across the country. The government's commitment to renewable energy development and comprehensive weather forecasting capabilities is creating significant demand for advanced atmospheric monitoring systems. Major meteorological agencies and research institutions are establishing extensive boundary layer measurement networks to support weather prediction and climate research programs. China's meteorological modernization programs are supporting development of advanced lidar manufacturing capabilities and comprehensive training programs that enhance domestic measurement expertise across urban and rural regions.
The boundary layer wind lidar market in India is projected to expand at a CAGR of 9.5%, supported by government investments in meteorological infrastructure and increasing recognition of atmospheric monitoring importance for agriculture, aviation, and renewable energy development. The country's expanding research capabilities and growing wind energy sector are driving demand for sophisticated boundary layer measurement systems. National meteorological organizations and academic institutions are gradually establishing comprehensive atmospheric monitoring capabilities to serve diverse applications. The growing emphasis on climate research and weather forecasting accuracy is supporting investments in advanced lidar technologies for monsoon prediction, air quality monitoring, and renewable energy resource assessment applications across different climatic regions.
Demand for boundary layer wind lidar in Germany is projected to grow at a CAGR of 8.7%, supported by the country's leadership in renewable energy technology and comprehensive meteorological research programs. German research institutions and meteorological services are implementing advanced boundary layer monitoring systems that integrate with sophisticated weather prediction models and climate research programs. The market is characterized by emphasis on technological innovation, precision measurement capabilities, and comprehensive atmospheric research applications. Germany's atmospheric research investments are prioritizing next-generation lidar technologies that demonstrate superior measurement accuracy and data processing capabilities while supporting comprehensive climate research and renewable energy optimization programs.
Revenue from boundary layer wind lidar in Brazil is projected to grow at a CAGR of 8.0%, driven by increasing investments in meteorological infrastructure and growing recognition of atmospheric monitoring importance for climate research and agricultural applications. The country's diverse climatic conditions and expanding renewable energy sector are creating demand for comprehensive boundary layer measurement systems. National meteorological services and research institutions are developing atmospheric monitoring capabilities to support weather forecasting and climate research programs. Government programs for climate research and renewable energy development are creating opportunities for systematic boundary layer monitoring across different ecosystems including Amazon rainforest, coastal regions, and agricultural areas.
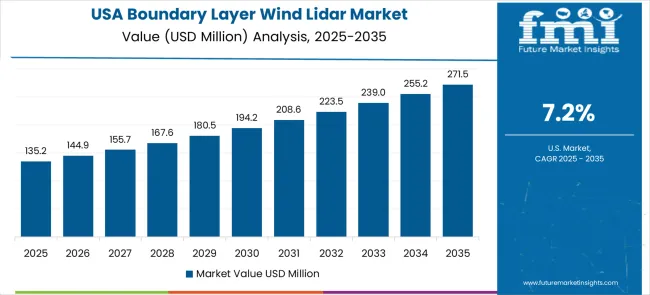
Demand for boundary layer wind lidar in the United States is expected to expand at a CAGR of 7.2%, driven by extensive atmospheric research programs and comprehensive meteorological monitoring requirements across diverse climatic regions. Federal agencies, research institutions, and private sector organizations are establishing advanced boundary layer measurement capabilities to support weather forecasting, climate research, and renewable energy development programs. The market benefits from significant research investments and technological innovation in atmospheric measurement systems. Federal funding for climate research and meteorological infrastructure is supporting systematic deployment of boundary layer monitoring systems for diverse applications including severe weather research, air quality monitoring, and renewable energy resource assessment.
The boundary layer wind lidar market in the United Kingdom is anticipated to grow at a CAGR of 6.5%, supported by extensive offshore wind development programs and comprehensive maritime meteorological monitoring requirements. British research institutions and meteorological services are implementing specialized boundary layer measurement systems for coastal and offshore applications. The market is characterized by emphasis on marine atmospheric research, offshore wind resource assessment, and comprehensive weather forecasting capabilities. United Kingdom atmospheric research investments are prioritizing maritime boundary layer studies and offshore measurement technologies that support comprehensive wind energy development and climate research programs.
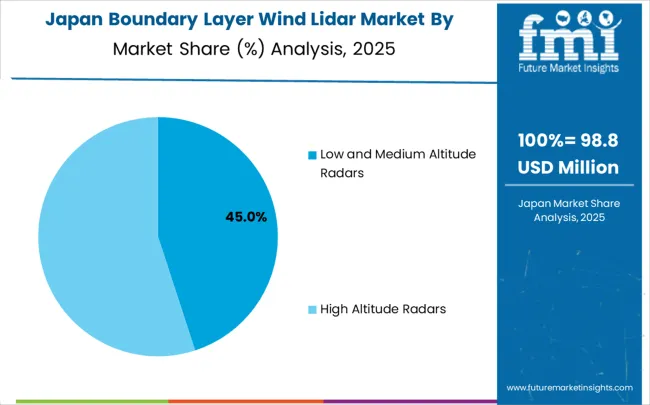
Revenue from boundary layer wind lidar in Japan is projected to expand at a CAGR of 5.7%, driven by advanced technology development capabilities and comprehensive atmospheric research programs for disaster prevention and climate monitoring. Japanese research institutions and meteorological agencies are implementing precision measurement systems for complex atmospheric phenomena including typhoon research, mountain meteorology, and urban atmospheric studies. The market benefits from technological innovation and systematic approach to atmospheric monitoring applications. Japan's atmospheric research programs are creating opportunities for domestic technology development and international collaboration in boundary layer measurement systems.
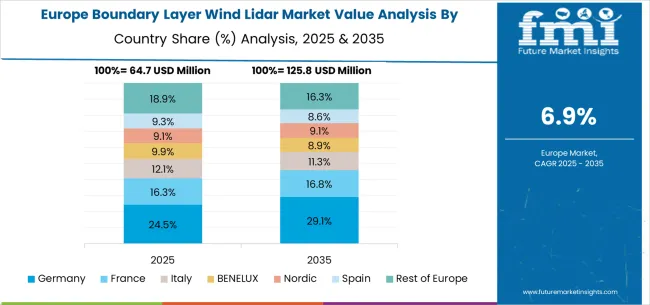
The boundary layer wind lidar market in Europe is projected to grow from USD 82.7 million in 2025 to USD 129.4 million by 2035, registering a CAGR of 4.6% over the forecast period. Germany is expected to maintain its leadership with 23.1% market share in 2025, supported by its advanced renewable energy infrastructure and comprehensive meteorological monitoring networks.
The United Kingdom is projected to hold 19.2% market share, driven by extensive offshore wind development and atmospheric research programs. France will contribute 16.8% of the regional market, supported by national meteorological service investments and climate research initiatives. Nordic countries collectively represent 15.4% of the market, driven by wind energy development and arctic atmospheric research requirements. The Rest of Europe region accounts for 12.7%, while Spain and Italy together represent 12.8% of the regional boundary layer wind lidar market.
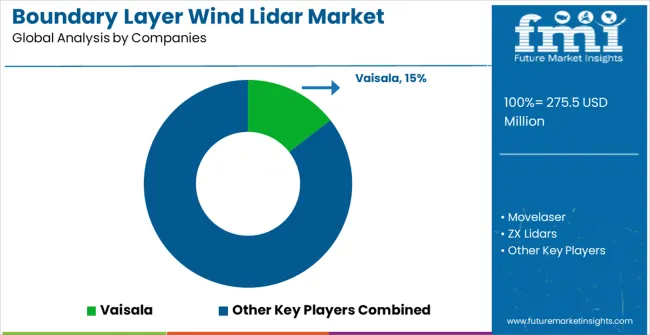
The boundary layer wind lidar market is defined by competition among specialized technology providers, meteorological equipment manufacturers, and atmospheric research companies. Companies are investing in advanced doppler lidar technologies, data processing capabilities, artificial intelligence integration, and technical support services to deliver precise, reliable, and comprehensive atmospheric measurement solutions. Strategic partnerships, technological innovation, and geographic expansion are central to strengthening product portfolios and market presence.
Vaisala, Finland-based, offers comprehensive boundary layer wind measurement systems with emphasis on meteorological accuracy, data reliability, and technical expertise for diverse atmospheric applications. Movelaser, operating globally, provides advanced doppler lidar solutions integrated with atmospheric research and wind energy assessment services. ZX Lidars, United Kingdom, delivers technologically sophisticated measurement systems with standardized procedures and comprehensive data processing capabilities. John Wood Group, multinational, emphasizes comprehensive atmospheric monitoring services and specialized technical support for complex measurement applications.
Qingdao Leice Transient Technology, China, offers advanced lidar solutions integrated into comprehensive atmospheric monitoring operations. Huahang Seaglet provides specialized measurement systems with precision capabilities and technical reliability. Lumibird, France, delivers comprehensive atmospheric measurement expertise, standardized procedures, and service reliability across global and regional networks. Windar Photonics, Mitsubishi Electric, and Emgo-tech offer specialized atmospheric monitoring capabilities, advanced technology integration, and comprehensive technical support for diverse boundary layer measurement applications.
Boundary layer wind lidar systems represent advanced atmospheric measurement technology enabling precise three-dimensional wind profiling essential for renewable energy optimization, meteorological forecasting, and aviation safety. With the market expanding from $275.5M to $573.1M at 8% CAGR, driven by wind power capacity growth, climate monitoring requirements, and autonomous aviation development, this specialized sensing sector requires coordinated stakeholder action to address technology standardization, cost optimization, and application integration challenges.
How Governments Could Accelerate Atmospheric Sensing Capabilities?
National Weather Infrastructure Investment: Integrate boundary layer wind lidar into national meteorological networks to enhance weather forecasting accuracy, severe weather detection, and climate monitoring capabilities essential for public safety and economic planning.
Renewable Energy Policy Support: Provide incentives for wind farm developers to deploy advanced lidar systems for site assessment and operational optimization, recognizing improved wind resource characterization as critical for efficient renewable energy deployment.
Aviation Safety Enhancement: Mandate or incentivize lidar-based wind shear detection at airports and along flight corridors to improve aviation safety while supporting the development of urban air mobility and autonomous aircraft systems.
Research Infrastructure Funding: Support national laboratories and universities in deploying research-grade wind lidar networks that advance atmospheric science understanding while fostering domestic technology development and expertise.
International Data Cooperation: Establish bilateral agreements for sharing atmospheric wind data collected by lidar systems to improve global weather models and climate research while maintaining technology leadership positions.
How Meteorological Organizations Could Strengthen Measurement Standards?
Data Quality Protocols: Establish comprehensive standards for wind lidar calibration, data validation, and measurement uncertainty quantification that ensure reliable atmospheric measurements across different instruments and operators.
Operational Integration Guidelines: Develop best practices for integrating lidar wind measurements with traditional meteorological observations, weather models, and forecasting systems to maximize data value and accuracy.
Performance Benchmarking Standards: Create standardized testing methods for evaluating wind lidar accuracy, range capability, and environmental performance that enable objective comparison across suppliers and technologies.
Data Format Standardization: Establish common data formats and communication protocols for wind lidar systems that facilitate data sharing, system interoperability, and integration with broader atmospheric monitoring networks.
Application-Specific Requirements: Develop tailored measurement standards for different applications (wind energy, aviation, environmental monitoring) addressing specific accuracy, temporal resolution, and spatial coverage needs.
How Lidar Manufacturers Could Enhance Market Position?
Multi-Application Platform Development: Create modular wind lidar systems that can serve multiple markets (wind energy, meteorology, aviation) through software configuration and accessory options rather than separate product lines.
Advanced Signal Processing: Invest in sophisticated algorithms for noise reduction, clutter filtering, and measurement validation that improve data quality and extend operational range in challenging atmospheric conditions.
Cost Optimization Engineering: Develop manufacturing approaches and component integration strategies that reduce system costs while maintaining measurement performance, enabling broader market adoption beyond premium applications.
Remote Operation Capabilities: Integrate advanced connectivity, remote diagnostics, and autonomous operation features that reduce operational costs and enable deployment in remote locations with minimal maintenance requirements.
Environmental Hardening: Engineer systems capable of reliable operation in extreme weather conditions, marine environments, and challenging locations where traditional measurement approaches fail.
How Wind Energy Developers Could Maximize Lidar Value?
Integrated Resource Assessment: Implement comprehensive wind measurement campaigns combining ground-based lidar, nacelle-mounted systems, and meteorological towers to optimize turbine siting and energy production forecasting.
Operational Optimization Programs: Deploy real-time wind profiling for turbine control optimization, wake effect mitigation, and predictive maintenance that maximizes energy output while extending equipment life.
Grid Integration Support: Use lidar-based wind forecasting to improve power production predictions, support grid stability, and optimize energy trading in competitive electricity markets.
Site Characterization Excellence: Establish standardized protocols for lidar-based wind resource assessment that reduce measurement uncertainty and improve financing confidence for wind energy projects.
Technology Validation Studies: Conduct comprehensive validation programs comparing lidar measurements with traditional methods to build industry confidence and optimize measurement strategies.
How Aviation Stakeholders Could Enhance Safety Systems?
Airport Wind Shear Detection: Implement comprehensive lidar-based wind monitoring systems at airports to detect dangerous wind conditions and provide real-time alerts to air traffic control and pilots.
Flight Path Optimization: Integrate atmospheric wind data from lidar systems into flight management systems to optimize routing, reduce fuel consumption, and improve passenger comfort through turbulence avoidance.
Urban Air Mobility Preparation: Deploy urban wind monitoring networks using lidar technology to support the safe integration of autonomous aircraft and advanced air mobility systems in complex urban environments.
Weather Hazard Mitigation: Use lidar wind measurements to improve detection and prediction of aviation weather hazards including microbursts, wind shear, and turbulence that pose risks to aircraft operations.
Air Traffic Management Enhancement: Integrate real-time wind profile data into air traffic control systems to optimize separation standards, improve approach procedures, and enhance overall airspace efficiency.
How Financial Stakeholders Could Support Market Development?
Technology Innovation Investment: Finance R&D initiatives focused on next-generation lidar technologies, advanced signal processing, and cost reduction strategies that can significantly expand market opportunities and applications.
Infrastructure Deployment Capital: Support large-scale lidar network deployments for meteorological agencies, wind energy projects, and aviation infrastructure that require substantial upfront capital investment.
Manufacturing Scale Investment: Back companies developing high-volume manufacturing capabilities and supply chain infrastructure required to deliver cost-effective lidar systems for broader market adoption.
Market Expansion Funding: Finance international expansion initiatives and application development programs that help lidar companies establish market presence in emerging renewable energy and aviation markets.
Public-Private Partnerships: Structure financing arrangements that combine public sector atmospheric monitoring needs with private sector technology development and operational capabilities.
How Research Institutions Could Drive Innovation?
Atmospheric Science Advancement: Conduct fundamental research on boundary layer meteorology, wind flow modeling, and atmospheric turbulence that improves understanding of phenomena measured by lidar systems.
Measurement Technology Development: Develop next-generation lidar technologies including solid-state systems, multi-wavelength approaches, and advanced signal processing that enhance measurement capabilities and reduce costs.
Validation & Calibration Research: Establish reference measurement sites and validation methodologies that ensure lidar measurement accuracy and enable continuous improvement of measurement techniques.
Application Innovation: Explore novel wind lidar applications including urban meteorology, agricultural optimization, and environmental monitoring that expand market opportunities beyond traditional sectors.
Data Analytics & Modeling: Develop advanced algorithms for processing lidar wind data, improving weather forecasts, and optimizing renewable energy operations through sophisticated atmospheric modeling.
The boundary layer wind lidar market's growth trajectory requires addressing the fundamental challenge of delivering research-grade atmospheric measurement capabilities at price points that enable widespread adoption across commercial applications while maintaining the precision and reliability essential for safety-critical and high-value uses.
| Item | Value |
|---|---|
| Quantitative Units (2025) | USD 275.5 million |
| Radar Type | Low and Medium Altitude Radars, High Altitude Radars |
| End-Use Industry | Wind Power Industry, Meteorology and Environment, Aerospace |
| Regions Covered | North America, Europe, East Asia, South Asia & Pacific, Latin America, Middle East & Africa |
| Countries Covered | United States, Canada, United Kingdom, Germany, France, China, Japan, South Korea, India, Brazil, Australia and 40+ countries |
| Key Companies Profiled | Vaisala, Movelaser, ZX Lidars, John Wood Group, Qingdao Leice Transient Technology, Huahang Seaglet, Lumibird, Windar Photonics, Mitsubishi Electric, Emgo-tech |
| Additional Attributes | Dollar sales by radar type, end-use industry, and regional markets, demand trends across North America, Europe, and Asia-Pacific, competitive landscape with established manufacturers and emerging technology providers, customer preferences for precision measurement versus cost-effective solutions, integration with artificial intelligence and advanced data processing platforms |
The global boundary layer wind lidar market is estimated to be valued at USD 275.5 million in 2025.
The market size for the boundary layer wind lidar market is projected to reach USD 573.1 million by 2035.
The boundary layer wind lidar market is expected to grow at a 7.6% CAGR between 2025 and 2035.
The key product types in boundary layer wind lidar market are low and medium altitude radars and high altitude radars.
In terms of application, wind power industry segment to command 40.0% share in the boundary layer wind lidar market in 2025.
Explore Similar Insights

Thank you!
You will receive an email from our Business Development Manager. Please be sure to check your SPAM/JUNK folder too.
Chat With
MaRIA