
- Market Size (2026)
- USD 1081.4 Mn
- Forecast (2036)
- USD 3736.4 Mn
- CAGR (2026 to 2036)
- 13.2%
How Big is the Buffered Vinegar Market in 2026?
The buffered vinegar market is estimated at USD 1,081.4 million in 2026.
The global buffered vinegar market was valued at USD 955.3 million in 2025 and is estimated to reach USD 1,081.4 million in 2026. The market is projected to reach USD 3,736.4 million by 2036, expanding at a compound annual growth rate (CAGR) of 13.2% between 2026 and 2036. Dry buffered vinegar accounted for the largest share of the market, contributing 42.0% of total revenue in 2026. Demand is supported by bakeries replacing conventional mould inhibitors with ingredients that can be declared as vinegar. The regulatory basis for this shift is well defined in Europe, where Commission Regulation (EU) 2023/2086 established buffered vinegar as food additive E 267 and set out its authorised uses[1]. Leading suppliers are reporting growth in this area. Corbion stated that full-year volume growth in its Functional Ingredients & Solutions business in 2025 was supported by momentum in natural preservation and shelf-life extension[5]. Regulatory pressure on legacy additives is also increasing. In the United States, the Food and Drug Administration (FDA) finalised its post-market assessment programme for food chemicals in 2026 and opened reviews of additives such as butylated hydroxytoluene (BHT) and azodicarbonamide[7].
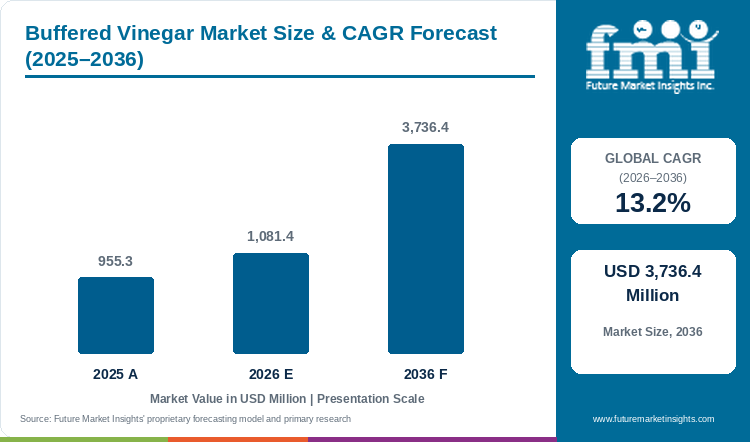
Table 1: Buffered Vinegar Market Size and Forecast (USD million), 2025 to 2036
| Market size and forecast | Value |
|---|---|
| 2025 market size | USD 955.3 million |
| Estimated market size in 2026 | USD 1,081.4 million |
| Projected market size by 2036 | USD 3,736.4 million |
| CAGR (2026-2036) | 13.2% |
| Added revenue, 2026 to 2036 | USD 2,655.0 million |
Key Market Trends & Insights
- By type: The Dry buffered vinegar segment accounted for the largest share of the buffered vinegar market in 2026, representing 42.0% of total market revenue.
- By form: Powder / dry products held the leading market position with a share of 46.0% in 2026, as bakeries can weigh them into dough or blend them into dry improvers.
- By application: Bread & rolls remained the largest application segment, accounting for 38.0% of the market in 2026.
Regional Highlights
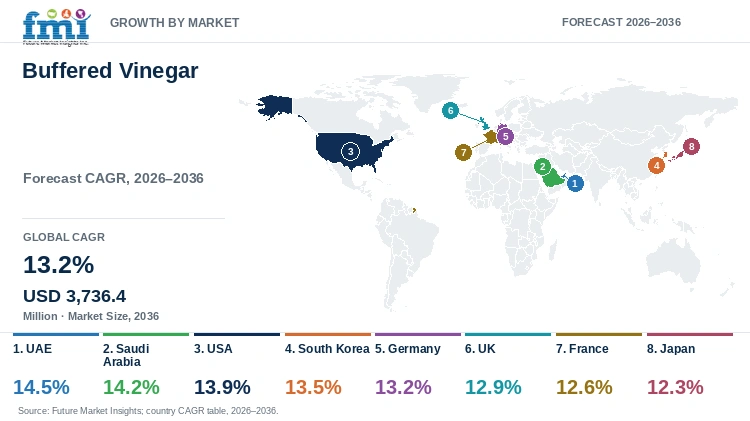
- Fastest-growing country: The UAE is expected to record the highest growth rate among the eight profiled countries, with a projected CAGR of 14.5% between 2026 and 2036.
- Growth across other countries: Saudi Arabia is projected to expand at a CAGR of 14.2%, followed by the USA at 13.9% and South Korea at 13.5%. Japan is expected to register comparatively slower growth, with a CAGR of 12.3% during the forecast period.
Regulation remains an important factor influencing the use of buffered vinegar. European rules distinguish dried and liquid E 267, specify their composition and list the bakery products in which the additive may be used[1]. These distinctions affect the activity available from a purchased grade and the quantity required in a recipe. Among food preservatives, buffered vinegar must therefore be assessed on both its legal status and its technical performance. Regulatory scrutiny of older preservatives is also rising in the United States. According to Nutritional Outlook, the FDA's 2026 post-market assessment framework has triggered reassessments of BHT and azodicarbonamide, accelerating industry timelines for replacements[7].
The commercial performance of suppliers provides a further indication of demand. Corbion reported 2025 sales of EUR 1,267.4 million, with organic sales growth of 2.2% and volume/mix growth of 3.4%, partly offset by a 1.2% decline in prices[5]. Kerry Group, which supplies dry and liquid buffered vinegars for bakery, reported 2025 revenue of EUR 6,758.0 million and volume growth of 3.0%[6]. Ingredient suppliers are also presenting new alternatives to conventional inhibitors. For instance, Kemin highlighted a clean label alternative to calcium propionate for mould inhibition in tortillas and baked goods at the IFT exhibition in July 2026[7]. However, microbial performance still depends on the recipe. Research by Moro and colleagues found that the efficacy of weak-acid preservatives against bakery spoilage fungi depends on pH[2].
Suppliers are also developing tools to predict the usable life of baked products. Kerry's July 2025 guidance discussed vinegar-based mould control systems in dry and liquid formats[3], while its 2025 sustainability statements reported the launch of a Bakery Shelf-Life Model[4]. Such tools support application development, although results remain specific to the recipe and storage conditions. Commercial value arises when an accepted preservation system can be reproduced in regular production, reducing the need for repeated adjustments as ingredient batches and production volumes change.
Table 2: Supporting Industry Indicators for the Buffered Vinegar Market, 2022 to 2026
| Indicator | Data point | Why it matters | Source |
|---|---|---|---|
| Regulatory definition | EU Regulation 2023/2086 establishes specifications and authorised uses for buffered vinegar, E 267. | Composition and application rules determine the grades and uses available to bakeries. | [1] |
| US regulation | The FDA finalised its food chemical post-market assessment programme in 2026 and opened reviews of BHT and azodicarbonamide. | Scrutiny of legacy additives accelerates the search for replacements. | [7] |
| Supplier sales | Corbion reported 2025 sales of EUR 1,267.4 million, with organic growth of 2.2% and volume/mix growth of 3.4%. | The results provide an external benchmark for preservation ingredient demand. | [5] |
| Preservation demand | Corbion attributed volume growth in Functional Ingredients & Solutions to momentum in natural preservation and shelf-life extension. | The statement confirms demand for natural preservation systems. | [5] |
| Supplier volumes | Kerry Group reported 2025 revenue of EUR 6,758.0 million and volume growth of 3.0%. | Volume growth at a leading supplier indicates demand across food ingredients. | [6] |
| Product launches | Kemin presented a clean label alternative to calcium propionate for tortillas and baked goods in July 2026. | New launches widen the choice of natural mould inhibitors. | [7] |
| Preservative performance | A 2022 study assessed weak-acid preservatives against spoilage fungi of bakery products. | The influence of pH makes recipe conditions important in preservation trials. | [2] |
| Commercial formats | Kerry's July 2025 guidance discussed dry and liquid vinegar-based mould control systems. | Format choice links the preservative with the equipment used in production. | [3] |
| Shelf-life prediction | Kerry reported the launch of its Bakery Shelf-Life Model in its 2025 sustainability statements. | Prediction tools can shorten recipe development and product trials. | [4] |
Demand Intensity Analysis
A comparison of FMI's market estimate with supplier results provides a measure of the scale implied by the forecast. FMI estimated the buffered vinegar market at USD 1,081.4 million in 2026. In comparison, Corbion, one of the leading suppliers of vinegar-based preservation, reported total company sales of EUR 1,267.4 million in 2025 across all its businesses[5]. The comparison indicates that FMI's estimate places buffered vinegar among the larger bakery ingredient categories, with revenue shared across several suppliers and a wide range of applications.
A similar comparison can be made between projected market growth and supplier volume growth. FMI expects the buffered vinegar market to grow at a CAGR of 13.2% between 2026 and 2036. Corbion reported volume/mix growth of 3.4% in 2025, while Kerry reported volume growth of 3.0%[5][6]. The difference of approximately 10 percentage points implies that the forecast relies on the replacement of conventional preservatives such as calcium propionate, rather than on growth in overall bakery production. This assumption is supported by regulatory reviews of legacy additives in the United States[7] and by the defined status of E 267 in Europe[1].
Segment values show where this replacement is concentrated. Dry buffered vinegar represented USD 454.2 million of Type revenue in 2026, while the separate Powder / dry Form category accounted for USD 497.4 million. Bread & rolls contributed USD 410.9 million within the Application breakdown, reflecting the importance of mould control in packaged bread. Direct to industrial bakeries represented USD 584.0 million in the Sales Channel breakdown, which shows the importance of direct technical support during reformulation.
Pricing is also relevant. Corbion reported a 1.2% decline in prices in 2025[5], which suggests that revenue growth in preservation ingredients currently depends on volume rather than price increases. The market is projected to reach 3.5 times its 2026 value by 2036.
Table 3: Demand Intensity Metrics for the Buffered Vinegar Market, 2025 Supplier Data Against 2026 Market Values
| Demand intensity metric | Value | Basis |
|---|---|---|
| FMI market value, 2026 | USD 1,081.4 million | FMI estimate of buffered vinegar revenue. |
| Corbion total sales, 2025 | EUR 1,267.4 million | Company-wide sales across all businesses. |
| Corbion organic sales growth, 2025 | 2.2% | Corbion full-year 2025 results. |
| Corbion volume/mix growth, 2025 | 3.4% | Corbion full-year 2025 results. |
| Corbion price change, 2025 | -1.2% | Corbion full-year 2025 results. |
| Kerry volume growth, 2025 | 3.0% | Kerry full-year 2025 results. |
| FMI value CAGR, 2026 to 2036 | 13.2% | FMI market forecast. |
| Gap between FMI CAGR and supplier volume growth | Approximately 10 percentage points | Difference attributed to replacement of conventional preservatives. |
| Dry buffered vinegar revenue, 2026 | USD 454.2 million | 42.0% of the market. |
| Bread & rolls revenue, 2026 | USD 410.9 million | 38.0% of the market. |
| Direct industrial channel revenue, 2026 | USD 584.0 million | 54.0% of the market. |
| Market expansion multiple | 3.5 times | Projected 2036 market value relative to 2026. |
Analyst Perspective
"Growth in buffered vinegar comes from replacing propionates, so bakeries will switch only when the new system matches the shelf life they already have without changing the taste of the bread."
- Nandini Roy Choudhury, Principal Analyst at Future Market Insights
How is the buffered vinegar market segmented?
The buffered vinegar market is segmented by type, form, application, claim and sales channel. Type comprises Dry buffered vinegar, Liquid buffered, Blended systems and Organic. Form comprises Powder / dry, Liquid, Paste / semi-solid and Granules / pieces. Application comprises Bread & rolls, Cakes & muffins, Biscuits & cookies, Viennoiserie & pastry and Other bakery & snacks. Claim comprises Conventional, Clean label, Organic and Non-GMO / identity preserved. Sales Channel comprises Direct to industrial bakeries, Ingredient distributors, Foodservice & artisan supply and Online B2B.
Why does Dry buffered vinegar lead the Type category?
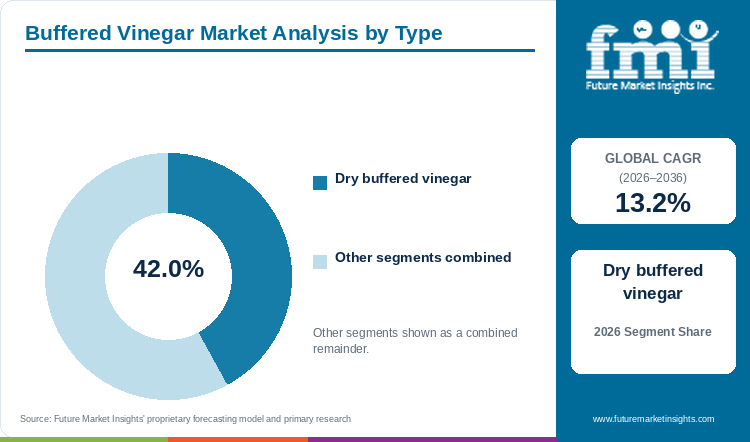
Dry buffered vinegar accounts for 42.0% of Type in 2026.
Bakeries already weigh minor dry ingredients into their dough or premixes, and dry buffered vinegar fits into these steps without new equipment. This helps explain why the segment generated approximately USD 454.2 million in 2026. EU specifications distinguish dried E 267 from the liquid form[1], which matters when comparing activity and the quantity required in a recipe. The grade must deliver a repeatable amount of preservative and remain free flowing during storage. A liquid may suit a site with pumps and tanks, while a blend can combine the vinegar with other recipe inputs. On a dry line, caking or uneven feeding can undermine an otherwise suitable formula.
- Dry buffered vinegar accounts for 42.0% of Type in 2026.
- Caking and uneven feeder delivery can disrupt the dose even when the ingredient meets its chemical specification.
What makes Powder / dry the preferred Form?
Powder / dry accounts for 46.0% of Form in 2026.
Powdered preparations can be weighed into bread batches or incorporated into dry improvers before dough production, and the Powder / dry format accounted for approximately USD 497.4 million in 2026. Both routes depend on dispersion, as a small amount of preservative needs to reach the dough evenly. Comparing purchase prices by weight alone can hide differences in acetic acid activity between grades. A more useful comparison is the quantity needed for the bakery's own formula and the work involved in handling it. Humid storage and repeatedly opened bags also deserve attention, as caked powder loses the convenience of dry addition.
- Powder / dry accounts for 46.0% of Form in 2026.
- Activity, dispersion and storage behaviour provide a more useful comparison than powder weight alone.
Why are Bread & rolls the largest Application?
Bread & rolls account for 38.0% of Application in 2026.
Packaged bread has a moist crumb that makes mould control a direct concern during distribution, and Bread & rolls generated approximately USD 410.9 million of buffered vinegar revenue in 2026. Acceptable appearance and flavour at packing do not guarantee stability throughout the selling period. Buffered vinegar addresses the microbial risk, while other ingredients and processing choices influence how quickly the crumb firms, so the two outcomes need separate checks. Research on weak-acid preservatives also shows that the working pH of the bread affects the result[2]. Following a trial loaf through normal cooling, packaging and storage gives a clearer result than testing the ingredient on its own.
- Bread & rolls account for 38.0% of Application in 2026.
- Mould protection and crumb softness are separate outcomes in a finished-loaf trial.
Why does Conventional dominate the Claim category?
Conventional accounts for 56.0% of Claim in 2026.
Conventional grades held 56.0% of the Claim segment in 2026, as they are purchased against a functional specification before any additional claim is considered. The bakery needs the ingredient to work at an acceptable dose and to carry the correct declaration for its intended use. In the EU, the E 267 rules provide a defined compositional and application reference[1]. Organic or clean-label positioning adds questions about sourcing, but it does not settle the preservation question. Procurement and formulation teams therefore need the same description of the grade being bought.
- Conventional accounts for 56.0% of Claim in 2026.
- The ingredient description must support both the recipe and the declaration used in the destination market.
Why does Direct to industrial bakeries lead the Sales Channel?
Direct to industrial bakeries accounts for 54.0% of Sales Channel in 2026.
Preservative qualification often involves several rounds of discussion between the ingredient maker and the bakery's technical team, and direct supply to industrial bakeries accounted for approximately USD 584.0 million in 2026. The parties may need to agree the activity specification, examine mould challenge results and investigate unwanted flavours. Direct purchasing keeps these discussions close to the production site and makes it easier to identify which later recipe changes require another shelf-life check. Salt, sugar or acidity can change after the original trial while the purchasing specification remains the same. Distributors serve smaller runs and fragmented orders.
- Direct to industrial bakeries accounts for 54.0% of Sales Channel in 2026.
- A later change in dough acidity may require another shelf-life assessment.
What are the drivers, restraints and opportunities in the buffered vinegar market?
Pressure on legacy preservatives drives demand for vinegar-based systems, with recipe sensitivity slowing the replacement of established preservatives and application support creating an opening for suppliers.
Pressure on legacy preservatives drives demand for vinegar-based systems
The search for alternatives to conventional preservatives is the main driver of buffered vinegar demand. In the United States, the FDA finalised its post-market assessment programme for food chemicals in 2026 and opened reviews of several legacy additives[7]. In Europe, the authorisation of E 267 gives bakeries a clear legal basis for vinegar-based preservation[1]. Mould-related losses also occur after a bakery has paid for ingredients, baking, packaging and delivery. Kerry's 2025 shelf-life guidance includes vinegar-based mould control systems in its discussion of this problem[3]. The value of natural food preservatives depends on the selling period they protect along a particular distribution route. Corbion's reference to momentum in natural preservation in 2025[5] indicates that this demand is translating into sales.
Recipe sensitivity slows the replacement of established preservatives
Bread formulas contain several bakery ingredients that influence the conditions in which a preservative works. Acidity is especially important, and raising the dose can affect taste or processing. Moro and colleagues' study of bakery spoilage fungi shows why weak-acid performance needs to be evaluated with pH in mind[2]. As a result, substitution is a technical exercise even when two ingredients have similar descriptions. Trials need to follow the proposed grade through the bakery's normal production and storage sequence. A preservative with an established record has an advantage because the customer already understands its behaviour in the recipe, and replacing it requires enough evidence to justify the testing time.
Application support creates an opening for suppliers
Scaling a preservation system from a trial batch to routine production introduces additional dosing and dispersion requirements. A dry material must pass through the available feeder and disperse evenly, while a liquid needs a suitable addition point and consistent metering. These details link grade selection to the bakery's food processing equipment. Suppliers that offer prediction tools have an advantage in this work. For instance, Kerry's Bakery Shelf-Life Model, reported in its 2025 sustainability statements, is designed to predict mould-free shelf life and reduce food waste[4]. If the recipe, ingredient and dosing conditions are recorded, the bakery can also identify which element changed when performance moves.
Which country CAGRs are profiled in the buffered vinegar market?
Table 4: Country growth outlook for the buffered vinegar market
| Country | CAGR |
|---|---|
| UAE | 14.5% |
| Saudi Arabia | 14.2% |
| USA | 13.9% |
| South Korea | 13.5% |
| Germany | 13.2% |
| UK | 12.9% |
| France | 12.6% |
| Japan | 12.3% |
UAE
- The UAE is the fastest-growing market among the profiled countries, with a forecast CAGR of 14.5% from 2026 to 2036. Distribution time determines the level of preservation UAE bakeries need. Bread sold quickly from one outlet and bread moving through a longer retail chain may need different protection, even when the recipe is the same. Buffered vinegar trials should follow the loaf through the cooling, packaging and storage sequence used for the intended route. A distributor's ability to keep the approved grade available is important, as a change in specification can reopen the testing behind the accepted formula.
Saudi Arabia
- Expansion of packaged bread production in Saudi Arabia requires preservation performance to remain consistent across production lines. Dry addition may fit an existing premix operation, whereas liquid buffered vinegar requires a dependable pumping arrangement. The market is projected to grow at a CAGR of 14.2% over 2026 to 2036. Once a grade is accepted, the activity specification becomes the link between deliveries and the dose used in the recipe. Maintaining that link is especially important when output rises or production moves to a line with different ingredient handling.
USA
- Regulatory change is a particular factor in the United States, where the FDA's 2026 post-market assessment framework has led to reviews of several legacy additives[7]. The USA market is forecast to grow at a CAGR of 13.9% from 2026 to 2036. US suppliers are responding with new products. Kemin, for instance, presented a clean label alternative to calcium propionate for tortillas and baked goods at IFT in July 2026[7]. For an individual plant, the relevant test is whether its bread remains acceptable through the intended distribution period, which requires a clear spoilage target and a separate view of texture.
South Korea
- With a forecast CAGR of 13.5% during 2026 to 2036, South Korea ranks fourth among the profiled countries. Even dispersion is necessary when small quantities of preservative enter a full dough batch, so South Korean bakeries evaluating buffered vinegar should connect pilot work with the normal mixing sequence early in qualification. A dry premix and a separate liquid addition may raise different handling questions. Imported trial grades also need a detailed composition record and an order quantity that fits the test, so that production can expand without introducing new variables.
Germany
- German buyers have a clear European reference for buffered vinegar in Regulation 2023/2086, which identifies E 267 and its authorised uses[1]. Germany's forecast CAGR is 13.2% from 2026 to 2036. Qualification then moves to the bread itself. A mild loaf can reveal a flavour change that is less noticeable in a stronger recipe, while a longer selling period places greater weight on microbial performance. Trials tied to these conditions provide a firmer basis for selection than a general description of vinegar as natural.
UK
- For UK sliced bread, cooling and packaging belong in the evaluation of a new preservative, as testing only the dough formula leaves out conditions that affect the loaf after baking. The UK market is projected to grow at a CAGR of 12.9% from 2026 to 2036. A bakery may keep its existing softness system while adjusting microbial protection, so compatibility with the full recipe is necessary. Large accounts can relate trial results to distribution losses and the cost of an acceptable batch, while smaller producers may first need a modest pack and a manageable test procedure.
France
- France is forecast to grow at a CAGR of 12.6% for 2026 to 2036. Bread distributed beyond the bakery needs different preservation from bread sold the same day, which defines the role of buffered vinegar in the French market. European authorisation specifies particular bread uses for E 267, so the intended application must be confirmed before a trial begins[1]. Within a suitable recipe, the bakery can then test whether the dose protects the selling period while preserving the expected flavour.
Japan
- Japanese bread is typically mild in flavour, which leaves little room for an unwanted taste from preservation. Japan is expected to register the slowest growth among the profiled countries, with a forecast CAGR of 12.3% during 2026 to 2036. Small trial lots allow bakeries to find a dose that balances mould control with the intended sensory result, provided the grade is described precisely. Import and replenishment arrangements must maintain the specification used in those trials, as a change in acetate activity or physical form may alter both the addition step and the finished bread.
Who are the notable companies in the buffered vinegar market?
Kerry Group; Corbion; Kemin Industries; Hawkins; Blendtek
Kerry Group, Corbion, Kemin Industries, Hawkins and Blendtek supply buffered vinegar systems to food manufacturers. Kerry offers IsoAge dry and liquid buffered vinegars and reported 2025 revenue of EUR 6,758.0 million[6]. Corbion supplies Verdad buffered vinegar systems and reported 2025 sales of EUR 1,267.4 million, with momentum in natural preservation[5]. Kemin offers BactoCEASE NV and presented further clean label preservation tools at IFT in July 2026[7]. Hawkins supplies liquid buffered vinegar, and Blendtek includes the ingredient in its portfolio.
An accepted preservative becomes part of a recipe with an established shelf-life result. Consistent activity and notification of product changes help protect that result, and application support is most valuable when it leaves the bakery with a dose, handling procedure and sensory target it can use in routine production.
Competitive Benchmarking: Buffered Vinegar Market
Table 5: Company capabilities in the buffered vinegar market
| Company | Relevant offering | Purchasing consideration |
|---|---|---|
| Kerry Group | IsoAge dry and liquid buffered vinegars | Select grade for the bakery recipe |
| Corbion | Verdad buffered vinegar systems | Match product and permitted application |
| Kemin Industries | BactoCEASE NV buffered vinegar | Review application scope and activity |
| Hawkins | e(Lm)inate V buffered liquid vinegar | Assess liquid handling and supply terms |
| Blendtek | Buffered vinegar ingredient supply | Confirm grade and bakery suitability |
Key Developments in the Buffered Vinegar Market
- In July 2025, Kerry published bakery shelf-life guidance discussing dry and liquid IsoAge vinegar systems as mould control options[3].
- In February 2026, Kerry reported 2025 revenue of EUR 6,758.0 million and volume growth of 3.0%[6].
- In February 2026, Corbion reported 2025 sales of EUR 1,267.4 million, with volume growth in Functional Ingredients & Solutions supported by momentum in natural preservation and shelf-life extension[5].
- In July 2026, Kemin presented a clean label alternative to calcium propionate for tortillas and baked goods at IFT, as the FDA's post-market assessment framework triggered reviews of legacy additives[7].
- Kerry reported the launch of its Bakery Shelf-Life Model in its 2025 sustainability statements, extending its work on predicting mould-free shelf life and reducing food waste[4].
Key Players in the Buffered Vinegar Market
- Kerry Group
- Corbion
- Kemin Industries
- Hawkins
- Blendtek
Buffered Vinegar Market - Report Scope
Table 6: Report scope for the buffered vinegar market
| Coverage field | Report scope |
|---|---|
| Market breakdown | Type; Form; Application; Claim; Sales Channel; Region |
| Quantitative Units | USD Million |
| Market Definition | Revenue from buffered vinegar products sold as preservative ingredients into the specified bakery application categories, including identifiable buffered-vinegar value in blended systems. Excludes bakery retail sales, other ingredients in combinations, unbuffered vinegar, standalone enzymes, finished foods and unrelated preservation services. |
| Regions Covered | North America; Latin America; Western Europe; Eastern Europe; East Asia; South Asia and Pacific; Middle East and Africa |
| Countries Covered | UAE; Saudi Arabia; USA; South Korea; Germany; UK; France; Japan |
| Key Companies Profiled | Kerry Group; Corbion; Kemin Industries; Hawkins; Blendtek |
| Forecast Period | 2026 to 2036 |
| Approach | Market assessment supported by official technical and regulatory publications, company product information and country operating conditions. |
Buffered Vinegar Market - Research Methodology
Table 7: Research approach for the buffered vinegar market
| Method | Approach |
|---|---|
| Market definition | The assessment separates qualifying ingredient revenue from finished bakery products and unrelated formulation inputs. |
| Secondary evidence | Government publications, regulatory material, technical literature and first-party product documentation establish the operating context. |
| Commercial assessment | Product performance, supply continuity and customer qualification requirements are considered within each segment and country profile. |
| Comparability | Market values, segment shares and country forecasts use the stated revenue boundary, units and forecast period. |
Buffered Vinegar Market by Segments
Type
- Dry buffered vinegar
- Liquid buffered
- Blended systems
- Organic
Form
- Powder / dry
- Liquid
- Paste / semi-solid
- Granules / pieces
Application
- Bread & rolls
- Cakes & muffins
- Biscuits & cookies
- Viennoiserie & pastry
- Other bakery & snacks
Claim
- Conventional
- Clean label
- Organic
- Non-GMO / identity preserved
Sales Channel
- Direct to industrial bakeries
- Ingredient distributors
- Foodservice & artisan supply
- Online B2B
Buffered Vinegar Market by Region
- North America
- United States
- Canada
- Latin America
- Brazil
- Mexico
- Argentina
- Chile
- Western Europe
- Germany
- France
- United Kingdom
- Italy
- Spain
- Benelux
- Nordics
- Eastern Europe
- Poland
- Czech Republic
- Romania
- Hungary
- East Asia
- China
- Japan
- South Korea
- South Asia and Pacific
- India
- ASEAN
- Australia and New Zealand
- Middle East and Africa
- GCC Countries
- South Africa
- Türkiye
- Israel
Research Sources and Bibliography
- [1] European Commission. (2023, September 28). Commission Regulation (EU) 2023/2086 on buffered vinegar (E 267).
- [2] Moro, C. B., et al. (2022). Efficacy of weak acid preservatives on spoilage fungi of bakery products.
- [3] Kerry Group. (2025, July 11). Fresh thinking: How to improve bakery shelf life and reduce waste.
- [4] Kerry Group. (2026). Annual report 2025: Sustainability statements.
- [5] Corbion. (2026, February 26). Corbion announces strong full-year 2025 results.
- [6] Kerry Group. (2026, February 17). Kerry Group preliminary statement of results for the year ended 31 December 2025.
- [7] Saraceno, N. (2026, July 14). Nutritional Outlook. Kemin highlights clean label reformulation tools for preservatives and dough conditioners at IFT.
Future Market Insights. (2026). Buffered Vinegar Market: Global Industry Analysis and Opportunity Assessment 2036.
This Report Answers
- How large is the buffered vinegar market in 2026 and 2036?
- Which bakery waste and distribution pressures support buffered vinegar demand?
- Why does Dry buffered vinegar lead Type?
- What makes Powder / dry the preferred Form?
- How do the profiled country growth rates differ?
- Which profiled companies offer buffered vinegar or adjacent bakery technologies?
Table of Content
Table of Content
- Key Takeaways
- Market Size and CAGR
- Top Growth Driver
- Fastest Growing Segment
- Leading Region
- Key Companies
- Emerging Opportunities
- Executive Summary
- Global Market Outlook
- Demand-side Trends
- Supply-side Trends
- Technology Roadmap Analysis
- Analysis and Recommendations
- Analyst Perspective (What is happening? Why now? What should investors know?)
- Key Questions Answered
- How large is the market?
- What is the CAGR?
- What are key trends?
- Which region dominates?
- Who are the leaders?
Read More...
- Market Overview
- Market Coverage / Taxonomy
- Market Definition / Scope / Limitations
- Research Methodology
- Chapter Orientation
- Analytical Lens and Working Hypotheses
- Market Structure, Signals, and Trend Drivers
- Benchmarking and Cross-market Comparability
- Market Sizing, Forecasting, and Opportunity Mapping
- Research Design and Evidence Framework
- Desk Research Programme (Secondary Evidence)
- Expert Input and Fieldwork (Primary Evidence)
- Tooling, Models, and Reference Databases
- Data Engineering and Model Build
- Quality Assurance and Audit Trail
- Market Background
- Market Dynamics (Drivers, Restraints, Opportunity, Trends)
- Scenario Forecast (Optimistic, Likely, Conservative)
- Impact Analysis
- AI Impact
- Sustainability Impact
- Regulatory Impact
- Technology Impact
- Consumer / Buyer Analysis
- Purchase Drivers
- Adoption Barriers
- Buyer Journey
- Opportunity Map Analysis
- Product Life Cycle Analysis
- Supply Chain Analysis
- Investment Feasibility Matrix
- Value Chain Analysis
- PESTLE and Porter's Analysis
- Regulatory Landscape
- Regional Parent Market Outlook
- Production and Consumption Statistics
- Import and Export Statistics
- Global Market Analysis and Forecast, 2021 to 2036
- Historical Market Size Value (USD Million) Analysis, 2021 to 2025
- Current and Future Market Size Value (USD Million) Projections, 2026 to 2036
- Y-o-Y Growth Trend Analysis
- Absolute $ Opportunity Analysis
- Global Market Pricing Analysis, 2021 to 2036
- Global Market Analysis and Forecast, By Type, 2021 to 2036
- Introduction / Key Findings
- Historical Market Size Value (USD Million) Analysis By Type, 2021 to 2025
- Current and Future Market Size Value (USD Million) Analysis and Forecast By Type, 2026 to 2036
- Dry buffered vinegar
- Liquid buffered
- Blended systems
- Organic
- Y-o-Y Growth Trend Analysis By Type, 2021 to 2025
- Absolute $ Opportunity Analysis By Type, 2026 to 2036
- Global Market Analysis and Forecast, By Form, 2021 to 2036
- Introduction / Key Findings
- Historical Market Size Value (USD Million) Analysis By Form, 2021 to 2025
- Current and Future Market Size Value (USD Million) Analysis and Forecast By Form, 2026 to 2036
- Powder / dry
- Liquid
- Paste / semi-solid
- Granules / pieces
- Y-o-Y Growth Trend Analysis By Form, 2021 to 2025
- Absolute $ Opportunity Analysis By Form, 2026 to 2036
- Global Market Analysis and Forecast, By Application, 2021 to 2036
- Introduction / Key Findings
- Historical Market Size Value (USD Million) Analysis By Application, 2021 to 2025
- Current and Future Market Size Value (USD Million) Analysis and Forecast By Application, 2026 to 2036
- Bread & rolls
- Cakes & muffins
- Biscuits & cookies
- Viennoiserie & pastry
- Other bakery & snacks
- Y-o-Y Growth Trend Analysis By Application, 2021 to 2025
- Absolute $ Opportunity Analysis By Application, 2026 to 2036
- Global Market Analysis and Forecast, By Claim, 2021 to 2036
- Introduction / Key Findings
- Historical Market Size Value (USD Million) Analysis By Claim, 2021 to 2025
- Current and Future Market Size Value (USD Million) Analysis and Forecast By Claim, 2026 to 2036
- Conventional
- Clean label
- Organic
- Non-GMO / identity preserved
- Y-o-Y Growth Trend Analysis By Claim, 2021 to 2025
- Absolute $ Opportunity Analysis By Claim, 2026 to 2036
- Global Market Analysis and Forecast, By Sales Channel, 2021 to 2036
- Introduction / Key Findings
- Historical Market Size Value (USD Million) Analysis By Sales Channel, 2021 to 2025
- Current and Future Market Size Value (USD Million) Analysis and Forecast By Sales Channel, 2026 to 2036
- Direct to industrial bakeries
- Ingredient distributors
- Foodservice & artisan supply
- Online B2B
- Y-o-Y Growth Trend Analysis By Sales Channel, 2021 to 2025
- Absolute $ Opportunity Analysis By Sales Channel, 2026 to 2036
- Global Market Analysis and Forecast, By Region, 2021 to 2036
- Introduction
- Historical Market Size Value (USD Million) Analysis By Region, 2021 to 2025
- Current Market Size Value (USD Million) Analysis and Forecast By Region, 2026 to 2036
- North America
- Latin America
- Western Europe
- Eastern Europe
- East Asia
- South Asia and Pacific
- Middle East and Africa
- Market Attractiveness Analysis By Region
- North America Market Analysis and Forecast, By Country, 2021 to 2036
- Historical Market Size Value (USD Million) Trend Analysis By Market Taxonomy, 2021 to 2025
- Market Size Value (USD Million) Forecast By Market Taxonomy, 2026 to 2036
- By Country
- United States
- Canada
- By Type
- By Form
- By Application
- By Claim
- By Sales Channel
- By Country
- Market Attractiveness Analysis
- By Country
- By Type
- By Form
- By Application
- By Claim
- By Sales Channel
- Key Takeaways
- Latin America Market Analysis and Forecast, By Country
- Historical Market Size Value (USD Million) Trend Analysis By Market Taxonomy, 2021 to 2025
- Market Size Value (USD Million) Forecast By Market Taxonomy, 2026 to 2036
- By Country
- Brazil
- Mexico
- Argentina
- Chile
- By Type
- By Form
- By Application
- By Claim
- By Sales Channel
- By Country
- Market Attractiveness Analysis
- By Country
- By Type
- By Form
- By Application
- By Claim
- By Sales Channel
- Key Takeaways
- Western Europe Market Analysis and Forecast, By Country
- Historical Market Size Value (USD Million) Trend Analysis By Market Taxonomy, 2021 to 2025
- Market Size Value (USD Million) Forecast By Market Taxonomy, 2026 to 2036
- By Country
- Germany
- France
- United Kingdom
- Italy
- Spain
- Benelux
- Nordics
- By Type
- By Form
- By Application
- By Claim
- By Sales Channel
- By Country
- Market Attractiveness Analysis
- By Country
- By Type
- By Form
- By Application
- By Claim
- By Sales Channel
- Key Takeaways
- Eastern Europe Market Analysis and Forecast, By Country
- Historical Market Size Value (USD Million) Trend Analysis By Market Taxonomy, 2021 to 2025
- Market Size Value (USD Million) Forecast By Market Taxonomy, 2026 to 2036
- By Country
- Poland
- Czech Republic
- Romania
- Hungary
- By Type
- By Form
- By Application
- By Claim
- By Sales Channel
- By Country
- Market Attractiveness Analysis
- By Country
- By Type
- By Form
- By Application
- By Claim
- By Sales Channel
- Key Takeaways
- East Asia Market Analysis and Forecast, By Country
- Historical Market Size Value (USD Million) Trend Analysis By Market Taxonomy, 2021 to 2025
- Market Size Value (USD Million) Forecast By Market Taxonomy, 2026 to 2036
- By Country
- China
- Japan
- South Korea
- By Type
- By Form
- By Application
- By Claim
- By Sales Channel
- By Country
- Market Attractiveness Analysis
- By Country
- By Type
- By Form
- By Application
- By Claim
- By Sales Channel
- Key Takeaways
- South Asia and Pacific Market Analysis and Forecast, By Country
- Historical Market Size Value (USD Million) Trend Analysis By Market Taxonomy, 2021 to 2025
- Market Size Value (USD Million) Forecast By Market Taxonomy, 2026 to 2036
- By Country
- India
- ASEAN
- Australia and New Zealand
- By Type
- By Form
- By Application
- By Claim
- By Sales Channel
- By Country
- Market Attractiveness Analysis
- By Country
- By Type
- By Form
- By Application
- By Claim
- By Sales Channel
- Key Takeaways
- Middle East and Africa Market Analysis and Forecast, By Country
- Historical Market Size Value (USD Million) Trend Analysis By Market Taxonomy, 2021 to 2025
- Market Size Value (USD Million) Forecast By Market Taxonomy, 2026 to 2036
- By Country
- GCC Countries
- South Africa
- Türkiye
- Israel
- By Type
- By Form
- By Application
- By Claim
- By Sales Channel
- By Country
- Market Attractiveness Analysis
- By Country
- By Type
- By Form
- By Application
- By Claim
- By Sales Channel
- Key Takeaways
- Key Countries Market Analysis
- United States
- Pricing Analysis
- Market Share Analysis, 2025
- By Type
- By Form
- By Application
- By Claim
- By Sales Channel
- Canada
- Pricing Analysis
- Market Share Analysis, 2025
- By Type
- By Form
- By Application
- By Claim
- By Sales Channel
- Mexico
- Pricing Analysis
- Market Share Analysis, 2025
- By Type
- By Form
- By Application
- By Claim
- By Sales Channel
- Brazil
- Pricing Analysis
- Market Share Analysis, 2025
- By Type
- By Form
- By Application
- By Claim
- By Sales Channel
- Chile
- Pricing Analysis
- Market Share Analysis, 2025
- By Type
- By Form
- By Application
- By Claim
- By Sales Channel
- Germany
- Pricing Analysis
- Market Share Analysis, 2025
- By Type
- By Form
- By Application
- By Claim
- By Sales Channel
- United Kingdom
- Pricing Analysis
- Market Share Analysis, 2025
- By Type
- By Form
- By Application
- By Claim
- By Sales Channel
- Italy
- Pricing Analysis
- Market Share Analysis, 2025
- By Type
- By Form
- By Application
- By Claim
- By Sales Channel
- Spain
- Pricing Analysis
- Market Share Analysis, 2025
- By Type
- By Form
- By Application
- By Claim
- By Sales Channel
- France
- Pricing Analysis
- Market Share Analysis, 2025
- By Type
- By Form
- By Application
- By Claim
- By Sales Channel
- India
- Pricing Analysis
- Market Share Analysis, 2025
- By Type
- By Form
- By Application
- By Claim
- By Sales Channel
- ASEAN
- Pricing Analysis
- Market Share Analysis, 2025
- By Type
- By Form
- By Application
- By Claim
- By Sales Channel
- Australia and New Zealand
- Pricing Analysis
- Market Share Analysis, 2025
- By Type
- By Form
- By Application
- By Claim
- By Sales Channel
- China
- Pricing Analysis
- Market Share Analysis, 2025
- By Type
- By Form
- By Application
- By Claim
- By Sales Channel
- Japan
- Pricing Analysis
- Market Share Analysis, 2025
- By Type
- By Form
- By Application
- By Claim
- By Sales Channel
- South Korea
- Pricing Analysis
- Market Share Analysis, 2025
- By Type
- By Form
- By Application
- By Claim
- By Sales Channel
- Poland
- Pricing Analysis
- Market Share Analysis, 2025
- By Type
- By Form
- By Application
- By Claim
- By Sales Channel
- Hungary
- Pricing Analysis
- Market Share Analysis, 2025
- By Type
- By Form
- By Application
- By Claim
- By Sales Channel
- Türkiye
- Pricing Analysis
- Market Share Analysis, 2025
- By Type
- By Form
- By Application
- By Claim
- By Sales Channel
- South Africa
- Pricing Analysis
- Market Share Analysis, 2025
- By Type
- By Form
- By Application
- By Claim
- By Sales Channel
- UAE
- Pricing Analysis
- Market Share Analysis, 2025
- By Type
- By Form
- By Application
- By Claim
- By Sales Channel
- Saudi Arabia
- Pricing Analysis
- Market Share Analysis, 2025
- By Type
- By Form
- By Application
- By Claim
- By Sales Channel
- United States
- Market Structure Analysis
- Competition Dashboard
- Competition Benchmarking
- Market Share Analysis of Top Players
- By Regional
- By Type
- By Form
- By Application
- By Claim
- By Sales Channel
- Emerging Startups
- Innovation Benchmarking
- Competition Analysis
- Competition Deep Dive
- Kerry Group
- Overview
- Product Portfolio
- Profitability by Market Segments
- Sales Footprint
- Strategy Overview
- Marketing Strategy
- Product Strategy
- Channel Strategy
- Corbion
- Kemin Industries
- Hawkins
- Blendtek
- Kerry Group
- Case Studies
- Success Stories
- Recent Developments
- Competition Deep Dive
- Assumptions & Acronyms Used
List of Tables
- Table 1: Global Market Value (USD Million) Forecast by Region, 2021 to 2036
- Table 2: Global Market Value (USD Million) Forecast by Type, 2021 to 2036
- Table 3: Global Market Value (USD Million) Forecast by Form, 2021 to 2036
- Table 4: Global Market Value (USD Million) Forecast by Application, 2021 to 2036
- Table 5: Global Market Value (USD Million) Forecast by Claim, 2021 to 2036
- Table 6: Global Market Value (USD Million) Forecast by Sales Channel, 2021 to 2036
- Table 7: North America Market Value (USD Million) Forecast by Country, 2021 to 2036
- Table 8: North America Market Value (USD Million) Forecast by Type, 2021 to 2036
- Table 9: North America Market Value (USD Million) Forecast by Form, 2021 to 2036
- Table 10: North America Market Value (USD Million) Forecast by Application, 2021 to 2036
- Table 11: North America Market Value (USD Million) Forecast by Claim, 2021 to 2036
- Table 12: North America Market Value (USD Million) Forecast by Sales Channel, 2021 to 2036
- Table 13: Latin America Market Value (USD Million) Forecast by Country, 2021 to 2036
- Table 14: Latin America Market Value (USD Million) Forecast by Type, 2021 to 2036
- Table 15: Latin America Market Value (USD Million) Forecast by Form, 2021 to 2036
- Table 16: Latin America Market Value (USD Million) Forecast by Application, 2021 to 2036
- Table 17: Latin America Market Value (USD Million) Forecast by Claim, 2021 to 2036
- Table 18: Latin America Market Value (USD Million) Forecast by Sales Channel, 2021 to 2036
- Table 19: Western Europe Market Value (USD Million) Forecast by Country, 2021 to 2036
- Table 20: Western Europe Market Value (USD Million) Forecast by Type, 2021 to 2036
- Table 21: Western Europe Market Value (USD Million) Forecast by Form, 2021 to 2036
- Table 22: Western Europe Market Value (USD Million) Forecast by Application, 2021 to 2036
- Table 23: Western Europe Market Value (USD Million) Forecast by Claim, 2021 to 2036
- Table 24: Western Europe Market Value (USD Million) Forecast by Sales Channel, 2021 to 2036
- Table 25: Eastern Europe Market Value (USD Million) Forecast by Country, 2021 to 2036
- Table 26: Eastern Europe Market Value (USD Million) Forecast by Type, 2021 to 2036
- Table 27: Eastern Europe Market Value (USD Million) Forecast by Form, 2021 to 2036
- Table 28: Eastern Europe Market Value (USD Million) Forecast by Application, 2021 to 2036
- Table 29: Eastern Europe Market Value (USD Million) Forecast by Claim, 2021 to 2036
- Table 30: Eastern Europe Market Value (USD Million) Forecast by Sales Channel, 2021 to 2036
- Table 31: East Asia Market Value (USD Million) Forecast by Country, 2021 to 2036
- Table 32: East Asia Market Value (USD Million) Forecast by Type, 2021 to 2036
- Table 33: East Asia Market Value (USD Million) Forecast by Form, 2021 to 2036
- Table 34: East Asia Market Value (USD Million) Forecast by Application, 2021 to 2036
- Table 35: East Asia Market Value (USD Million) Forecast by Claim, 2021 to 2036
- Table 36: East Asia Market Value (USD Million) Forecast by Sales Channel, 2021 to 2036
- Table 37: South Asia and Pacific Market Value (USD Million) Forecast by Country, 2021 to 2036
- Table 38: South Asia and Pacific Market Value (USD Million) Forecast by Type, 2021 to 2036
- Table 39: South Asia and Pacific Market Value (USD Million) Forecast by Form, 2021 to 2036
- Table 40: South Asia and Pacific Market Value (USD Million) Forecast by Application, 2021 to 2036
- Table 41: South Asia and Pacific Market Value (USD Million) Forecast by Claim, 2021 to 2036
- Table 42: South Asia and Pacific Market Value (USD Million) Forecast by Sales Channel, 2021 to 2036
- Table 43: Middle East and Africa Market Value (USD Million) Forecast by Country, 2021 to 2036
- Table 44: Middle East and Africa Market Value (USD Million) Forecast by Type, 2021 to 2036
- Table 45: Middle East and Africa Market Value (USD Million) Forecast by Form, 2021 to 2036
- Table 46: Middle East and Africa Market Value (USD Million) Forecast by Application, 2021 to 2036
- Table 47: Middle East and Africa Market Value (USD Million) Forecast by Claim, 2021 to 2036
- Table 48: Middle East and Africa Market Value (USD Million) Forecast by Sales Channel, 2021 to 2036
List of Figures
- Figure 1: Global Market Pricing Analysis
- Figure 2: Global Market Value (USD Million) Forecast 2021-2036
- Figure 3: Global Market Value Share and BPS Analysis by Type, 2026 and 2036
- Figure 4: Global Market Y-o-Y Growth Comparison by Type, 2026-2036
- Figure 5: Global Market Attractiveness Analysis by Type
- Figure 6: Global Market Value Share and BPS Analysis by Form, 2026 and 2036
- Figure 7: Global Market Y-o-Y Growth Comparison by Form, 2026-2036
- Figure 8: Global Market Attractiveness Analysis by Form
- Figure 9: Global Market Value Share and BPS Analysis by Application, 2026 and 2036
- Figure 10: Global Market Y-o-Y Growth Comparison by Application, 2026-2036
- Figure 11: Global Market Attractiveness Analysis by Application
- Figure 12: Global Market Value Share and BPS Analysis by Claim, 2026 and 2036
- Figure 13: Global Market Y-o-Y Growth Comparison by Claim, 2026-2036
- Figure 14: Global Market Attractiveness Analysis by Claim
- Figure 15: Global Market Value Share and BPS Analysis by Sales Channel, 2026 and 2036
- Figure 16: Global Market Y-o-Y Growth Comparison by Sales Channel, 2026-2036
- Figure 17: Global Market Attractiveness Analysis by Sales Channel
- Figure 18: Global Market Value (USD Million) Share and BPS Analysis by Region, 2026 and 2036
- Figure 19: Global Market Y-o-Y Growth Comparison by Region, 2026-2036
- Figure 20: Global Market Attractiveness Analysis by Region
- Figure 21: North America Market Incremental Dollar Opportunity, 2026-2036
- Figure 22: Latin America Market Incremental Dollar Opportunity, 2026-2036
- Figure 23: Western Europe Market Incremental Dollar Opportunity, 2026-2036
- Figure 24: Eastern Europe Market Incremental Dollar Opportunity, 2026-2036
- Figure 25: East Asia Market Incremental Dollar Opportunity, 2026-2036
- Figure 26: South Asia and Pacific Market Incremental Dollar Opportunity, 2026-2036
- Figure 27: Middle East and Africa Market Incremental Dollar Opportunity, 2026-2036
- Figure 28: North America Market Value Share and BPS Analysis by Country, 2026 and 2036
- Figure 29: North America Market Value Share and BPS Analysis by Type, 2026 and 2036
- Figure 30: North America Market Y-o-Y Growth Comparison by Type, 2026-2036
- Figure 31: North America Market Attractiveness Analysis by Type
- Figure 32: North America Market Value Share and BPS Analysis by Form, 2026 and 2036
- Figure 33: North America Market Y-o-Y Growth Comparison by Form, 2026-2036
- Figure 34: North America Market Attractiveness Analysis by Form
- Figure 35: North America Market Value Share and BPS Analysis by Application, 2026 and 2036
- Figure 36: North America Market Y-o-Y Growth Comparison by Application, 2026-2036
- Figure 37: North America Market Attractiveness Analysis by Application
- Figure 38: North America Market Value Share and BPS Analysis by Claim, 2026 and 2036
- Figure 39: North America Market Y-o-Y Growth Comparison by Claim, 2026-2036
- Figure 40: North America Market Attractiveness Analysis by Claim
- Figure 41: North America Market Value Share and BPS Analysis by Sales Channel, 2026 and 2036
- Figure 42: North America Market Y-o-Y Growth Comparison by Sales Channel, 2026-2036
- Figure 43: North America Market Attractiveness Analysis by Sales Channel
- Figure 44: Latin America Market Value Share and BPS Analysis by Country, 2026 and 2036
- Figure 45: Latin America Market Value Share and BPS Analysis by Type, 2026 and 2036
- Figure 46: Latin America Market Y-o-Y Growth Comparison by Type, 2026-2036
- Figure 47: Latin America Market Attractiveness Analysis by Type
- Figure 48: Latin America Market Value Share and BPS Analysis by Form, 2026 and 2036
- Figure 49: Latin America Market Y-o-Y Growth Comparison by Form, 2026-2036
- Figure 50: Latin America Market Attractiveness Analysis by Form
- Figure 51: Latin America Market Value Share and BPS Analysis by Application, 2026 and 2036
- Figure 52: Latin America Market Y-o-Y Growth Comparison by Application, 2026-2036
- Figure 53: Latin America Market Attractiveness Analysis by Application
- Figure 54: Latin America Market Value Share and BPS Analysis by Claim, 2026 and 2036
- Figure 55: Latin America Market Y-o-Y Growth Comparison by Claim, 2026-2036
- Figure 56: Latin America Market Attractiveness Analysis by Claim
- Figure 57: Latin America Market Value Share and BPS Analysis by Sales Channel, 2026 and 2036
- Figure 58: Latin America Market Y-o-Y Growth Comparison by Sales Channel, 2026-2036
- Figure 59: Latin America Market Attractiveness Analysis by Sales Channel
- Figure 60: Western Europe Market Value Share and BPS Analysis by Country, 2026 and 2036
- Figure 61: Western Europe Market Value Share and BPS Analysis by Type, 2026 and 2036
- Figure 62: Western Europe Market Y-o-Y Growth Comparison by Type, 2026-2036
- Figure 63: Western Europe Market Attractiveness Analysis by Type
- Figure 64: Western Europe Market Value Share and BPS Analysis by Form, 2026 and 2036
- Figure 65: Western Europe Market Y-o-Y Growth Comparison by Form, 2026-2036
- Figure 66: Western Europe Market Attractiveness Analysis by Form
- Figure 67: Western Europe Market Value Share and BPS Analysis by Application, 2026 and 2036
- Figure 68: Western Europe Market Y-o-Y Growth Comparison by Application, 2026-2036
- Figure 69: Western Europe Market Attractiveness Analysis by Application
- Figure 70: Western Europe Market Value Share and BPS Analysis by Claim, 2026 and 2036
- Figure 71: Western Europe Market Y-o-Y Growth Comparison by Claim, 2026-2036
- Figure 72: Western Europe Market Attractiveness Analysis by Claim
- Figure 73: Western Europe Market Value Share and BPS Analysis by Sales Channel, 2026 and 2036
- Figure 74: Western Europe Market Y-o-Y Growth Comparison by Sales Channel, 2026-2036
- Figure 75: Western Europe Market Attractiveness Analysis by Sales Channel
- Figure 76: Eastern Europe Market Value Share and BPS Analysis by Country, 2026 and 2036
- Figure 77: Eastern Europe Market Value Share and BPS Analysis by Type, 2026 and 2036
- Figure 78: Eastern Europe Market Y-o-Y Growth Comparison by Type, 2026-2036
- Figure 79: Eastern Europe Market Attractiveness Analysis by Type
- Figure 80: Eastern Europe Market Value Share and BPS Analysis by Form, 2026 and 2036
- Figure 81: Eastern Europe Market Y-o-Y Growth Comparison by Form, 2026-2036
- Figure 82: Eastern Europe Market Attractiveness Analysis by Form
- Figure 83: Eastern Europe Market Value Share and BPS Analysis by Application, 2026 and 2036
- Figure 84: Eastern Europe Market Y-o-Y Growth Comparison by Application, 2026-2036
- Figure 85: Eastern Europe Market Attractiveness Analysis by Application
- Figure 86: Eastern Europe Market Value Share and BPS Analysis by Claim, 2026 and 2036
- Figure 87: Eastern Europe Market Y-o-Y Growth Comparison by Claim, 2026-2036
- Figure 88: Eastern Europe Market Attractiveness Analysis by Claim
- Figure 89: Eastern Europe Market Value Share and BPS Analysis by Sales Channel, 2026 and 2036
- Figure 90: Eastern Europe Market Y-o-Y Growth Comparison by Sales Channel, 2026-2036
- Figure 91: Eastern Europe Market Attractiveness Analysis by Sales Channel
- Figure 92: East Asia Market Value Share and BPS Analysis by Country, 2026 and 2036
- Figure 93: East Asia Market Value Share and BPS Analysis by Type, 2026 and 2036
- Figure 94: East Asia Market Y-o-Y Growth Comparison by Type, 2026-2036
- Figure 95: East Asia Market Attractiveness Analysis by Type
- Figure 96: East Asia Market Value Share and BPS Analysis by Form, 2026 and 2036
- Figure 97: East Asia Market Y-o-Y Growth Comparison by Form, 2026-2036
- Figure 98: East Asia Market Attractiveness Analysis by Form
- Figure 99: East Asia Market Value Share and BPS Analysis by Application, 2026 and 2036
- Figure 100: East Asia Market Y-o-Y Growth Comparison by Application, 2026-2036
- Figure 101: East Asia Market Attractiveness Analysis by Application
- Figure 102: East Asia Market Value Share and BPS Analysis by Claim, 2026 and 2036
- Figure 103: East Asia Market Y-o-Y Growth Comparison by Claim, 2026-2036
- Figure 104: East Asia Market Attractiveness Analysis by Claim
- Figure 105: East Asia Market Value Share and BPS Analysis by Sales Channel, 2026 and 2036
- Figure 106: East Asia Market Y-o-Y Growth Comparison by Sales Channel, 2026-2036
- Figure 107: East Asia Market Attractiveness Analysis by Sales Channel
- Figure 108: South Asia and Pacific Market Value Share and BPS Analysis by Country, 2026 and 2036
- Figure 109: South Asia and Pacific Market Value Share and BPS Analysis by Type, 2026 and 2036
- Figure 110: South Asia and Pacific Market Y-o-Y Growth Comparison by Type, 2026-2036
- Figure 111: South Asia and Pacific Market Attractiveness Analysis by Type
- Figure 112: South Asia and Pacific Market Value Share and BPS Analysis by Form, 2026 and 2036
- Figure 113: South Asia and Pacific Market Y-o-Y Growth Comparison by Form, 2026-2036
- Figure 114: South Asia and Pacific Market Attractiveness Analysis by Form
- Figure 115: South Asia and Pacific Market Value Share and BPS Analysis by Application, 2026 and 2036
- Figure 116: South Asia and Pacific Market Y-o-Y Growth Comparison by Application, 2026-2036
- Figure 117: South Asia and Pacific Market Attractiveness Analysis by Application
- Figure 118: South Asia and Pacific Market Value Share and BPS Analysis by Claim, 2026 and 2036
- Figure 119: South Asia and Pacific Market Y-o-Y Growth Comparison by Claim, 2026-2036
- Figure 120: South Asia and Pacific Market Attractiveness Analysis by Claim
- Figure 121: South Asia and Pacific Market Value Share and BPS Analysis by Sales Channel, 2026 and 2036
- Figure 122: South Asia and Pacific Market Y-o-Y Growth Comparison by Sales Channel, 2026-2036
- Figure 123: South Asia and Pacific Market Attractiveness Analysis by Sales Channel
- Figure 124: Middle East and Africa Market Value Share and BPS Analysis by Country, 2026 and 2036
- Figure 125: Middle East and Africa Market Value Share and BPS Analysis by Type, 2026 and 2036
- Figure 126: Middle East and Africa Market Y-o-Y Growth Comparison by Type, 2026-2036
- Figure 127: Middle East and Africa Market Attractiveness Analysis by Type
- Figure 128: Middle East and Africa Market Value Share and BPS Analysis by Form, 2026 and 2036
- Figure 129: Middle East and Africa Market Y-o-Y Growth Comparison by Form, 2026-2036
- Figure 130: Middle East and Africa Market Attractiveness Analysis by Form
- Figure 131: Middle East and Africa Market Value Share and BPS Analysis by Application, 2026 and 2036
- Figure 132: Middle East and Africa Market Y-o-Y Growth Comparison by Application, 2026-2036
- Figure 133: Middle East and Africa Market Attractiveness Analysis by Application
- Figure 134: Middle East and Africa Market Value Share and BPS Analysis by Claim, 2026 and 2036
- Figure 135: Middle East and Africa Market Y-o-Y Growth Comparison by Claim, 2026-2036
- Figure 136: Middle East and Africa Market Attractiveness Analysis by Claim
- Figure 137: Middle East and Africa Market Value Share and BPS Analysis by Sales Channel, 2026 and 2036
- Figure 138: Middle East and Africa Market Y-o-Y Growth Comparison by Sales Channel, 2026-2036
- Figure 139: Middle East and Africa Market Attractiveness Analysis by Sales Channel
- Figure 140: Global Market - Tier Structure Analysis
- Figure 141: Global Market - Company Share Analysis
Frequently Asked Questions
How big is the buffered vinegar market in 2026 and what is the 2036 outlook?
The market is valued at USD 1,081.4 million in 2026 and is forecast to reach USD 3,736.4 million by 2036. These values cover buffered vinegar ingredient revenue within the defined bakery scope.
What CAGR is forecast for the buffered vinegar market from 2026 to 2036?
The market is forecast to grow at a CAGR of 13.2% from 2026 to 2036, supported by the replacement of conventional preservatives.
Which Type segment leads buffered vinegar in 2026?
Dry buffered vinegar leads with 42.0% in 2026, as it fits the dry ingredient handling already used in bakeries.
Which Form segment leads in 2026?
Powder / dry leads with 46.0% in 2026, as it can be weighed into dough or blended into dry improvers.
Which profiled countries have the highest buffered vinegar growth rates?
The UAE leads at 14.5%, followed by Saudi Arabia at 14.2% and the USA at 13.9% from 2026 to 2036.
Which companies participate in buffered vinegar and adjacent bakery solutions?
The report profiles Kerry Group, Corbion, Kemin Industries, Hawkins and Blendtek.
Preview the report firsthand - request a free sample
Get SampleGet the brochure for pricing and purchase details.
Get PDF
