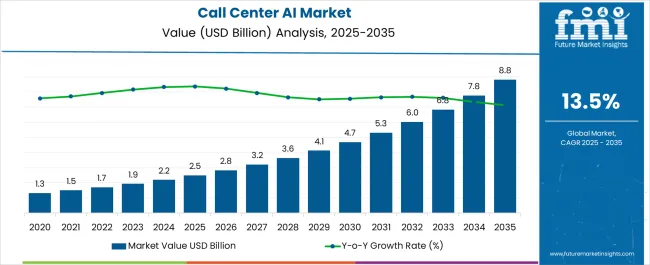
The Call Center AI Market is estimated to be valued at USD 2.5 billion in 2025 and is projected to reach USD 8.8 billion by 2035, registering a compound annual growth rate (CAGR) of 13.5% over the forecast period.

| Metric | Value |
|---|---|
| Call Center AI Market Estimated Value in (2025 E) | USD 2.5 billion |
| Call Center AI Market Forecast Value in (2035 F) | USD 8.8 billion |
| Forecast CAGR (2025 to 2035) | 13.5% |
The call center AI market is witnessing accelerated momentum, fueled by the surge in digital transformation initiatives, increased call volumes, and demand for enhanced customer experience. Enterprises are rapidly integrating AI-driven solutions to reduce response time, improve first-contact resolution, and enhance agent productivity. Cloud-native infrastructure adoption has enabled scalable deployments with real-time data access, which is driving cross-sector implementation.
Additionally, natural language processing (NLP), speech analytics, and sentiment detection capabilities have matured, offering organizations intelligent decision-making and automation advantages. Regulatory requirements around customer data management and compliance have further pushed enterprises to adopt secure, traceable AI solutions.
The growing need for personalization, multilingual support, and 24/7 self-service capabilities continues to position AI as a core investment for customer-facing operations. Looking ahead, increased hybrid work models, omnichannel strategies, and AI-human collaboration tools are expected to shape the future roadmap of the industry.
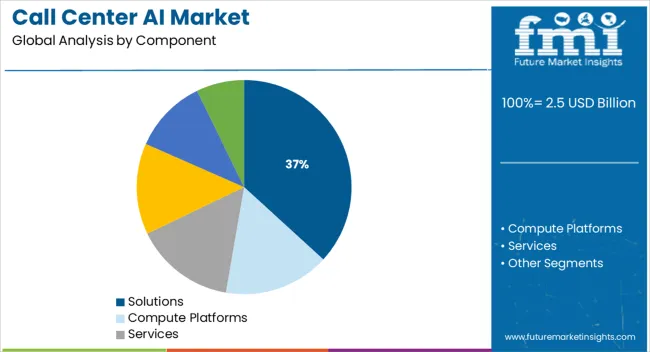
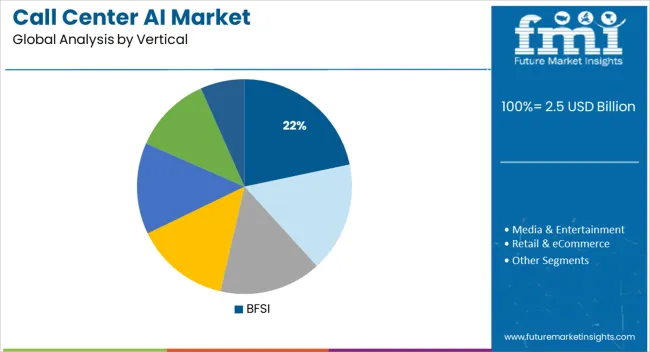
The market is segmented by Component, Deployment Type, and Vertical and region. By Component, the market is divided into Solutions, Compute Platforms, Services, Training & Consulting Services, System Integration & Deployment Services, and Support & Maintenance Services. In terms of Deployment Type, the market is classified into Cloud and On-premises. Based on Vertical, the market is segmented into BFSI, Media & Entertainment, Retail & eCommerce, Travel & Hospitality, Telecom, Healthcare, and Others (Automotive, Government, Manufacturing, Education, and Energy & Utilities). Regionally, the market is classified into North America, Latin America, Western Europe, Eastern Europe, Balkan & Baltic Countries, Russia & Belarus, Central Asia, East Asia, South Asia & Pacific, and the Middle East & Africa.

Solutions are projected to account for 36.8% of the total revenue in the call center AI market by 2025, making it the dominant component. This segment’s growth is being driven by the rapid deployment of intelligent software platforms that integrate voice bots, chatbots, and real-time analytics.
Enterprises are increasingly prioritizing software that enables self-service workflows, predictive call routing, and performance optimization. The evolution of AI algorithms has enhanced the contextual understanding of customer intent, allowing for dynamic and responsive engagement.
Furthermore, integration with CRM systems, workforce management tools, and business intelligence platforms has made AI solutions an indispensable part of modern contact center architecture. As businesses aim to reduce operational costs while improving customer satisfaction scores, AI-powered software continues to outperform traditional tools across all key performance indicators.

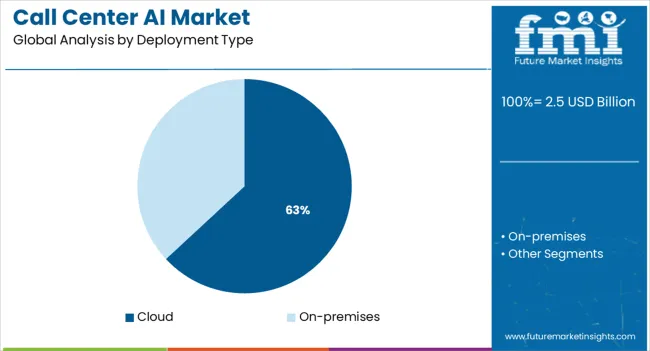
Cloud deployment is expected to contribute 63.1% of the overall market revenue by 2025, leading the deployment type segment. Its dominance is underpinned by the agility, scalability, and cost-efficiency offered by cloud-hosted platforms.
Organizations are increasingly shifting toward cloud-native solutions to support distributed contact center operations, remote workforces, and real-time data accessibility. The reduced need for on-premise infrastructure has enabled faster rollouts and simplified upgrades, while ensuring high availability and disaster recovery capabilities.
Data encryption, secure APIs, and compliance with data residency regulations have strengthened enterprise confidence in cloud-based AI deployments. As digital-first customer engagement becomes the norm, cloud platforms are playing a central role in enabling AI capabilities across voice, text, and video channels at scale.

The BFSI sector is expected to hold 21.7% of the total market share in 2025, making it the leading vertical adopting call center AI. This leadership is being driven by the industry's need for operational efficiency, fraud prevention, and superior customer service.
Financial institutions are leveraging AI for tasks such as identity verification, transaction monitoring, and customer onboarding, all of which require fast, secure, and accurate communication channels. The complexity and sensitivity of banking and insurance queries have made intelligent automation essential for reducing human error and ensuring compliance with regulatory norms.
AI is also enabling personalized financial advice and real-time support across multiple languages and channels, enhancing the overall customer journey. The strong push toward digital banking and the growing volume of virtual customer interactions continue to position BFSI as the most mature adopter of AI in call center operations.
The Asia Pacific is anticipated to yield significant growth opportunities, backed by a flourishing end-use industry like BFSI, healthcare, and the retail sector. By 2035-end, the Asia Pacific region is estimated to capture a Y-o-Y growth rate of 13%. Large investments in call center solutions by countries such as China, Japan, India, and the Philippines are fuelling market growth.
Likewise, India and the Philippines are anticipated to emerge as the favorite destinations for setting up a call center. Companies including GE, Bharti Telecom, British Airways, and financial giants such as American Express, ICICI, and HDFC have deployed their call centers in India for better customer support. Thus, Call Center AI manufacturers are seizing this opportunity to pave the way in the regional market.
Based on deployment type, the demand for on-premise Call Center AI will soar across the end-use industry, expected to register a CAGR of 13.5% until 2035. This segment accounted for more than 55% share in 2024. On-premises deployment of AI solutions and services permits enterprises and corporations to customize and implement AI models.
It enables companies to practice effective safety and security practices regarding consumer data, thus cultivating the system's security and offering a more secure ecosystem to deal with consumer data. On-premises call center AI solutions are deployed more widely by small and medium enterprises due to the ease of deployment and control offered by on-premises systems, thereby offering favorable growth opportunities for the industry.
Artificial Intelligence in call center's advantage is resolving customer problems. Predictive and analytical AI software can bring faster solutions and results by scanning customer complaints from databases faster than standard systems. This can save a sizable amount of time on behalf of both the customer and the company. Owing to these, the demand for call center AI is likely to upsurge over the years to come.
Automating procedures such as customer follow-up are some of the ways AI may affect sales of call center ai operations.
Demand for call centers AI is projected to be more efficient, perform better and be more predictive. AI may have an influence on call center operations by anticipating inquiries based on the customer's previous behaviors, ensuring good communication to handle queries quickly regardless of time or location, and automating procedures such as customer follow-up.
The demand for call center AI applications is still in its infancy. The development of new AI solutions that can aid in optimization, automation, and prediction might be a major driver in sales of call center AI acceptance and penetration.
Other significant factors influencing the growing demand for call center AI applications include the increasing use of AI by organizations in pursuit of enhanced customer support service offerings, the increasing role of social media for customer engagement, and the exponential growth of data through the Internet of Things (IoT), social media, while factors such as a lack of skilled labour and unsupervised learning are expected to hinder the market growth.
Factors such as the increased need for improved customer experience and response time, as well as greater data analysis capabilities, are influencing the worldwide call center AI market.
The demand for call center AI growth is being hampered by expensive installation and training costs, as well as privacy and security concerns. Furthermore, the market is influenced by enterprises' increased focus on AI technology and the increased penetration of social media platforms.
Nonetheless, each of these variables is expected to have a significant influence on worldwide sales of call center AI throughout the forecast period. In certain cases, responding to client inquiries in real-time might be challenging for a customer service representative, as customers may not understand the context of their inquiry. This has necessitated the development of better data analytics skills.
For example, with AI, prior customer interactions and chat data may be examined in seconds, and concise information about the client can be supplied to the executive. Because of its large in-house data scientists and analysts, Amazon, in partnership with its subsidiary Amazon Web Services, developed specific algorithms aimed at evaluating customer wants and offering accurate responses based on those needs.
As a result, the global sales of call center AI are growing due to the requirement for increased data analysis skills.
Sales of call centers AI transformed social media into a vital component of modern businesses. Every firm has been increasing its social media presence in order to reach out to its customers more easily. With internet access and high social media penetration rates, a number of developing nations are seeing population increase and rapid growth in the sales of call centers AI.
As a result, firms must modernize how they reach out to customers and respond to their problems on social media platforms, as conventional customer service approaches are no longer applicable in the digital age. Demand for call center AI is increasing as customers are increasingly using social media channels to communicate with businesses and discuss their experiences.
As a result, the rising desire among contact centers to incorporate social media platforms such as Facebook and Twitter in order to meet the organization's aim of effective customer service programs is likely to give lucrative chances for sales of call center AI expansion over the projection period.
The call center ai market is divided into three categories: deployment mode, end-user industry, and region. The market is divided into two types of deployments: cloud and on-premise.
The market is divided into BFSI, retail & e-commerce, telecom, travel & hospitality, and others, according to the end-user industry. The scope of the study includes thorough information on the primary drivers and restraints driving the AI market in contact center applications.
The report also examines industry trends, such as enterprises' increased use of AI in the quest for better customer support service offerings and their implications for the market.
During the projection period, the solution segment by component is expected to develop at a strong CAGR of 13.1% by 2035 since services are critical to the operation of many AI-enabled products. These solutions guarantee a speedier and easier deployment, maximizing the return on investment for businesses.
These services ensure end-to-end computing platform deployment and answer pre-and post-deployment questions. To oversee the call center AI market, the majority of market providers provide technical support and consulting services.
| Region | CAGR |
|---|---|
| United States of America | 13.4% |
| United Kingdom | 12.6% |
| China | 13% |
| Japan | 12.5% |
| South Korea | 12.1% |
Owing to its quick technological advancements, North America is expected to have the greatest share of the call center AI market. In this area, the USA is the most advanced demand for call center AI technologies. Furthermore, the presence of multinational suppliers in the area, such as IBM, Google, Microsoft, and AWS, is critical for the application of conversational AI technology in contact centers.
The market vendors are expanding their solutions by the introduction of unique features, integration capabilities and enhancing the performance of the solutions to attract more and more customers. The companies are also focusing on making partnerships and collaborations to share the technical knowledge with other companies.
Recent Developments in the Call Center AI Market:
The global call center ai market is estimated to be valued at USD 2.5 billion in 2025.
The market size for the call center ai market is projected to reach USD 8.8 billion by 2035.
The call center ai market is expected to grow at a 13.5% CAGR between 2025 and 2035.
The key product types in call center ai market are solutions, compute platforms, services, training & consulting services, system integration & deployment services and support & maintenance services.
In terms of deployment type, cloud segment to command 63.1% share in the call center ai market in 2025.


Our Research Products

The "Full Research Suite" delivers actionable market intel, deep dives on markets or technologies, so clients act faster, cut risk, and unlock growth.

The Leaderboard benchmarks and ranks top vendors, classifying them as Established Leaders, Leading Challengers, or Disruptors & Challengers.

Locates where complements amplify value and substitutes erode it, forecasting net impact by horizon

We deliver granular, decision-grade intel: market sizing, 5-year forecasts, pricing, adoption, usage, revenue, and operational KPIs—plus competitor tracking, regulation, and value chains—across 60 countries broadly.

Spot the shifts before they hit your P&L. We track inflection points, adoption curves, pricing moves, and ecosystem plays to show where demand is heading, why it is changing, and what to do next across high-growth markets and disruptive tech

Real-time reads of user behavior. We track shifting priorities, perceptions of today’s and next-gen services, and provider experience, then pace how fast tech moves from trial to adoption, blending buyer, consumer, and channel inputs with social signals (#WhySwitch, #UX).

Partner with our analyst team to build a custom report designed around your business priorities. From analysing market trends to assessing competitors or crafting bespoke datasets, we tailor insights to your needs.
Supplier Intelligence
Discovery & Profiling
Capacity & Footprint
Performance & Risk
Compliance & Governance
Commercial Readiness
Who Supplies Whom
Scorecards & Shortlists
Playbooks & Docs
Category Intelligence
Definition & Scope
Demand & Use Cases
Cost Drivers
Market Structure
Supply Chain Map
Trade & Policy
Operating Norms
Deliverables
Buyer Intelligence
Account Basics
Spend & Scope
Procurement Model
Vendor Requirements
Terms & Policies
Entry Strategy
Pain Points & Triggers
Outputs
Pricing Analysis
Benchmarks
Trends
Should-Cost
Indexation
Landed Cost
Commercial Terms
Deliverables
Brand Analysis
Positioning & Value Prop
Share & Presence
Customer Evidence
Go-to-Market
Digital & Reputation
Compliance & Trust
KPIs & Gaps
Outputs
Full Research Suite comprises of:
Market outlook & trends analysis
Interviews & case studies
Strategic recommendations
Vendor profiles & capabilities analysis
5-year forecasts
8 regions and 60+ country-level data splits
Market segment data splits
12 months of continuous data updates
DELIVERED AS:
PDF EXCEL ONLINE
Call Centre Market Size and Share Forecast Outlook 2025 to 2035
Medically Supervised Weight Loss Services Market Size and Share Forecast Outlook 2025 to 2035
Robocall Mitigation Market Analysis - Size, Share, and Forecast 2025 to 2035
Acrocallosal Syndrome Therapeutics Market - Trends & Future Growth 2025 to 2035
Optically Clear Resin Market Growth – Trends & Forecast 2024-2034
Flash Calling Authentication Market Size and Share Forecast Outlook 2025 to 2035
Nurse Call Systems Market Insights - Size, Share & Forecast 2025 to 2035
Genetically Modified Food Market Analysis by Type, Trait, and Region through 2035
Electrically Conductive Adhesives Market Size and Share Forecast Outlook 2025 to 2035
Electrically-Driven Heavy-Duty Aerial Work Platforms Market Size and Share Forecast Outlook 2025 to 2035
Electrically Actuated Micro Robots Market Size and Share Forecast Outlook 2025 to 2035
Electrically Conductive Coating Market Size and Share Forecast Outlook 2025 to 2035
Enzymatically Interesterified Oils Market
Enzymatically Hydrolyzed Carboxymethyl Cellulose Market
Electronically Scanned Arrays System Market Size and Share Forecast Outlook 2025 to 2035
Corn and Callus Remover Market Insights-Size, trends and Forecast 2025-2035
Center-less Grinding Machines Market Size and Share Forecast Outlook 2025 to 2035
Center Sealed Pouch Packaging Market Size and Share Forecast Outlook 2025 to 2035
Center Seal Pouch Making Machine Market
Datacenter Infrastructure Services Market Size and Share Forecast Outlook 2025 to 2035

Thank you!
You will receive an email from our Business Development Manager. Please be sure to check your SPAM/JUNK folder too.
Chat With
MaRIA