Reports

- Global Locations -

Headquarters

Future Market Insights, Inc.

Christiana Corporate, 200
Continental Drive, Suite 401,
Newark, Delaware - 19713,
United States

T: +1-845-579-5705

Americas

Future Market Insights, Inc.

616 Corporate Way, Suite 2-9018,
Valley Cottage, NY 10989, United States

T: +1-347-918-3531

MEA

Future Market Insights

1602-6 Jumeirah Bay X2 Tower, Plot No: JLT-PH2-X2A,
Jumeirah Lakes Towers, Dubai,
United Arab Emirates

Europe

Future Market Insights

3rd Floor, 207 Regent Street,
W1B 3HH London
United Kingdom

T: + 44 (0) 20 8123 9659
D: +44 (0) 20 3287 4268

Asia Pacific

Future Market Insights

IndiaLand Global Tech Park, Unit UG-1, Behind Grand HighStreet, Phase 1, Hinjawadi, MH, Pune – 411057, India

Center-less Grinding Machines Market Outlook (2023 to 2033)

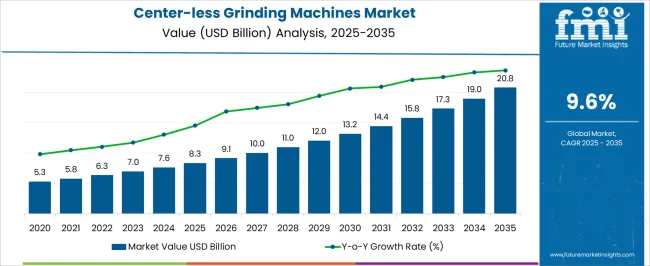
The global center-less grinding machines market is likely to reach a valuation of US$ 6.9 billion by 2023. It is estimated to surpass US$ 18 billion by 2033. The market is projected to witness steady growth at a CAGR of 10% from 2023 to 2033.

The center-less grinding machines industry is a rapidly developing segment within the manufacturing industry. Center-less grinding is a precision machining process that removes material from the workpiece without using a center or spindle. This unique grinding method has several advantages over traditional grinding techniques: better productivity, better accuracy, and better surface finish.

Center-less grinders are widely used in several sectors such as automotive, aerospace, medical, and general engineering. It is especially suitable for grinding cylindrical parts such as shafts, rods, and tubes where tight tolerances and smooth surfaces are important.

The market for center-less grinders has grown significantly in recent years due to several factors. First, technological advancements and rising consumer expectations have increased the demand for high-quality precision components. This has led manufacturers to adopt center-less grinders to achieve higher dimensional accuracy and surface finish, thereby improving overall product quality.

Secondly, the continued growth of the automotive industry and the need for efficient production processes contribute to the growth of the center-less grinders market. These machines enable automakers to meet tighter tolerances and reduce cycle times, thereby reducing costs and increasing productivity.

Furthermore, the increasing use of automation and robotics in manufacturing is also impacting the market for center-less grinders. Automation is enabling manufacturers to improve process control, reduce labor costs, and achieve consistent, repeatable grinding results. This is increasing demand for advanced center-less grinders with automation capabilities.

Manufacturers also recognize the importance of comprehensive after-sales service to their customers. This includes providing timely technical support, parts availability, training programs, and maintenance services to ensure optimum performance and longevity of center-less grinder machines.

In terms of geographic demand, the center-less grinder machine market in the Asia-Pacific region is experiencing significant growth, especially in countries such as China and Japan driven by the flourishing automotive and manufacturing industries.

North America and Europe are also important markets, driven by the presence of established industries and attention to technological advancements.

The market for center-less grinding machines is not without challenges. The high initial investment costs associated with these machines and the need for skilled operators can be barriers to entry for smaller manufacturers. Furthermore, the availability of alternative grinding techniques such as cylindrical grinding and internal grinding creates competitive pressure on the market.

Attributes Key Insights
Center Less Grinding Machines Market Estimated Size (2023E) US$ 6.9 billion
Projected Market Valuation (2033F) US$ 18 billion
Value-based CAGR (2023 to 2033) 10.0%
Value-based CAGR (2018 to 2022) 12.3%

Don't pay for what you don't need

Customize your report by selecting specific countries or regions and save 30%!

2018 to 2022 Center-less Grinding Machines Sales Outlook Compared to Demand Forecast from 2023 to 2033

Future Market Insights (FMI) mentions that the global center-less grinding machines market is anticipated to showcase a CAGR of 10% over the forecast period 2023 to 2033. In the historical period between 2018 and 2022, the market witnessed a decent CAGR of 12.3%.

The sales outlook for center-less grinding machines has been positive and is expected to continue growing in the coming years.

Sectors such as automotive, aerospace, and medical devices require precision components with tight tolerances and excellent surface finish. The center-less grinders industry offers an opportunity to meet these requirements, driving the demand for these grinders.

The manufacturing industry is increasingly adopting automation and Industry 4.0 technologies. Center-less grinders with automation features such as robotic loading and unloading systems, integrated measurement systems, and data connectivity are becoming more popular.

These advancements lead to increased productivity, better process control, augmented efficiency, and amplified center-less grinder sales.

Manufacturers are constantly looking for ways to optimize production processes and reduce costs. Compared to other grinding methods, center-less grinders have advantages such as shorter cycle times, shorter set-up times, and lower tool costs. For this reason, manufacturers are increasingly turning to center-less grinders to improve cost efficiency, resulting in increased sales.

Manufacturers are investing in research and development to introduce innovative features and technologies into their center-less grinders. These advances are aimed at improving the performance, accuracy, and ease of use of the machines, further increasing the sales of these machines through 2033.

Top Center-less Grinding Machines Market Trends Listed by Future Market Insights (FMI)

  • The automotive industry has been a key driver of the center-less grinder machine market due to wide application in creating engines, shafts, valves, and other precision parts.
  • Computer Numerical Control (CNC) technology is advancing rapidly and having a key impact on center-less grinders by offering greater accuracy, automation, better control, and efficiency, resulting in better overall performance.
  • The integration of Internet of Things (IoT) technology and Industry 4.0 concepts are aiding the market by allowing manufacturers to integrate sensors, data analytics, and connectivity into their machines to enable real-time monitoring, predictive maintenance, and optimization of the grinding process.
  • Energy efficiency has become a key factor in manufacturing processes and energy-efficient grinders are in high demand since they reduce power consumption during downtime, and implement energy-saving technologies.
  • Customers are demanding a higher level of precision and superior surface finish on their machined parts leading to grinders with advanced features such as enhanced wheel technology and improved control systems.
  • Manufacturers are integrating robotics and automation solutions to increase productivity, reduce labor costs, improve safety, and achieve consistent grinding results.
Nikhil Kaitwade
Nikhil Kaitwade

Principal Consultant

Talk to Analyst

Find your sweet spots for generating winning opportunities in this market.

Which Factors Are Responsible for Hindering Center Less Grinding Machines Demand Globally?

Demand may be hampered by technical limitations or lack of progress in center-less grinders machines. If manufacturers fail to innovate and develop machines that meet the changing demands of their customer’s may affect demand for these machines.

The availability of alternative technologies and machining methods may also affect the demand for center-less grinders. If alternative methods such as CNC milling and turning, electrochemical machining, and abrasive waterjet cutting can achieve similar results at a lower cost or with greater flexibility, demand for center-less grinders could decrease.

Skills shortage in manufacturing could be a barrier to demand for center-less grinders. Operation and maintenance of these machines require qualified operators with programming, set-up, and troubleshooting expertise. Companies may be reluctant to invest in complex machines such as center-less grinders if skilled workers are in short supply.

Increased environmental regulations and sustainability concerns may affect the demand for center-less grinders. If the grinding process is deemed unfriendly due to issues such as noise, dust, and energy consumption, it may lead to a shift to alternative processing methods or the introduction of more environmentally friendly grinding techniques.

Country-wise Insights

What Factors Lead to Significant Center Less Grinding Machines Demand in the United States?

Integration of Advanced Features in Center-less Grinders to Propel Market in the United States

The USA has strong manufacturing industries including automotive, aerospace, medical devices, and many other sectors. As the demand for precision components and parts continues to grow, manufacturers are looking for efficient and precise grinding processes. Center-less grinders are popular in the manufacturing sector due to their high precision, productivity, and versatility.

Center-less grinding machines have undergone significant technological advances in recent years. These advancements have improved machine capabilities such as increased accuracy, automation, and integration of intelligent functions. The availability of advanced center-less grinders with improved performance and operability increases demand in the market.

The country is estimated to be valued at US$ 3.3 billion by 2033 surging at a CAGR of 9.9%.

What is the Potential for China’s Performance in the Field of Center Less Grinding Machines?

Affordability and Accessibly in China to Spur Demand for Center-Less Grinding Machines

China has a well-developed manufacturing infrastructure and a strong industrial base. There are several machine tool manufacturers in the country that specialize in center-less grinding machines. China’s manufacturers have accumulated experience in producing low-cost machines that meet a wide range of customer needs.

China's manufacturing industry is traditionally known for being cost-competitive. China center-less grinder manufacturers offer competitive prices compared to competitors from other countries. This affordable pricing makes China's machines attractive to domestic and foreign buyers and contributes to China's performance in this market.

The industry in China is expected to be worth US$ 3.7 billion by 2033. China's center-less grinding machines market is projected to surge at a CAGR of 9.9% by 2033.

Why are More Companies in the United Kingdom Adopting Center Less Grinding Machines?

Increasing Productivity Due to Center-less Grinders to Flourish Sales in the United Kingdom

The United Kingdom has a strong presence in precision engineering and manufacturing sectors such as aerospace, automotive, and medical. These industries require a high level of precision in the manufacturing of components and parts.

Center-less grinders offer the ultimate in precision and control, allowing companies to achieve the tight tolerances and superior surface finish critical to maintaining quality standards in these sectors.

Center-less grinding machines are known for their efficiency and productivity. Large volumes can be processed with minimal downtime and operator intervention. By using center-less grinders, United Kingdom businesses can increase production rates, shorten lead times and improve overall operational efficiency.

As per the report, the United Kingdom's center-less grinding machines market is likely to witness a CAGR of around 9.7% from 2023 to 2033.

Get the data you need at a Fraction of the cost

Personalize your report by choosing insights you need
and save 40%!

Category-wise Insights

Which is the Highly Preferred Type of Machine in Center Less Grinding Machines?

Excellent Efficiency of Precision Center-less Grinding Machines to Propel Their Demand

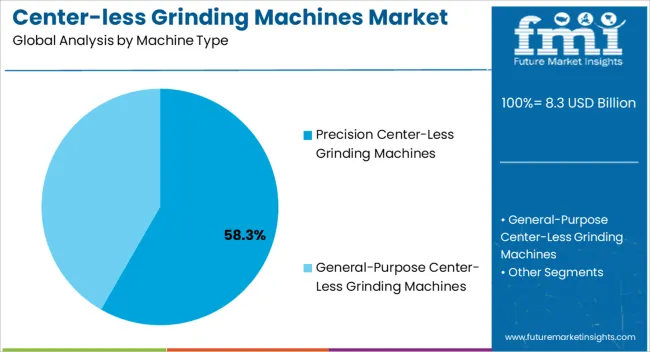
Based on machine type, the precision center-less grinding machines segment is likely to lead the global center-less grinding machines market through 2033. It is estimated to exhibit a CAGR of 9.8% in the assessment period, as compared to a 12.2% CAGR from 2018 to 2022.

Precision center-less grinding machines allow a continuous grinding process. Here the workpiece is fed into the machine from one side and passes continuously through the grinding zone. This enables high production rates and reduces downtime when loading and unloading work pieces.

The precision center-less grinder can process a large number of workpieces in a short time, resulting in high efficiency and productivity. The continuous feeding mechanism eliminates the need for frequent setup changes, reduces idle time, and increases productivity.

Precision center-less grinders are relatively simple in design and operation, and are easier to set up and operate than other types of grinders. The easy setup process and minimal customization required to make it attractive to manufacturers looking for simplicity and ease of use.

Which is the Top Application of Center Less Grinding Machines?

Automotive Segment is the Leading Application Followed by Aerospace Sector

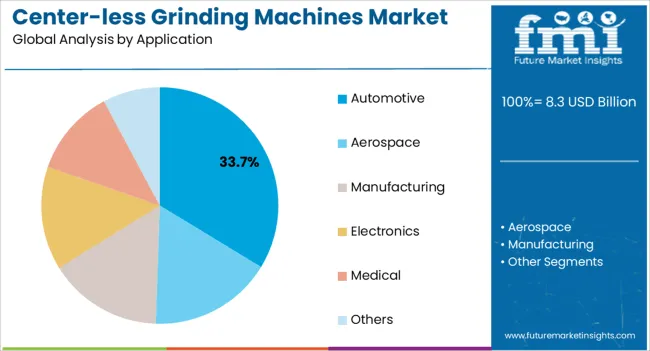
In terms of application, the automotive category is projected to showcase a CAGR of 9.7% from 2023 to 2033. It exhibited a decent CAGR of about 12.0% during the historical period.

Center-less grinders are widely used in the automotive industry for a variety of applications. They are used for grinding precision parts such as crankshafts, camshafts, injector parts, transmission parts, and valve stems. The automotive sector demands high levels of precision and surface finish, and center-less grinding machines can efficiently deliver the required results.

Aerospace segment is also paving its way toward leading figures in the market. The aerospace industry requires precision components with strict adherence to quality standards. Center-less grinders are used to grind turbine blades, engine parts, landing gear parts, and other critical aerospace parts.

Center-less grinders are ideal for aerospace applications as they can achieve tight tolerances and excellent surface finish.
Competitive Landscape

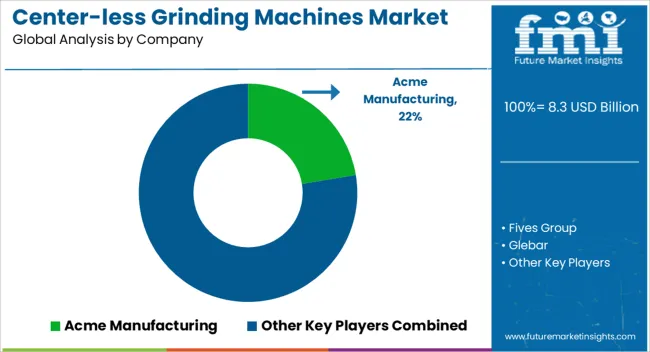
Leading players in the global center-less grinding machines market invest in research and development to create new and improved products. Their goal is to bring new machines to the market with higher selectivity, lower energy consumption, and improved durability.

They are also working on membranes that can operate at higher temperatures and pressures. These features ultimately help improve efficiency and increase applicability to a wide range of industrial processes.

Other companies have strategic partnerships and collaborations with local businesses and research institutes to share knowledge, expertise, and resources. This allows manufacturers to develop innovative technologies faster and expand their product offerings.

For instance:

  • On June 2022, Agile MV, a Montreal, Quebec-based up-and-coming leader in product development and turnkey device assembly, was purchased by Resonetics. With this acquisition, Resonetics will rename its current design and development services division AGILE Product Development.
  • On February 2019, Caribou Technologies, a Minnesota-based leader in center-less grinding, forming, winding, machining, and laser processing for the medical device sector, was acquired by Resonetics. In addition to working with several medical device manufacturers in the Minneapolis market, Caribou has established a solid and expanding clientele in international markets with rapid market expansion.

Scope of the Report

Attribute Details
Estimated Market Size (2023) US$ 6.9 billion
Projected Market Valuation (2033) US$ 18 billion
Value-based CAGR (2023 to 2033) 10.0%
Forecast Period 2023 to 2033
Historical Data Available for 2018 to 2022
Market Analysis Value (US$ billion)
Key Regions Covered Latin America, North America, Europe, South Asia, East Asia, Oceania, and the Middle East & Africa
Key Market Segments Covered Machine Type, Application
Key Companies Profiled
  • Acme Manufacturing
  • Fives Group
  • Glebar
  • Hanwha Machinery
  • Jainnher Machine
Pricing Market Forecast, Company Share Analysis, Competition Intelligence, Market Dynamics and Challenges, and Strategic Growth Initiatives

Center-less Grinding Machines Market Outlook by Category

By Machine Type:

  • Precision Center-less Grinding Machines
  • General-purpose Center-less Grinding Machines

By Application:

  • Automotive
  • Aerospace
  • Manufacturing
  • Electronics
  • Medical
  • Others

Frequently Asked Questions

What will be the Yearly Growth Rate in Sales of Center-less Grinding Machines?

The y-o-y sales of center-less grinding machines to surge at 6.9% CAGR through 2033.

What will be the Total Uptake of the Global Market by 2033?

The total sales achieved by the global market could reach US$ 18 billion by 2033.

What is the Market Projection for the Center-less Grinding Machine in the United States?

Center-less grinding machines in the United States to witness 9.9% y-o-y growth rate until 2033.

Which Country is Driving the Center-less Grinding Machine Market in Asia Pacific?

China is forecasted to reach a valuation of US$ 3.7 billion by 2033.

What will be the Growth Rate of the United Kingdom Center-less Grinding Machine Market?

Center-less grinding machines in the United Kingdom to grow at 9.7% until 2033.

Table of Content

1. Executive Summary

    1.1. Global Market Outlook

    1.2. Demand-side Trends

    1.3. Supply-side Trends

    1.4. Technology Roadmap Analysis

    1.5. Analysis and Recommendations

2. Market Overview

    2.1. Market Coverage / Taxonomy

    2.2. Market Definition / Scope / Limitations

3. Market Background

    3.1. Market Dynamics

        3.1.1. Drivers

        3.1.2. Restraints

        3.1.3. Opportunity

        3.1.4. Trends

    3.2. Scenario Forecast

        3.2.1. Demand in Optimistic Scenario

        3.2.2. Demand in Likely Scenario

        3.2.3. Demand in Conservative Scenario

    3.3. Opportunity Map Analysis

    3.4. Product Life Cycle Analysis

    3.5. Supply Chain Analysis

        3.5.1. Supply Side Participants and their Roles

            3.5.1.1. Producers

            3.5.1.2. Mid-Level Participants (Traders/ Agents/ Brokers)

            3.5.1.3. Wholesalers and Distributors

        3.5.2. Value Added and Value Created at Node in the Supply Chain

        3.5.3. List of Raw Material Suppliers

        3.5.4. List of Existing and Potential Buyer’s

    3.6. Investment Feasibility Matrix

    3.7. Value Chain Analysis

        3.7.1. Profit Margin Analysis

        3.7.2. Wholesalers and Distributors

        3.7.3. Retailers

    3.8. PESTLE and Porter’s Analysis

    3.9. Regulatory Landscape

        3.9.1. By Key Regions

        3.9.2. By Key Countries

    3.10. Regional Parent Market Outlook

    3.11. Production and Consumption Statistics

    3.12. Import and Export Statistics

4. Global Market Analysis 2018 to 2022 and Forecast, 2023 to 2033

    4.1. Historical Market Size Value (US$ Billion) & Volume (Units) Analysis, 2018 to 2022

    4.2. Current and Future Market Size Value (US$ Billion) & Volume (Units) Projections, 2023 to 2033

        4.2.1. Y-o-Y Growth Trend Analysis

        4.2.2. Absolute $ Opportunity Analysis

5. Global Market Analysis 2018 to 2022 and Forecast 2023 to 2033, By Machine Type

    5.1. Introduction / Key Findings

    5.2. Historical Market Size Value (US$ Billion) & Volume (Units) Analysis By Machine Type, 2018 to 2022

    5.3. Current and Future Market Size Value (US$ Billion) & Volume (Units) Analysis and Forecast By Machine Type, 2023 to 2033

        5.3.1. Precision Center-less Grinding Machines

        5.3.2. General-purpose Center-less Grinding Machines

    5.4. Y-o-Y Growth Trend Analysis By Machine Type, 2018 to 2022

    5.5. Absolute $ Opportunity Analysis By Machine Type, 2023 to 2033

6. Global Market Analysis 2018 to 2022 and Forecast 2023 to 2033, By Application

    6.1. Introduction / Key Findings

    6.2. Historical Market Size Value (US$ Billion) & Volume (Units) Analysis By Application, 2018 to 2022

    6.3. Current and Future Market Size Value (US$ Billion) & Volume (Units) Analysis and Forecast By Application, 2023 to 2033

        6.3.1. Automotive

        6.3.2. Aerospace

        6.3.3. Manufacturing

        6.3.4. Electronics

        6.3.5. Medical

        6.3.6. Others

    6.4. Y-o-Y Growth Trend Analysis By Application, 2018 to 2022

    6.5. Absolute $ Opportunity Analysis By Application, 2023 to 2033

7. Global Market Analysis 2018 to 2022 and Forecast 2023 to 2033, By Region

    7.1. Introduction

    7.2. Historical Market Size Value (US$ Billion) & Volume (Units) Analysis By Region, 2018 to 2022

    7.3. Current Market Size Value (US$ Billion) & Volume (Units) Analysis and Forecast By Region, 2023 to 2033

        7.3.1. North America

        7.3.2. Latin America

        7.3.3. Europe

        7.3.4. Asia Pacific

        7.3.5. Middle East and Africa

    7.4. Market Attractiveness Analysis By Region

8. North America Market Analysis 2018 to 2022 and Forecast 2023 to 2033, By Country

    8.1. Historical Market Size Value (US$ Billion) & Volume (Units) Trend Analysis By Market Taxonomy, 2018 to 2022

    8.2. Market Size Value (US$ Billion) & Volume (Units) Forecast By Market Taxonomy, 2023 to 2033

        8.2.1. By Country

            8.2.1.1. United States

            8.2.1.2. Canada

        8.2.2. By Machine Type

        8.2.3. By Application

    8.3. Market Attractiveness Analysis

        8.3.1. By Country

        8.3.2. By Machine Type

        8.3.3. By Application

    8.4. Key Takeaways

9. Latin America Market Analysis 2018 to 2022 and Forecast 2023 to 2033, By Country

    9.1. Historical Market Size Value (US$ Billion) & Volume (Units) Trend Analysis By Market Taxonomy, 2018 to 2022

    9.2. Market Size Value (US$ Billion) & Volume (Units) Forecast By Market Taxonomy, 2023 to 2033

        9.2.1. By Country

            9.2.1.1. Brazil

            9.2.1.2. Mexico

            9.2.1.3. Rest of Latin America

        9.2.2. By Machine Type

        9.2.3. By Application

    9.3. Market Attractiveness Analysis

        9.3.1. By Country

        9.3.2. By Machine Type

        9.3.3. By Application

    9.4. Key Takeaways

10. Europe Market Analysis 2018 to 2022 and Forecast 2023 to 2033, By Country

    10.1. Historical Market Size Value (US$ Billion) & Volume (Units) Trend Analysis By Market Taxonomy, 2018 to 2022

    10.2. Market Size Value (US$ Billion) & Volume (Units) Forecast By Market Taxonomy, 2023 to 2033

        10.2.1. By Country

            10.2.1.1. Germany

            10.2.1.2. United Kingdom

            10.2.1.3. France

            10.2.1.4. Spain

            10.2.1.5. Italy

            10.2.1.6. Rest of Europe

        10.2.2. By Machine Type

        10.2.3. By Application

    10.3. Market Attractiveness Analysis

        10.3.1. By Country

        10.3.2. By Machine Type

        10.3.3. By Application

    10.4. Key Takeaways

11. Asia Pacific Market Analysis 2018 to 2022 and Forecast 2023 to 2033, By Country

    11.1. Historical Market Size Value (US$ Billion) & Volume (Units) Trend Analysis By Market Taxonomy, 2018 to 2022

    11.2. Market Size Value (US$ Billion) & Volume (Units) Forecast By Market Taxonomy, 2023 to 2033

        11.2.1. By Country

            11.2.1.1. China

            11.2.1.2. Japan

            11.2.1.3. South Korea

            11.2.1.4. Singapore

            11.2.1.5. Thailand

            11.2.1.6. Indonesia

            11.2.1.7. Australia

            11.2.1.8. New Zealand

            11.2.1.9. Rest of Asia Pacific

        11.2.2. By Machine Type

        11.2.3. By Application

    11.3. Market Attractiveness Analysis

        11.3.1. By Country

        11.3.2. By Machine Type

        11.3.3. By Application

    11.4. Key Takeaways

12. Middle East and Africa Market Analysis 2018 to 2022 and Forecast 2023 to 2033, By Country

    12.1. Historical Market Size Value (US$ Billion) & Volume (Units) Trend Analysis By Market Taxonomy, 2018 to 2022

    12.2. Market Size Value (US$ Billion) & Volume (Units) Forecast By Market Taxonomy, 2023 to 2033

        12.2.1. By Country

            12.2.1.1. GCC Countries

            12.2.1.2. South Africa

            12.2.1.3. Israel

            12.2.1.4. Rest of Middle East and Africa

        12.2.2. By Machine Type

        12.2.3. By Application

    12.3. Market Attractiveness Analysis

        12.3.1. By Country

        12.3.2. By Machine Type

        12.3.3. By Application

    12.4. Key Takeaways

13. Key Countries Market Analysis

    13.1. United States

        13.1.1. Pricing Analysis

        13.1.2. Market Share Analysis, 2022

            13.1.2.1. By Machine Type

            13.1.2.2. By Application

    13.2. Canada

        13.2.1. Pricing Analysis

        13.2.2. Market Share Analysis, 2022

            13.2.2.1. By Machine Type

            13.2.2.2. By Application

    13.3. Brazil

        13.3.1. Pricing Analysis

        13.3.2. Market Share Analysis, 2022

            13.3.2.1. By Machine Type

            13.3.2.2. By Application

    13.4. Mexico

        13.4.1. Pricing Analysis

        13.4.2. Market Share Analysis, 2022

            13.4.2.1. By Machine Type

            13.4.2.2. By Application

    13.5. Germany

        13.5.1. Pricing Analysis

        13.5.2. Market Share Analysis, 2022

            13.5.2.1. By Machine Type

            13.5.2.2. By Application

    13.6. United Kingdom

        13.6.1. Pricing Analysis

        13.6.2. Market Share Analysis, 2022

            13.6.2.1. By Machine Type

            13.6.2.2. By Application

    13.7. France

        13.7.1. Pricing Analysis

        13.7.2. Market Share Analysis, 2022

            13.7.2.1. By Machine Type

            13.7.2.2. By Application

    13.8. Spain

        13.8.1. Pricing Analysis

        13.8.2. Market Share Analysis, 2022

            13.8.2.1. By Machine Type

            13.8.2.2. By Application

    13.9. Italy

        13.9.1. Pricing Analysis

        13.9.2. Market Share Analysis, 2022

            13.9.2.1. By Machine Type

            13.9.2.2. By Application

    13.10. China

        13.10.1. Pricing Analysis

        13.10.2. Market Share Analysis, 2022

            13.10.2.1. By Machine Type

            13.10.2.2. By Application

    13.11. Japan

        13.11.1. Pricing Analysis

        13.11.2. Market Share Analysis, 2022

            13.11.2.1. By Machine Type

            13.11.2.2. By Application

    13.12. South Korea

        13.12.1. Pricing Analysis

        13.12.2. Market Share Analysis, 2022

            13.12.2.1. By Machine Type

            13.12.2.2. By Application

    13.13. Singapore

        13.13.1. Pricing Analysis

        13.13.2. Market Share Analysis, 2022

            13.13.2.1. By Machine Type

            13.13.2.2. By Application

    13.14. Thailand

        13.14.1. Pricing Analysis

        13.14.2. Market Share Analysis, 2022

            13.14.2.1. By Machine Type

            13.14.2.2. By Application

    13.15. Indonesia

        13.15.1. Pricing Analysis

        13.15.2. Market Share Analysis, 2022

            13.15.2.1. By Machine Type

            13.15.2.2. By Application

    13.16. Australia

        13.16.1. Pricing Analysis

        13.16.2. Market Share Analysis, 2022

            13.16.2.1. By Machine Type

            13.16.2.2. By Application

    13.17. New Zealand

        13.17.1. Pricing Analysis

        13.17.2. Market Share Analysis, 2022

            13.17.2.1. By Machine Type

            13.17.2.2. By Application

    13.18. GCC Countries

        13.18.1. Pricing Analysis

        13.18.2. Market Share Analysis, 2022

            13.18.2.1. By Machine Type

            13.18.2.2. By Application

    13.19. South Africa

        13.19.1. Pricing Analysis

        13.19.2. Market Share Analysis, 2022

            13.19.2.1. By Machine Type

            13.19.2.2. By Application

    13.20. Israel

        13.20.1. Pricing Analysis

        13.20.2. Market Share Analysis, 2022

            13.20.2.1. By Machine Type

            13.20.2.2. By Application

14. Market Structure Analysis

    14.1. Competition Dashboard

    14.2. Competition Benchmarking

    14.3. Market Share Analysis of Top Players

        14.3.1. By Regional

        14.3.2. By Machine Type

        14.3.3. By Application

15. Competition Analysis

    15.1. Competition Deep Dive

        15.1.1. Acme Manufacturing

            15.1.1.1. Overview

            15.1.1.2. Product Portfolio

            15.1.1.3. Profitability by Market Segments

            15.1.1.4. Sales Footprint

            15.1.1.5. Strategy Overview

                15.1.1.5.1. Marketing Strategy

                15.1.1.5.2. Product Strategy

                15.1.1.5.3. Channel Strategy

        15.1.2. Fives Group

            15.1.2.1. Overview

            15.1.2.2. Product Portfolio

            15.1.2.3. Profitability by Market Segments

            15.1.2.4. Sales Footprint

            15.1.2.5. Strategy Overview

                15.1.2.5.1. Marketing Strategy

                15.1.2.5.2. Product Strategy

                15.1.2.5.3. Channel Strategy

        15.1.3. Glebar

            15.1.3.1. Overview

            15.1.3.2. Product Portfolio

            15.1.3.3. Profitability by Market Segments

            15.1.3.4. Sales Footprint

            15.1.3.5. Strategy Overview

                15.1.3.5.1. Marketing Strategy

                15.1.3.5.2. Product Strategy

                15.1.3.5.3. Channel Strategy

        15.1.4. Hanwha Machinery

            15.1.4.1. Overview

            15.1.4.2. Product Portfolio

            15.1.4.3. Profitability by Market Segments

            15.1.4.4. Sales Footprint

            15.1.4.5. Strategy Overview

                15.1.4.5.1. Marketing Strategy

                15.1.4.5.2. Product Strategy

                15.1.4.5.3. Channel Strategy

        15.1.5. Jainnher Machine

            15.1.5.1. Overview

            15.1.5.2. Product Portfolio

            15.1.5.3. Profitability by Market Segments

            15.1.5.4. Sales Footprint

            15.1.5.5. Strategy Overview

                15.1.5.5.1. Marketing Strategy

                15.1.5.5.2. Product Strategy

                15.1.5.5.3. Channel Strategy

        15.1.6. Junker

            15.1.6.1. Overview

            15.1.6.2. Product Portfolio

            15.1.6.3. Profitability by Market Segments

            15.1.6.4. Sales Footprint

            15.1.6.5. Strategy Overview

                15.1.6.5.1. Marketing Strategy

                15.1.6.5.2. Product Strategy

                15.1.6.5.3. Channel Strategy

        15.1.7. Kmt Precision Grinding

            15.1.7.1. Overview

            15.1.7.2. Product Portfolio

            15.1.7.3. Profitability by Market Segments

            15.1.7.4. Sales Footprint

            15.1.7.5. Strategy Overview

                15.1.7.5.1. Marketing Strategy

                15.1.7.5.2. Product Strategy

                15.1.7.5.3. Channel Strategy

        15.1.8. Micron Machinery

            15.1.8.1. Overview

            15.1.8.2. Product Portfolio

            15.1.8.3. Profitability by Market Segments

            15.1.8.4. Sales Footprint

            15.1.8.5. Strategy Overview

                15.1.8.5.1. Marketing Strategy

                15.1.8.5.2. Product Strategy

                15.1.8.5.3. Channel Strategy

        15.1.9. Paragon Machinery

            15.1.9.1. Overview

            15.1.9.2. Product Portfolio

            15.1.9.3. Profitability by Market Segments

            15.1.9.4. Sales Footprint

            15.1.9.5. Strategy Overview

                15.1.9.5.1. Marketing Strategy

                15.1.9.5.2. Product Strategy

                15.1.9.5.3. Channel Strategy

        15.1.10. Royal Master

            15.1.10.1. Overview

            15.1.10.2. Product Portfolio

            15.1.10.3. Profitability by Market Segments

            15.1.10.4. Sales Footprint

            15.1.10.5. Strategy Overview

                15.1.10.5.1. Marketing Strategy

                15.1.10.5.2. Product Strategy

                15.1.10.5.3. Channel Strategy

16. Assumptions & Acronyms Used

17. Research Methodology

List of Tables

Table 1: Global Market Value (US$ Billion) Forecast by Region, 2018 to 2033

Table 2: Global Market Volume (Units) Forecast by Region, 2018 to 2033

Table 3: Global Market Value (US$ Billion) Forecast by Machine Type, 2018 to 2033

Table 4: Global Market Volume (Units) Forecast by Machine Type, 2018 to 2033

Table 5: Global Market Value (US$ Billion) Forecast by Application, 2018 to 2033

Table 6: Global Market Volume (Units) Forecast by Application, 2018 to 2033

Table 7: North America Market Value (US$ Billion) Forecast by Country, 2018 to 2033

Table 8: North America Market Volume (Units) Forecast by Country, 2018 to 2033

Table 9: North America Market Value (US$ Billion) Forecast by Machine Type, 2018 to 2033

Table 10: North America Market Volume (Units) Forecast by Machine Type, 2018 to 2033

Table 11: North America Market Value (US$ Billion) Forecast by Application, 2018 to 2033

Table 12: North America Market Volume (Units) Forecast by Application, 2018 to 2033

Table 13: Latin America Market Value (US$ Billion) Forecast by Country, 2018 to 2033

Table 14: Latin America Market Volume (Units) Forecast by Country, 2018 to 2033

Table 15: Latin America Market Value (US$ Billion) Forecast by Machine Type, 2018 to 2033

Table 16: Latin America Market Volume (Units) Forecast by Machine Type, 2018 to 2033

Table 17: Latin America Market Value (US$ Billion) Forecast by Application, 2018 to 2033

Table 18: Latin America Market Volume (Units) Forecast by Application, 2018 to 2033

Table 19: Europe Market Value (US$ Billion) Forecast by Country, 2018 to 2033

Table 20: Europe Market Volume (Units) Forecast by Country, 2018 to 2033

Table 21: Europe Market Value (US$ Billion) Forecast by Machine Type, 2018 to 2033

Table 22: Europe Market Volume (Units) Forecast by Machine Type, 2018 to 2033

Table 23: Europe Market Value (US$ Billion) Forecast by Application, 2018 to 2033

Table 24: Europe Market Volume (Units) Forecast by Application, 2018 to 2033

Table 25: Asia Pacific Market Value (US$ Billion) Forecast by Country, 2018 to 2033

Table 26: Asia Pacific Market Volume (Units) Forecast by Country, 2018 to 2033

Table 27: Asia Pacific Market Value (US$ Billion) Forecast by Machine Type, 2018 to 2033

Table 28: Asia Pacific Market Volume (Units) Forecast by Machine Type, 2018 to 2033

Table 29: Asia Pacific Market Value (US$ Billion) Forecast by Application, 2018 to 2033

Table 30: Asia Pacific Market Volume (Units) Forecast by Application, 2018 to 2033

Table 31: Middle East and Africa Market Value (US$ Billion) Forecast by Country, 2018 to 2033

Table 32: Middle East and Africa Market Volume (Units) Forecast by Country, 2018 to 2033

Table 33: Middle East and Africa Market Value (US$ Billion) Forecast by Machine Type, 2018 to 2033

Table 34: Middle East and Africa Market Volume (Units) Forecast by Machine Type, 2018 to 2033

Table 35: Middle East and Africa Market Value (US$ Billion) Forecast by Application, 2018 to 2033

Table 36: Middle East and Africa Market Volume (Units) Forecast by Application, 2018 to 2033

List of Charts

Figure 1: Global Market Value (US$ Billion) by Machine Type, 2023 to 2033

Figure 2: Global Market Value (US$ Billion) by Application, 2023 to 2033

Figure 3: Global Market Value (US$ Billion) by Region, 2023 to 2033

Figure 4: Global Market Value (US$ Billion) Analysis by Region, 2018 to 2033

Figure 5: Global Market Volume (Units) Analysis by Region, 2018 to 2033

Figure 6: Global Market Value Share (%) and BPS Analysis by Region, 2023 to 2033

Figure 7: Global Market Y-o-Y Growth (%) Projections by Region, 2023 to 2033

Figure 8: Global Market Value (US$ Billion) Analysis by Machine Type, 2018 to 2033

Figure 9: Global Market Volume (Units) Analysis by Machine Type, 2018 to 2033

Figure 10: Global Market Value Share (%) and BPS Analysis by Machine Type, 2023 to 2033

Figure 11: Global Market Y-o-Y Growth (%) Projections by Machine Type, 2023 to 2033

Figure 12: Global Market Value (US$ Billion) Analysis by Application, 2018 to 2033

Figure 13: Global Market Volume (Units) Analysis by Application, 2018 to 2033

Figure 14: Global Market Value Share (%) and BPS Analysis by Application, 2023 to 2033

Figure 15: Global Market Y-o-Y Growth (%) Projections by Application, 2023 to 2033

Figure 16: Global Market Attractiveness by Machine Type, 2023 to 2033

Figure 17: Global Market Attractiveness by Application, 2023 to 2033

Figure 18: Global Market Attractiveness by Region, 2023 to 2033

Figure 19: North America Market Value (US$ Billion) by Machine Type, 2023 to 2033

Figure 20: North America Market Value (US$ Billion) by Application, 2023 to 2033

Figure 21: North America Market Value (US$ Billion) by Country, 2023 to 2033

Figure 22: North America Market Value (US$ Billion) Analysis by Country, 2018 to 2033

Figure 23: North America Market Volume (Units) Analysis by Country, 2018 to 2033

Figure 24: North America Market Value Share (%) and BPS Analysis by Country, 2023 to 2033

Figure 25: North America Market Y-o-Y Growth (%) Projections by Country, 2023 to 2033

Figure 26: North America Market Value (US$ Billion) Analysis by Machine Type, 2018 to 2033

Figure 27: North America Market Volume (Units) Analysis by Machine Type, 2018 to 2033

Figure 28: North America Market Value Share (%) and BPS Analysis by Machine Type, 2023 to 2033

Figure 29: North America Market Y-o-Y Growth (%) Projections by Machine Type, 2023 to 2033

Figure 30: North America Market Value (US$ Billion) Analysis by Application, 2018 to 2033

Figure 31: North America Market Volume (Units) Analysis by Application, 2018 to 2033

Figure 32: North America Market Value Share (%) and BPS Analysis by Application, 2023 to 2033

Figure 33: North America Market Y-o-Y Growth (%) Projections by Application, 2023 to 2033

Figure 34: North America Market Attractiveness by Machine Type, 2023 to 2033

Figure 35: North America Market Attractiveness by Application, 2023 to 2033

Figure 36: North America Market Attractiveness by Country, 2023 to 2033

Figure 37: Latin America Market Value (US$ Billion) by Machine Type, 2023 to 2033

Figure 38: Latin America Market Value (US$ Billion) by Application, 2023 to 2033

Figure 39: Latin America Market Value (US$ Billion) by Country, 2023 to 2033

Figure 40: Latin America Market Value (US$ Billion) Analysis by Country, 2018 to 2033

Figure 41: Latin America Market Volume (Units) Analysis by Country, 2018 to 2033

Figure 42: Latin America Market Value Share (%) and BPS Analysis by Country, 2023 to 2033

Figure 43: Latin America Market Y-o-Y Growth (%) Projections by Country, 2023 to 2033

Figure 44: Latin America Market Value (US$ Billion) Analysis by Machine Type, 2018 to 2033

Figure 45: Latin America Market Volume (Units) Analysis by Machine Type, 2018 to 2033

Figure 46: Latin America Market Value Share (%) and BPS Analysis by Machine Type, 2023 to 2033

Figure 47: Latin America Market Y-o-Y Growth (%) Projections by Machine Type, 2023 to 2033

Figure 48: Latin America Market Value (US$ Billion) Analysis by Application, 2018 to 2033

Figure 49: Latin America Market Volume (Units) Analysis by Application, 2018 to 2033

Figure 50: Latin America Market Value Share (%) and BPS Analysis by Application, 2023 to 2033

Figure 51: Latin America Market Y-o-Y Growth (%) Projections by Application, 2023 to 2033

Figure 52: Latin America Market Attractiveness by Machine Type, 2023 to 2033

Figure 53: Latin America Market Attractiveness by Application, 2023 to 2033

Figure 54: Latin America Market Attractiveness by Country, 2023 to 2033

Figure 55: Europe Market Value (US$ Billion) by Machine Type, 2023 to 2033

Figure 56: Europe Market Value (US$ Billion) by Application, 2023 to 2033

Figure 57: Europe Market Value (US$ Billion) by Country, 2023 to 2033

Figure 58: Europe Market Value (US$ Billion) Analysis by Country, 2018 to 2033

Figure 59: Europe Market Volume (Units) Analysis by Country, 2018 to 2033

Figure 60: Europe Market Value Share (%) and BPS Analysis by Country, 2023 to 2033

Figure 61: Europe Market Y-o-Y Growth (%) Projections by Country, 2023 to 2033

Figure 62: Europe Market Value (US$ Billion) Analysis by Machine Type, 2018 to 2033

Figure 63: Europe Market Volume (Units) Analysis by Machine Type, 2018 to 2033

Figure 64: Europe Market Value Share (%) and BPS Analysis by Machine Type, 2023 to 2033

Figure 65: Europe Market Y-o-Y Growth (%) Projections by Machine Type, 2023 to 2033

Figure 66: Europe Market Value (US$ Billion) Analysis by Application, 2018 to 2033

Figure 67: Europe Market Volume (Units) Analysis by Application, 2018 to 2033

Figure 68: Europe Market Value Share (%) and BPS Analysis by Application, 2023 to 2033

Figure 69: Europe Market Y-o-Y Growth (%) Projections by Application, 2023 to 2033

Figure 70: Europe Market Attractiveness by Machine Type, 2023 to 2033

Figure 71: Europe Market Attractiveness by Application, 2023 to 2033

Figure 72: Europe Market Attractiveness by Country, 2023 to 2033

Figure 73: Asia Pacific Market Value (US$ Billion) by Machine Type, 2023 to 2033

Figure 74: Asia Pacific Market Value (US$ Billion) by Application, 2023 to 2033

Figure 75: Asia Pacific Market Value (US$ Billion) by Country, 2023 to 2033

Figure 76: Asia Pacific Market Value (US$ Billion) Analysis by Country, 2018 to 2033

Figure 77: Asia Pacific Market Volume (Units) Analysis by Country, 2018 to 2033

Figure 78: Asia Pacific Market Value Share (%) and BPS Analysis by Country, 2023 to 2033

Figure 79: Asia Pacific Market Y-o-Y Growth (%) Projections by Country, 2023 to 2033

Figure 80: Asia Pacific Market Value (US$ Billion) Analysis by Machine Type, 2018 to 2033

Figure 81: Asia Pacific Market Volume (Units) Analysis by Machine Type, 2018 to 2033

Figure 82: Asia Pacific Market Value Share (%) and BPS Analysis by Machine Type, 2023 to 2033

Figure 83: Asia Pacific Market Y-o-Y Growth (%) Projections by Machine Type, 2023 to 2033

Figure 84: Asia Pacific Market Value (US$ Billion) Analysis by Application, 2018 to 2033

Figure 85: Asia Pacific Market Volume (Units) Analysis by Application, 2018 to 2033

Figure 86: Asia Pacific Market Value Share (%) and BPS Analysis by Application, 2023 to 2033

Figure 87: Asia Pacific Market Y-o-Y Growth (%) Projections by Application, 2023 to 2033

Figure 88: Asia Pacific Market Attractiveness by Machine Type, 2023 to 2033

Figure 89: Asia Pacific Market Attractiveness by Application, 2023 to 2033

Figure 90: Asia Pacific Market Attractiveness by Country, 2023 to 2033

Figure 91: Middle East and Africa Market Value (US$ Billion) by Machine Type, 2023 to 2033

Figure 92: Middle East and Africa Market Value (US$ Billion) by Application, 2023 to 2033

Figure 93: Middle East and Africa Market Value (US$ Billion) by Country, 2023 to 2033

Figure 94: Middle East and Africa Market Value (US$ Billion) Analysis by Country, 2018 to 2033

Figure 95: Middle East and Africa Market Volume (Units) Analysis by Country, 2018 to 2033

Figure 96: Middle East and Africa Market Value Share (%) and BPS Analysis by Country, 2023 to 2033

Figure 97: Middle East and Africa Market Y-o-Y Growth (%) Projections by Country, 2023 to 2033

Figure 98: Middle East and Africa Market Value (US$ Billion) Analysis by Machine Type, 2018 to 2033

Figure 99: Middle East and Africa Market Volume (Units) Analysis by Machine Type, 2018 to 2033

Figure 100: Middle East and Africa Market Value Share (%) and BPS Analysis by Machine Type, 2023 to 2033

Figure 101: Middle East and Africa Market Y-o-Y Growth (%) Projections by Machine Type, 2023 to 2033

Figure 102: Middle East and Africa Market Value (US$ Billion) Analysis by Application, 2018 to 2033

Figure 103: Middle East and Africa Market Volume (Units) Analysis by Application, 2018 to 2033

Figure 104: Middle East and Africa Market Value Share (%) and BPS Analysis by Application, 2023 to 2033

Figure 105: Middle East and Africa Market Y-o-Y Growth (%) Projections by Application, 2023 to 2033

Figure 106: Middle East and Africa Market Attractiveness by Machine Type, 2023 to 2033

Figure 107: Middle East and Africa Market Attractiveness by Application, 2023 to 2033

Figure 108: Middle East and Africa Market Attractiveness by Country, 2023 to 2033

Recommendations

Industrial Automation

Machine Tool Touch Probe Market

Published : October 2023

Industrial Automation

Machine Mount Market

Published : October 2023

Industrial Automation

Asia Pacific Industrial Pumps Market

Published : September 2022

Explore Industrial Automation Insights

View Reports

Center-less Grinding Machines Market