The capacitor bushing market is projected to grow at a CAGR of 5.0%, with an absolute dollar opportunity of USD 323.9 million. The capacitor bushing market is expected to increase from USD 515.1 million in 2025 to USD 839.0 million by 2035. This growth is primarily driven by rising demand for capacitor bushings across industrial applications, including energy, power distribution, and manufacturing. Capacitor bushings are crucial components in high-voltage electrical systems, providing a safe and efficient interface between electrical equipment and the environment. As the need for reliable power transmission and distribution systems grows, demand for capacitor bushings is expected to rise steadily in the coming years.
Capacitor bushings are essential components in electrical equipment, used to connect high-voltage conductors to grounded structures while preventing leakage and providing insulation. The capacitor bushing market is driven by increasing demand for reliable energy transmission and distribution systems across industries, particularly in power generation, substations, and electrical grids. The growing need for infrastructure upgrades, especially in aging electrical grids, is boosting demand for capacitor bushings. The transition to renewable energy sources and the modernization of energy networks are further propelling this growth. Capacitor bushings are also essential in industries that require high-performance electrical components, such as industrial manufacturing and the automotive sector.

Between 2025 and 2030, the market is expected to grow gradually, from USD 515.1 million to USD 626.1 million. This increase of USD 111.0 million will be driven by ongoing infrastructure upgrades, particularly the replacement of aging electrical grids and the emphasis on efficient energy distribution systems. Governments and private sector companies are investing heavily in improving energy infrastructure to meet the growing global demand for electricity. The transition toward renewable energy sources and green energy solutions will further fuel this demand, making capacitor bushings even more essential in modernizing electrical systems. The need for high-quality, reliable components in energy transmission and distribution networks is expected to contribute significantly to market growth during this period.
The second half of the forecast period, from 2030 to 2035, will see a more accelerated phase of growth, with the market reaching USD 839.0 million by 2035. This period will account for a significant portion of the overall market expansion, driven by the increasing industrialization, urbanization, and rising demand for advanced energy infrastructure. As economies continue to develop, especially in emerging regions, the need for efficient power transmission and distribution systems will push the demand for capacitor bushings. Technological advancements in capacitor bushing manufacturing, including improvements in materials and processing technologies, will also support the market’s growth. These advancements will help meet the growing demand for high-performance capacitor bushings that are crucial for modern power grids.
| Metric | Value |
|---|---|
| Market Value (2025) | USD 515.1 million |
| Market Forecast Value (2035) | USD 839.0 million |
| Forecast CAGR (2025–2035) | 5.0% |
The capacitor bushing market is experiencing steady growth due to increasing demand for reliable and durable components in electrical transmission and distribution networks. Capacitor bushings are critical components used in high-voltage equipment such as transformers and capacitors, ensuring electrical continuity while preventing leakage. With the global shift towards renewable energy sources and the expansion of electrical infrastructure, there is a rising demand for efficient power distribution systems that require high-performance capacitor bushings.
Advancements in material technology, such as the development of improved insulating materials and designs, are fu\rther driving market growth by enhancing the reliability and performance of capacitor bushings. The growth in the construction of smart grids, coupled with the increasing demand for efficient energy storage and distribution solutions, is also contributing to the rise in capacitor bushing adoption. The growing focus on minimizing energy losses in power systems, along with rising investments in power generation, transmission, and distribution, is propelling the demand for high-quality capacitor bushings. Regulatory requirements for better energy efficiency and the modernization of aging electrical infrastructure worldwide are expected to further drive market expansion. Despite these growth drivers, challenges such as the high cost of advanced capacitor bushings and the need for continuous technological advancements to meet evolving industry standards remain.
The market is segmented by type, application, end user, and region. By type, the market is divided into 110-500kV, 1-35 kV, 35-110kV, less than 1kV, and more than 500kV. Based on application, the market is categorized into power transformers, gas-insulated switchgear (GIS), circuit breakers, HVDC converter stations, and reactors and capacitor banks. By end user, the market includes utility companies, industrial manufacturers, and renewable energy sectors. Regionally, the market is divided into Asia Pacific, Europe, North America, Latin America, and Middle East & Africa, with demand driven by infrastructure development and energy needs.
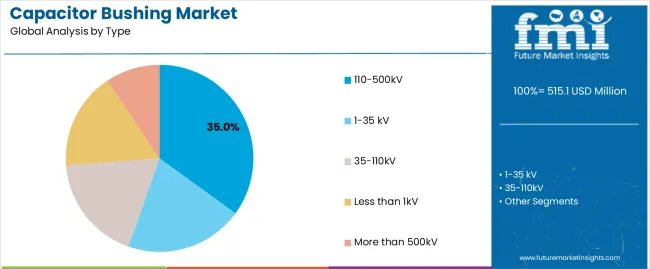
The 110-500kV segment accounts for 35% of the Capacitor Bushing Market, largely due to its crucial role in high-voltage transmission systems. Capacitor bushings within this voltage range are essential for ensuring electrical continuity while minimizing leakage in power transformers and other high-voltage equipment. These bushings help in isolating electrical components from ground, ensuring the safe transfer of power through transmission lines. With the growing demand for efficient power distribution systems, particularly in regions with expanding infrastructure, capacitor bushings in the 110-500kV range are increasingly in demand. They are used in systems that connect various voltage levels, making them vital for large-scale electrical networks.
The growth of this segment is also supported by the global push toward renewable energy integration, such as wind and solar power. Renewable energy sources require reliable and efficient transmission networks to handle varying loads and ensure stable power distribution. Capacitor bushings in the 110-500kV range are key to supporting these advanced energy systems by facilitating the stable operation of transformers and substations. The ongoing investment in smart grids and modernizing power transmission networks ensures a steady demand for high-voltage capacitor bushings, making this segment crucial for the future of energy infrastructure development.
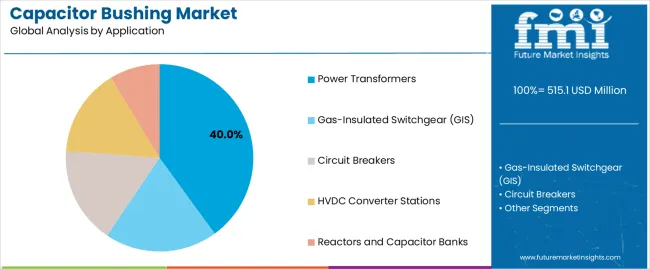
The power transformers segment represents 40% of the Capacitor Bushing Market, driven by the essential role transformers play in electrical power distribution systems. Capacitor bushings in power transformers allow electrical equipment to connect to transmission and distribution systems while providing critical insulation. Power transformers are used to step up or step down voltage for efficient long-distance power transmission, and capacitor bushings help ensure these systems function safely and effectively. The increasing global demand for electricity, particularly in developing economies, further drives the need for high-quality capacitors in these systems.
This segment is particularly important as the transition to renewable energy and the expansion of power grids worldwide require robust, efficient transformers. Capacitor bushings in power transformers are vital for minimizing energy losses and improving system efficiency. As countries modernize their energy infrastructure and integrate renewable energy, the demand for advanced power transformers increases, supporting the need for durable, reliable capacitor bushings. The rising focus on minimizing carbon footprints and improving energy efficiency ensures that capacitor bushings will continue to play a crucial role in the ongoing evolution of global energy systems, ensuring stability and reliability in the power distribution network.
The capacitor bushing sector is expanding due to the rising demand for reliable high-voltage components in power systems. Growth is driven by global grid modernization, renewable energy integration, and infrastructure upgrades. Trends focus on advanced insulation materials and smart grid compatibility, while restraints include high production costs and complex reliability requirements for high-voltage systems.
Key drivers for capacitor bushing growth include the increasing demand for reliable power transmission and distribution systems. As countries modernize energy infrastructure and integrate renewable sources like wind and solar, the need for high-quality bushings capable of handling higher voltages and fluctuating energy loads grows. Urbanization, industrialization, and rising energy consumption in developing regions further fuel demand. Governments and utilities are investing in modern grid systems to improve efficiency and minimize energy loss, creating favorable conditions for capacitor bushing adoption.
Technological advancements, such as the use of advanced polymer composites and enhanced insulation materials, are improving bushing durability and performance under high-stress conditions. These innovations reduce maintenance costs and extend service life, making capacitor bushings more efficient and reliable. The continued push toward ecological energy systems and the expansion of global transmission networks ensure steady demand for advanced capacitor bushing technologies.
Emerging trends in capacitor bushing development are centered on technological advancement and system integration. Manufacturers are adopting advanced insulation materials such as epoxy resins, silicone composites, and nanomaterials to enhance thermal stability and electrical performance. The transition toward ultra-high-voltage (UHV) transmission systems and digital monitoring capabilities is driving demand for smart bushings equipped with real-time diagnostic sensors. These smart components improve operational safety and predict maintenance needs, aligning with grid modernization efforts worldwide.
As renewable energy capacity increases, bushings designed for variable and fluctuating power outputs are becoming critical. Market participants are also emphasizing eco-friendly production processes and recyclable materials to align with eco-friendly goals. Automation in manufacturing and predictive maintenance technologies are becoming more common, allowing faster production with improved quality control. The combination of innovation and digitalization continues to define the next phase of capacitor bushing development.
Despite steady growth, several restraints are affecting capacitor bushing adoption. High manufacturing costs associated with advanced materials and complex production processes remain a major challenge, especially for developing economies. The installation of high-voltage bushings requires significant capital investment, which can limit deployment in budget-sensitive projects. The reliability of capacitor bushings is also a critical concern failures can cause severe equipment damage and power outages, resulting in financial losses.
This makes utilities cautious about adopting new technologies without proven field performance. Supply chain disruptions and raw material price fluctuations further add to production challenges. Stringent regulatory and testing standards in high-voltage applications increase production timelines and costs. While technological progress is addressing some of these limitations, cost optimization and performance validation remain vital for widespread adoption of capacitor bushings in global power transmission systems.
The capacitor bushing market is expanding steadily, with China leading at a 6.8% CAGR through 2035, driven by infrastructure modernization, renewable energy integration, and the need for efficient power transmission systems. India follows at 6.3%, supported by ongoing power grid development, urbanization, and government investments in renewable energy. Germany records a 5.8% CAGR, reflecting its advanced industrial base, strong focus on energy efficiency, and integration of renewable energy sources.
Brazil grows at 5.3%, fueled by infrastructure upgrades and increasing energy demands from the industrial sector. The USA posts a 4.8% CAGR, supported by grid modernization initiatives and the ongoing push for renewable energy. The UK advances at 4.3%, focusing on energy efficiency and the integration of offshore wind energy. Japan grows steadily at 3.8%, driven by its robust industrial sector, energy efficiency programs, and increasing adoption of renewable energy solutions.
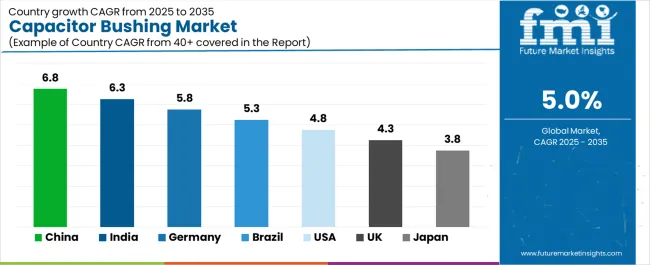
| Country | CAGR (%) |
|---|---|
| China | 6.8% |
| India | 6.3% |
| Germany | 5.8% |
| Brazil | 5.3% |
| USA | 4.8% |
| UK | 4.3% |
| Japan | 3.8% |
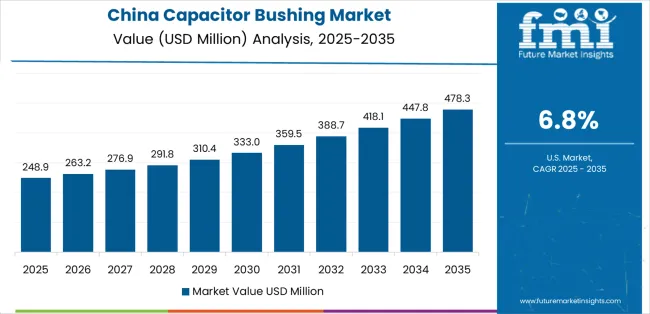
China is leading the capacitor bushing market with a 6.8% CAGR through 2035, driven by rapid infrastructure development and growing energy demands. The country’s focus on modernizing its power grid and the expansion of renewable energy sources, such as wind and solar, significantly contribute to the increasing demand for high-performance components like capacitor bushings. As China continues to urbanize and industrialize, the need for reliable and efficient power transmission systems becomes more critical, further boosting the demand for capacitor bushings in high-voltage applications like transformers and gas-insulated switchgear (GIS).
China’s government has been heavily investing in modernizing its electrical infrastructure, particularly in remote and industrial regions, to support large-scale energy generation and distribution. The integration of renewable energy sources into the national grid requires highly reliable and durable electrical components. Capacitor bushings are essential in maintaining grid stability and ensuring efficient energy transmission. As the country accelerates its transition to a more resilient power grid, the demand for capacitor bushings is expected to grow steadily. The shift toward smart grids, coupled with investments in energy storage and transmission efficiency, will continue to drive China’s leadership in the sector.
India is experiencing substantial growth in the capacitor bushing market, with a 6.3% CAGR through 2035. The country’s rapidly expanding power infrastructure, along with rising energy demands from its growing population and industrial sector, is a major driver for this growth. India’s government is investing heavily in modernizing the electrical grid to improve reliability, especially in rural and underserved areas. The adoption of capacitor bushings in high-voltage applications like power transformers, switchgear, and capacitor banks is critical to supporting the expansion of energy infrastructure.
The increasing focus on renewable energy generation in India is another key factor driving capacitor bushing demand. Solar and wind power, in particular, are becoming integral to the country’s energy mix, requiring upgraded transmission systems to handle fluctuating energy loads. Capacitor bushings play a vital role in ensuring the stability and efficiency of these advanced power systems. With initiatives like the Smart Grid Vision, which focuses on grid modernization and smart technologies, India is investing in energy systems capable of supporting renewable energy integration. As the country continues to grow its power grid and incorporate clean energy solutions, the demand for reliable capacitor bushings will continue to rise.
Germany is witnessing steady growth in the capacitor bushing market, with a 5.8% CAGR through 2035. Germany’s focus on transitioning to renewable energy sources, such as wind and solar, plays a significant role in the growing demand for capacitor bushings. As the country integrates more renewable energy into its power grid, the need for reliable, efficient, and durable electrical components becomes crucial. Capacitor bushings, used in high-voltage transformers and gas-insulated switchgear (GIS), are vital for maintaining grid stability and ensuring the efficient operation of energy systems that handle variable renewable energy inputs.
Germany’s commitment to improving energy efficiency and its leadership in smart grid development are also contributing to the demand for advanced capacitor bushings. The Energiewende (energy transition) program, which focuses on decarbonizing energy production and improving grid resilience, is a key driver for investing in modern electrical infrastructure. As the country aims to reduce its carbon footprint and expand renewable energy capacity, capacitor bushings will play an essential role in ensuring the safe and efficient operation of power transmission systems. With ongoing investments in grid modernization and energy storage solutions, Germany’s demand for capacitor bushings will continue to grow, supported by the integration of green energy technologies.
Brazil is experiencing strong growth in the capacitor bushing market, with a 5.3% CAGR through 2035, driven by the country’s efforts to modernize its power infrastructure and increase electricity access across urban and rural regions. As the largest economy in Latin America, Brazil faces increasing energy demands from both its industrial and residential sectors, pushing the need for reliable power transmission systems. Capacitor bushings are critical components in ensuring the safe and efficient operation of high-voltage equipment, such as transformers and GIS, which are crucial for power transmission and distribution.
Brazil’s focus on integrating renewable energy, particularly from hydroelectric, wind, and solar sources, into the national grid is a key factor driving the demand for capacitor bushings. The country’s power grid needs to be upgraded to accommodate renewable energy fluctuations and ensure stable energy distribution. Capacitor bushings help maintain the operational integrity of these systems. Furthermore, the Brazilian government’s investments in infrastructure projects to modernize the power sector and address energy efficiency gaps are contributing to the growth of the capacitor bushing market. As Brazil continues to prioritize renewable energy and power system efficiency, the demand for capacitor bushings will remain strong.
The USA is seeing steady growth in the capacitor bushing market, with a 4.8% CAGR through 2035. The USA benefits from an advanced and mature power grid that requires ongoing modernization to support growing energy demands and the integration of renewable energy sources. With the increasing shift toward clean energy, such as wind and solar, there is a rising need for robust infrastructure that can handle variable energy flows. Capacitor bushings are crucial for ensuring the efficient and safe operation of transformers, circuit breakers, and other high-voltage equipment that are necessary for stable energy distribution.
The USA government’s focus on grid modernization through initiatives such as the Grid Modernization Initiative and the growing adoption of smart grid technologies further fuels the demand for high-performance capacitor bushings. These components are essential for the safe and efficient operation of the next-generation grid systems, which are designed to be more resilient, reliable, and capable of integrating renewable energy. As the USA continues to invest in energy efficiency and grid improvements, the demand for high-quality capacitor bushings will rise, driven by the need for reliable components to support an evolving energy landscape.
The UK is experiencing steady growth in the capacitor bushing market, with a 4.3% CAGR through 2035. The country’s emphasis on integrating renewable energy into its power systems is driving the need for upgraded transmission infrastructure. As the UK continues to increase its capacity for offshore wind energy and other renewable sources, the demand for high-quality capacitor bushings is rising. These components are essential for maintaining grid stability and ensuring the safe operation of high-voltage equipment, such as transformers and GIS, that are critical for energy distribution.
The UK government’s commitment to achieving net-zero emissions by 2050 has also accelerated investments in energy efficiency and smart grid technologies. As the nation moves toward a greener energy model, capacitor bushings will play a key role in ensuring the safe, efficient transmission of electricity from renewable energy sources to end consumers. The demand for capacitor bushings is expected to continue growing, supported by the country’s focus on environmental responsibility, the transition to cleaner energy, and the ongoing need to modernize the nation’s power grid infrastructure.
Japan is experiencing moderate growth in the capacitor bushing market, with a 3.8% CAGR through 2035. Japan’s well-established industrial infrastructure and focus on renewable energy integration are key drivers for capacitor bushing adoption. The country’s electrical grid, which is undergoing modernization, requires reliable components like capacitor bushings to ensure the stable operation of high-voltage equipment. Japan’s ongoing push for energy efficiency, combined with its focus on integrating renewable energy sources, such as solar and wind, further drives the demand for capacitor bushings in power transformers and GIS.
Japan’s vulnerability to natural disasters like earthquakes and tsunamis has highlighted the need for a more resilient and reliable power grid. Capacitor bushings are critical in ensuring that high-voltage systems remain operational in such challenging conditions. As Japan continues to innovate and improve its energy infrastructure, the demand for advanced, reliable capacitor bushings will grow. The country’s energy policies, along with the adoption of clean energy and grid modernization efforts, will ensure that capacitor bushings remain essential components in Japan’s evolving power systems.
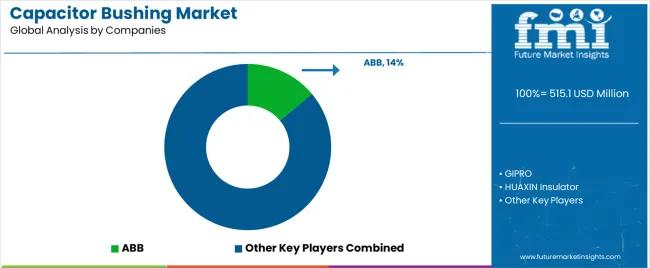
The capacitor bushing sector is competitive, with global giants and regional players driving growth through innovation, efficiency, and tailored solutions. ABB, holding 14% of the market share, stands as a dominant player in the high-voltage bushing industry. Leveraging its strong global presence, ABB focuses on providing high-quality capacitor bushings that meet international standards. The company’s expertise in high-voltage equipment and robust testing mechanisms makes it a leader in the sector. Its ability to deliver reliable, high-performance products across a wide range of voltage levels strengthens its market leadership.
GIPRO GmbH, a European specialist, focuses on epoxy resin insulators and customized capacitor bushings designed for high-stress applications. Its products cater to both indoor and outdoor installations, positioning GIPRO as a niche player that provides bespoke solutions. The company's dedication to innovation and precision has made it a strong competitor in the capacitor bushing market, especially in applications requiring advanced insulation properties.
Regional manufacturers such as Hewei Power, Yash Highvolt, Bushing (Beijing) HV Electric, and Nanjing Electric Insulator also play a vital role, particularly in fast-growing markets like China and India. These companies offer cost-effective solutions while maintaining product reliability. They focus on rapidly adapting to the growing infrastructure demands and providing localized services. These regional players balance affordability with performance, making them key contributors to the sector’s overall growth.
| Items | Values |
|---|---|
| Quantitative Units (2025) | USD million |
| Type | 110-500kV, 1-35 kV, 35-110kV, Less than 1kV, More than 500kV |
| Application | Power Transformers, Gas-Insulated Switchgear (GIS), Circuit Breakers, HVDC Converter Stations, Reactors and Capacitor Banks |
| Regions Covered | Asia Pacific, Europe, North America, Latin America, Middle East & Africa |
| Countries Covered | China, Japan, South Korea, India, Australia & New Zealand, ASEAN, Rest of Asia Pacific, Germany, United Kingdom, France, Italy, Spain, Nordic, BENELUX, Rest of Europe, United States, Canada, Mexico, Brazil, Chile, Rest of Latin America, Kingdom of Saudi Arabia, Other GCC Countries, Turkey, South Africa, Other African Union, Rest of Middle East & Africa |
| Key Companies Profiled | ABB, GIPRO, HUAXIN Insulator, Nanjing Electric Insulator, Siemens, Toshiba, Wishpower, Yash Highvolt, Bushing (Beijing) HV Electric, China XD Group, Hewei Power, Xi'an Shendian Electric |
| Additional Attributes | Dollar sales by type and application categories, market growth trends, market adoption by classification and application segments, regional adoption trends, competitive landscape, capacitor bushing technology advancements, processing and manufacturing facility requirements. |
The global capacitor bushing market is estimated to be valued at USD 515.1 million in 2025.
The market size for the capacitor bushing market is projected to reach USD 839.0 million by 2035.
The capacitor bushing market is expected to grow at a 5.0% CAGR between 2025 and 2035.
The key product types in capacitor bushing market are 110-500kv, 1-35 kv, 35-110kv, less than 1kv and more than 500kv.
In terms of application, power transformers segment to command 40.0% share in the capacitor bushing market in 2025.


Our Research Products

The "Full Research Suite" delivers actionable market intel, deep dives on markets or technologies, so clients act faster, cut risk, and unlock growth.

The Leaderboard benchmarks and ranks top vendors, classifying them as Established Leaders, Leading Challengers, or Disruptors & Challengers.

Locates where complements amplify value and substitutes erode it, forecasting net impact by horizon

We deliver granular, decision-grade intel: market sizing, 5-year forecasts, pricing, adoption, usage, revenue, and operational KPIs—plus competitor tracking, regulation, and value chains—across 60 countries broadly.

Spot the shifts before they hit your P&L. We track inflection points, adoption curves, pricing moves, and ecosystem plays to show where demand is heading, why it is changing, and what to do next across high-growth markets and disruptive tech

Real-time reads of user behavior. We track shifting priorities, perceptions of today’s and next-gen services, and provider experience, then pace how fast tech moves from trial to adoption, blending buyer, consumer, and channel inputs with social signals (#WhySwitch, #UX).

Partner with our analyst team to build a custom report designed around your business priorities. From analysing market trends to assessing competitors or crafting bespoke datasets, we tailor insights to your needs.
Supplier Intelligence
Discovery & Profiling
Capacity & Footprint
Performance & Risk
Compliance & Governance
Commercial Readiness
Who Supplies Whom
Scorecards & Shortlists
Playbooks & Docs
Category Intelligence
Definition & Scope
Demand & Use Cases
Cost Drivers
Market Structure
Supply Chain Map
Trade & Policy
Operating Norms
Deliverables
Buyer Intelligence
Account Basics
Spend & Scope
Procurement Model
Vendor Requirements
Terms & Policies
Entry Strategy
Pain Points & Triggers
Outputs
Pricing Analysis
Benchmarks
Trends
Should-Cost
Indexation
Landed Cost
Commercial Terms
Deliverables
Brand Analysis
Positioning & Value Prop
Share & Presence
Customer Evidence
Go-to-Market
Digital & Reputation
Compliance & Trust
KPIs & Gaps
Outputs
Full Research Suite comprises of:
Market outlook & trends analysis
Interviews & case studies
Strategic recommendations
Vendor profiles & capabilities analysis
5-year forecasts
8 regions and 60+ country-level data splits
Market segment data splits
12 months of continuous data updates
DELIVERED AS:
PDF EXCEL ONLINE
Capacitor Film Slitter Market Size and Share Forecast Outlook 2025 to 2035
Capacitor Kits Market
Ultracapacitors Market Size and Share Forecast Outlook 2025 to 2035
Film Capacitors Market Analysis & Forecast by Material, Application, End Use, and Region Through 2035
Supercapacitors Market Report - Trends & Industry Outlook through 2034
Power Capacitors Market Report – Trends, Growth & Industry Outlook through 2034
Silicon Capacitor Market Insights - Demand & Growth Forecast 2025 to 2035
Tunable Capacitors Market
Electric Capacitor Market Size and Share Forecast Outlook 2025 to 2035
Discrete Capacitors Market Insights - Growth & Forecast 2025 to 2035
High Voltage Capacitors Market Size and Share Forecast Outlook 2025 to 2035
Electrolytic Capacitor Market Size and Share Forecast Outlook 2025 to 2035
Single Layer Capacitors Market
Medium Voltage Capacitor Bank Market Size and Share Forecast Outlook 2025 to 2035
Automotive Ultracapacitor Market Size and Share Forecast Outlook 2025 to 2035
Nanomaterial Supercapacitors Market Size and Share Forecast Outlook 2025 to 2035
Polarized Electric Capacitor Market Size and Share Forecast Outlook 2025 to 2035
Multi-layer Ceramic Capacitor Market Size and Share Forecast Outlook 2025 to 2035
Low Voltage Electric Capacitor Market Size and Share Forecast Outlook 2025 to 2035
High Voltage Electric Capacitor Market Size and Share Forecast Outlook 2025 to 2035

Thank you!
You will receive an email from our Business Development Manager. Please be sure to check your SPAM/JUNK folder too.
Chat With
MaRIA