Generator Bushing Market Forecast and Outlook 2025 to 2035

The generator bushing market is valued at USD 219.1 million in 2025 and is projected to reach USD 291.6 million by 2035, growing at a CAGR of 2.9%. Market growth is supported by the modernization of power generation infrastructure, expansion of renewable energy installations, and the need for reliable electrical insulation systems in high-voltage applications. The ongoing replacement of aging grid assets and continued investment in utility-scale generation facilities sustain steady demand across both industrialized and emerging economies.

Low-voltage bushings represent the leading product segment, widely used in power plants, substations, and auxiliary electrical systems where compact design and operational efficiency are essential. Their performance advantages include reduced partial discharge, higher dielectric strength, and longer service life under thermal and electrical stress. Technological advancements in epoxy-resin and oil-impregnated paper (OIP) insulation materials continue to improve mechanical durability and thermal endurance in demanding environments.
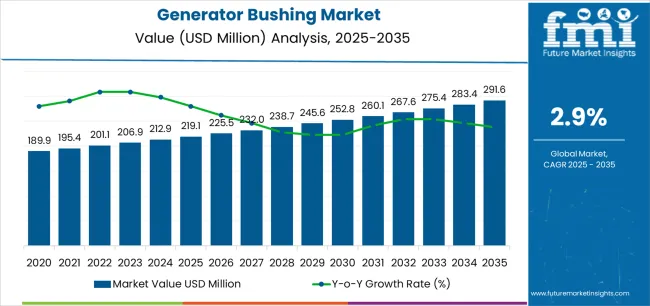
Quick Stats for Generator Bushing Market

  • Generator Bushing Market Value (2025): USD 219.1 million
  • Generator Bushing Market Forecast Value (2035): USD 291.6 million
  • Generator Bushing Market Forecast CAGR: 2.9%
  • Leading Type in Generator Bushing Market: Low Voltage
  • Key Growth Regions in Generator Bushing Market: Asia Pacific, Europe, and North America
  • Top Players in Generator Bushing Market: Nanjing Electric, Hitachi Energy, Trench Group, GE, HSP Hochspannungsgeräte, SERD, AGTServices, Pfiffner, Mitsubishi Electric Power Products, Reinhausen Power Composites, Toshiba Energy Systems & Solutions, Suzhou Yunteng Electric, ChinSun Bushing

Generator Bushing Market Market Value Analysis

Asia Pacific remains the dominant regional market due to rapid capacity additions in China and India. Europe and North America maintain stable demand through grid refurbishment and compliance with safety and reliability standards. Key market participants include Nanjing Electric, Hitachi Energy, Trench Group, GE, and HSP Hochspannungsgeräte, focusing on material innovation, insulation performance, and integration with next-generation power systems.

What is the Growth Forecast for the Generator Bushing Market through 2035?

Growth momentum analysis indicates a steady but moderate expansion rate, supported by consistent demand from the power generation and industrial sectors. Between 2025 and 2029, market momentum will remain moderate as replacement demand for high-voltage insulation components drives incremental gains. Upgrades in conventional power plants and rising maintenance activities for aging grid infrastructure will contribute to early growth.

From 2030 to 2035, the market’s growth momentum will stabilize as renewable energy installations expand and generator manufacturing activities shift toward efficiency-focused designs. Demand will be sustained by modernization of existing equipment rather than new installations, reflecting a mature industry cycle. Advancements in composite and epoxy resin insulation materials will help maintain competitive performance and durability standards. While growth acceleration will remain limited, steady procurement from utilities and industrial users will ensure a consistent market flow. The momentum trend suggests long-term resilience supported by ongoing power infrastructure maintenance and gradual integration of advanced bushing materials in generator systems worldwide.

Generator Bushing Market Key Takeaways

Metric Value
Market Value (2025) USD 219.1 million
Market Forecast Value (2035) USD 291.6 million
Forecast CAGR (2025 to 2035) 2.9%

Why is the Generator Bushing Market Growing?

The generator bushing market is expanding in response to increased global deployment of large-scale power generation facilities, including thermal plants, hydroelectric installations and renewables such as pumped-storage systems. Generator bushings, which provide insulated electrical passage through generator housing and connect internal windings to external circuits, must meet rising performance and reliability expectations in high-current, high-voltage environments.

Advances in insulation technologies (e.g., resin-impregnated paper, composite materials), along with heightened focus on maintenance, lifecycle costs and reliability, drive greater specification and replacement activity. Demand is further supported by grid modernisation efforts, refurbishment of ageing generator fleets and stricter electrical-safety/regulatory standards across utility end-users. However, growth is constrained by significant upfront investment for high-performance bushings, long asset lifecycles (which slow replacement cycles), and limited standardisation across generator types and regions, which can limit rapid global uptake.

Which Classification and Application Segments Lead the Generator Bushing Market?

The generator bushing market is segmented by classification and application. By classification, the market is divided into low voltage, medium voltage, and high voltage generator bushings. Based on application, it is categorized into power plants, substations, power distribution rooms, and other locations where electricity is used. Regionally, the market is divided into Asia Pacific, Europe, North America, and other key regions.
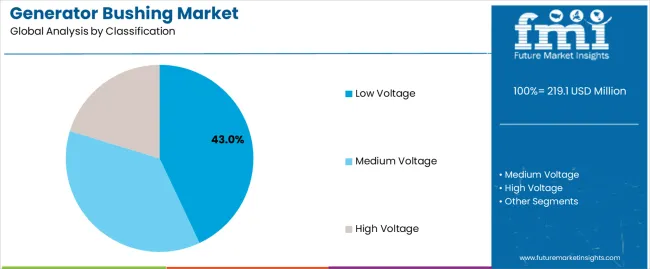
By Classification, the Low Voltage Segment Accounts for the Largest Market Share

Generator Bushing Market Analysis By Classification

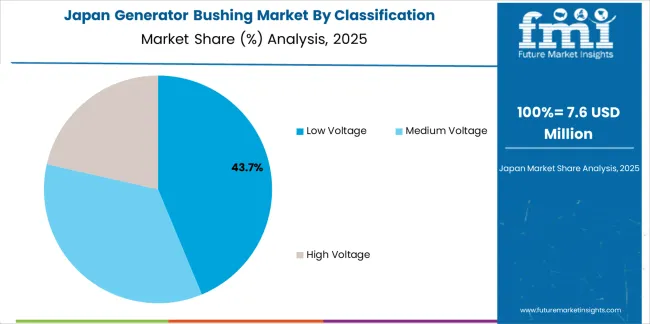
The low voltage segment holds the leading position in the generator bushing market, representing approximately 43.0% of total market share in 2025. Low-voltage bushings are extensively used in compact generators, industrial machinery, and distributed power systems due to their simpler insulation design, ease of installation, and cost efficiency. These bushings provide electrical isolation between the current-carrying conductor and grounded enclosure components while maintaining mechanical support and dielectric integrity.

The segment’s prominence is supported by the growing deployment of low- and medium-capacity power systems in commercial buildings, industrial plants, and distributed renewable installations. Additionally, advancements in epoxy resin and polymeric insulation materials have improved reliability and heat resistance in low-voltage bushings. The medium voltage and high voltage categories collectively account for the remainder of the market, primarily serving large power generation units and grid infrastructure. Demand in these segments is driven by modernization projects and the replacement of aging equipment in power transmission networks.

Key factors supporting the low voltage segment include:
  • Widespread use in distributed and small-capacity power generation systems.
  • Lower installation and maintenance costs compared to higher voltage bushings.
  • Improved insulation technology enhancing safety and reliability.
  • Increased demand from industrial automation and backup power applications.

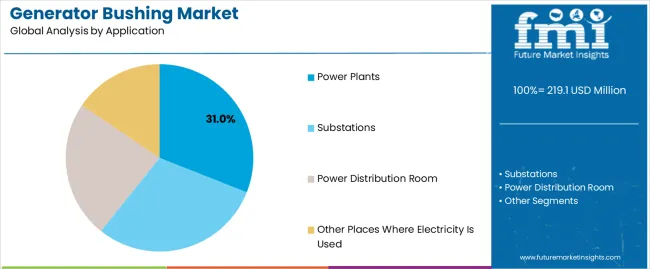
By Application, the Power Plants Segment Represents the Dominant Market Category

Generator Bushing Market Analysis By Application

The power plants segment accounts for approximately 31.0% of the generator bushing market in 2025. This leadership is attributed to the essential role bushings play in power generation systems, ensuring safe current transfer from generators to transformers and switchgear assemblies. These components are critical for maintaining insulation strength, mechanical stability, and operational continuity in high-load environments such as thermal, hydroelectric, and renewable energy plants.

Power plant applications demand high reliability due to continuous operation and exposure to elevated temperatures, electrical stresses, and environmental contaminants. The substations segment follows, driven by the need for durable, high-dielectric bushings used in grid interconnections and power conversion systems. Power distribution rooms and other electrical installations constitute additional demand sources in commercial and industrial sectors.

Primary dynamics driving demand from the power plants segment include:

  • Expansion and refurbishment of existing thermal and renewable energy generation facilities.
  • Continuous operation requirements necessitating high-durability bushing designs.
  • Integration of modern insulation materials improving thermal and electrical performance.
  • Rising investments in grid reliability and long-term power infrastructure maintenance.

What are the Drivers, Restraints, and Key Trends of the Generator Bushing Market?

Expansion of power generation capacity, renewable energy integration, and grid upgrade initiatives are fuelling demand.

The generator bushing market is driven by increasing global electricity demand and corresponding growth in power-plant build-outs, which require high-performance bushings for reliable generator connection and insulation. Integration of renewable-energy plants (such as wind and solar farms) into existing grids creates additional demand for bushings that connect high-voltage generator output to substations and transformers. Many regions are upgrading aging grid infrastructure and expanding transmission networks, thereby boosting demand for modern bushing solutions with improved insulation, durability and compatibility with high-voltage equipment.

High material and manufacturing costs, supply-chain constraints and competitive alternative technologies restrict broader growth.

Production of advanced generator bushings involves expensive insulating materials, precision engineering and rigorous testing, all of which raise unit cost and limit adoption, especially in cost-sensitive markets. Raw-material price volatility and global supply-chain disruptions can delay delivery and increase lead-times, reducing attractiveness for fast-track power-projects. The availability of alternative insulation technologies and retrofitting of existing equipment may reduce demand for new bushing installations, constraining overall growth of dedicated generator bushing segments.

Shift toward polymeric and silicone bushings, growth in Asia-Pacific markets, and digital monitoring integration are shaping the outlook.

Manufacturers are increasingly adopting polymeric, resin-impregnated and silicone-rubber insulation materials in bushings to enhance mechanical strength, reduce maintenance and improve performance under harsh environments. Regionally, the Asia-Pacific region is witnessing significant growth in generator bushing demand, driven by large-scale power-plant construction, expansion of renewable-energy capacity and grid-modernisation programs in countries such as China, India and Southeast Asia. A further trend is the adoption of condition-monitoring features (such as embedded sensors and smart diagnostics) in bushings to enable real-time status tracking, predictive maintenance and reduced risk of failure in critical generator systems.

Analysis of the Generator Bushing Market by Key Country

The global generator bushing market is expanding steadily through 2035, supported by the modernization of power generation infrastructure, demand for renewable energy integration, and advancements in insulation technologies. China leads with a 3.9% CAGR, followed by India at 3.6%, driven by continuous grid expansion and investment in power reliability. Germany grows at 3.3%, reflecting strong industrial modernization and smart grid deployment. Brazil’s 3.0% growth stems from hydropower and industrial electricity upgrades. The United States grows at 2.8%, supported by refurbishment of legacy power plants, while the United Kingdom (2.5%) and Japan (2.2%) maintain stable demand through ongoing electrical equipment standardization and technology upgrades.
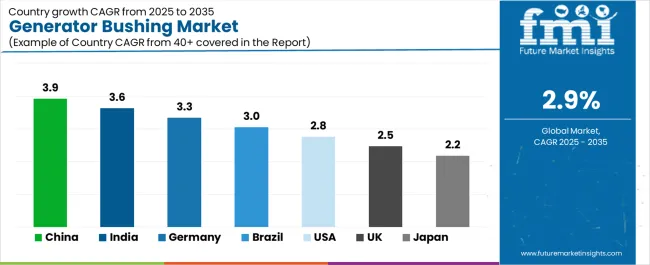
Generator Bushing Market Cagr Analysis By Country

Country CAGR (%)
China 3.9
India 3.6
Germany 3.3
Brazil 3.0
USA 2.8
UK 2.5
Japan 2.2

How is China leading the Generator Bushing Market?

China’s generator bushing market grows at 3.9% CAGR, driven by extensive power plant construction, renewable integration, and industrial electrification. The government’s grid modernization programs under the Energy Development Plan 2030 are increasing demand for high-voltage bushings with advanced insulation systems. Domestic manufacturers are expanding production of epoxy-resin and porcelain bushings designed for turbine generators and switchgear systems. Collaborations between state-owned utilities and local component suppliers are improving reliability standards and material testing processes. The market benefits from accelerated deployment of wind and solar energy projects that require high-performance generator insulation components.

Key Market Factors:

  • Expansion of national grid and renewable energy power plants
  • Government policies promoting modernization of generation infrastructure
  • Growth in domestic manufacturing of high-voltage and epoxy-resin bushings
  • Collaboration between state utilities and industrial component suppliers

How is India advancing its Generator Bushing Market?

India’s market grows at 3.6% CAGR, supported by infrastructure investment, industrial electrification, and renewable capacity expansion. The National Electricity Plan emphasizes modernization of power generation assets, driving adoption of high-performance insulation components. Domestic electrical equipment manufacturers are producing silicone and composite bushings suited for high-temperature and humid operating conditions. Collaborations between public utilities and engineering firms are improving testing and reliability certification standards. The growing number of hydropower and thermal plant refurbishments also strengthens replacement demand. India’s emphasis on indigenization of power components supports cost-efficient production and export of generator bushings.

Market Development Factors:
  • Growth in power generation infrastructure modernization under national programs
  • Rising manufacturing of composite and silicone-based bushings
  • Strengthening of quality testing and reliability certification standards
  • Increased refurbishment activity in hydropower and thermal generation facilities

How is Germany supporting innovation in the Generator Bushing Market?

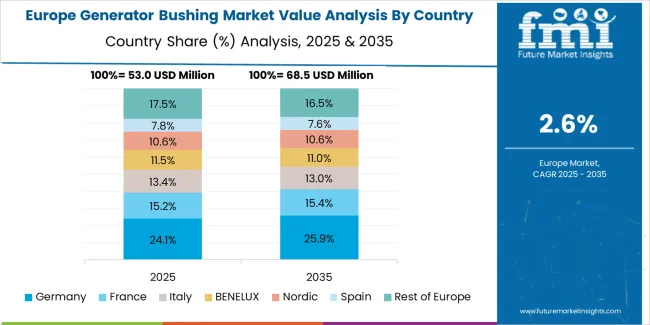
Generator Bushing Market Europe Country Market Share Analysis, 2025 & 2035

Germany’s market grows at 3.3% CAGR, supported by industrial automation, renewable energy development, and high-performance insulation system innovation. German manufacturers are focusing on dry-type and gas-insulated bushings for wind and hydroelectric power plants. Continuous R&D in dielectric materials and epoxy composites enhances reliability and reduces maintenance costs. The country’s transition toward renewable energy under the Energiewende policy sustains steady demand for generator bushings in hybrid generation systems. Collaboration between engineering universities and component suppliers supports the design of compact, thermally optimized insulation components for advanced power generation systems.

Key Market Characteristics:

  • Innovation in dry-type and gas-insulated bushing designs
  • Integration of dielectric composite materials for performance optimization
  • Application growth in wind and hybrid power generation systems
  • R&D collaboration enhancing product quality and environmental safety

How is Brazil expanding its Generator Bushing Market?

Brazil’s market grows at 3.0% CAGR, driven by grid reinforcement, hydropower modernization, and industrial electricity expansion. The country’s investment in power reliability under the Ten-Year Energy Expansion Plan supports upgrades to existing generator equipment. Local manufacturers are producing medium-voltage bushings tailored for tropical operating conditions. Partnerships with international suppliers are transferring expertise in epoxy resin and oil-impregnated paper (OIP) insulation systems. Growing energy consumption in mining, steel, and manufacturing industries supports consistent market demand. Brazil’s transition toward renewable and hybrid energy projects creates opportunities for modern bushing applications in power conversion systems.

Market Development Factors:
  • Infrastructure investment promoting modernization of hydropower and thermal plants
  • Development of medium-voltage bushings for industrial and grid applications
  • Partnerships enabling local production and technical training programs
  • Increased deployment of renewable energy systems requiring generator insulation upgrades

How is the United States progressing in the Generator Bushing Market?

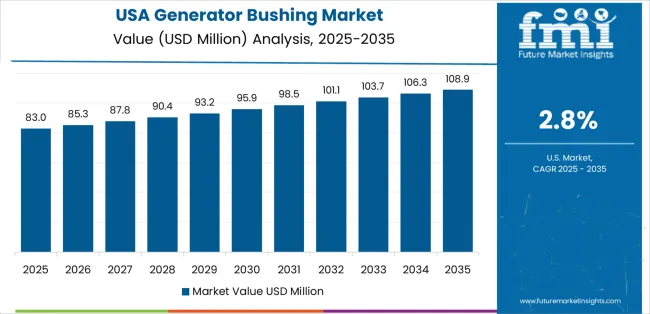
Generator Bushing Market Country Value Analysis

The United States grows at 2.8% CAGR, driven by modernization of legacy power plants and integration of advanced electrical components. Power utilities are upgrading aging generator insulation systems to improve reliability and operational safety. Manufacturers are developing polymeric and gas-insulated bushings to meet high-voltage and environmental performance standards. The transition toward renewable and distributed power generation is stimulating demand for flexible insulation technologies. The market benefits from federal investment in grid resilience and infrastructure reliability under national energy modernization programs. Continuous product testing under IEEE and ANSI standards ensures consistent quality across applications.

Key Market Factors:

  • Upgrading of aging power generation and distribution infrastructure
  • Adoption of polymeric and gas-insulated bushing technologies
  • Regulatory compliance under IEEE and ANSI performance standards
  • Growth in renewable and distributed energy systems requiring durable insulation

How is the United Kingdom developing its Generator Bushing Market?

The United Kingdom’s market grows at 2.5% CAGR, supported by ongoing grid modernization and renewable energy expansion. The transition to low-carbon power generation is increasing demand for reliable insulation components in offshore wind and combined-cycle power plants. Local manufacturers are focusing on compact, low-leakage bushing designs compliant with European electrical safety standards. Collaboration with European suppliers enhances innovation in epoxy resin formulations and testing methods. The country’s emphasis on extending the operational lifespan of existing power assets through preventive maintenance also sustains replacement demand.

Market Development Factors:
  • Modernization of electrical networks supporting renewable power integration
  • Adoption of compact, low-leakage insulation systems in power plants
  • Collaboration with European suppliers for technology transfer and testing innovation
  • Increased investment in preventive maintenance and reliability enhancement programs

How is Japan maintaining its Generator Bushing Market?

Generator Bushing Market Japan Market Share Analysis By Classification

Japan’s market grows at 2.2% CAGR, reflecting its focus on high-quality manufacturing, electrical reliability, and export-oriented engineering. Domestic firms are producing precision-engineered bushings using advanced epoxy resin and high-temperature insulation materials. The aging power infrastructure is driving moderate replacement demand, particularly in thermal and hydroelectric plants. Research in compact bushing design supports integration within small and high-output generators. The Green Innovation Fund supports renewable and hydrogen energy projects, creating new applications for lightweight, thermally stable bushings. Japan’s emphasis on process reliability and material innovation maintains its position in the high-performance segment.

Key Market Characteristics:
  • Development of precision-engineered, high-temperature insulation components
  • Moderate replacement demand from aging thermal and hydroelectric plants
  • Innovation in compact and lightweight bushing design for hybrid systems
  • Strong manufacturing standards ensuring reliability and export competitiveness

What is the competitive landscape of the Generator Bushing Market?

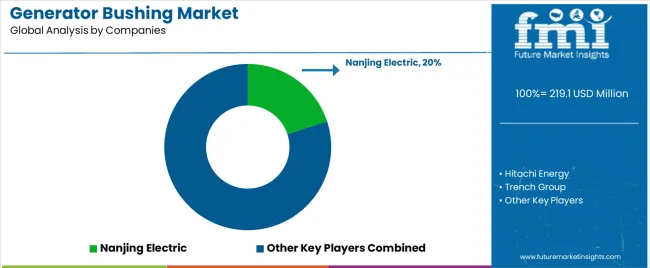
Generator Bushing Market Analysis By Company

The generator bushing market is moderately concentrated, with around a dozen global manufacturers supplying equipment for power generation and high-voltage applications. Nanjing Electric leads the market with an estimated 20.0% global share, supported by its strong product portfolio in high-voltage bushings, advanced insulation systems, and consistent supply to thermal, hydro, and renewable energy sectors. The company’s advantage stems from material innovation and long-term collaboration with power utilities and OEMs across Asia and Europe.

Hitachi Energy, Trench Group, and GE follow as major international competitors, leveraging decades of engineering expertise and large-scale production capacity. Their competitiveness is reinforced by standardized product platforms, advanced resin-impregnated paper (RIP) technologies, and extensive aftersales service networks. HSP Hochspannungsgeräte and Pfiffner specialize in precision-engineered high-voltage bushings with strong European presence, emphasizing reliability, dielectric strength, and lifecycle performance.

Mid-tier and regional firms such as SERD, AGTServices, and Suzhou Yunteng Electric focus on refurbishment, component replacement, and cost-effective production tailored to regional power infrastructure needs. Mitsubishi Electric Power Products, Reinhausen Power Composites, and Toshiba Energy Systems & Solutions integrate bushing manufacturing within broader electrical system portfolios, ensuring compatibility with generators, transformers, and switchgear assemblies.

Competition in this market revolves around electrical performance, insulation technology, and reliability under high thermal stress. Growth is driven by modernization of aging power assets, expansion of renewable generation, and increasing demand for high-voltage components with enhanced safety and maintenance efficiency.

Key Players in the Generator Bushing Market

  • Nanjing Electric
  • Hitachi Energy
  • Trench Group
  • GE
  • HSP Hochspannungsgeräte
  • SERD
  • AGTServices
  • Pfiffner
  • Mitsubishi Electric Power Products
  • Reinhausen Power Composites
  • Toshiba Energy Systems & Solutions
  • Suzhou Yunteng Electric
  • ChinSun Bushing

Scope of the Report

Items Values
Quantitative Units USD million
Classification Low Voltage, Medium Voltage, High Voltage
Application Power Plants, Substations, Power Distribution Room, Other Places Where Electricity Is Used
Regions Covered Asia Pacific, Europe, North America, Latin America, Middle East & Africa
Countries Covered India, China, USA, Germany, South Korea, Japan, Italy, and 40+ countries
Key Companies Profiled Nanjing Electric, Hitachi Energy, Trench Group, GE, HSP Hochspannungsgeräte, SERD, AGTServices, Pfiffner, Mitsubishi Electric Power Products, Reinhausen Power Composites, Toshiba Energy Systems & Solutions, Suzhou Yunteng Electric, ChinSun Bushing
Additional Attributes Dollar sales by classification and application categories; regional adoption trends across Asia Pacific, Europe, and North America; competitive landscape of power equipment and insulation component manufacturers; advancements in high-voltage bushing technologies; integration with modern power generation and grid transmission systems.

Generator Bushing Market by Segments

Classification:

  • Low Voltage
  • Medium Voltage
  • High Voltage

Application:

  • Power Plants
  • Substations
  • Power Distribution Room
  • Other Places Where Electricity Is Used

Region:

  • Asia Pacific
    • China
    • Japan
    • South Korea
    • India
    • Australia & New Zealand
    • ASEAN
    • Rest of Asia Pacific
  • Europe
    • Germany
    • United Kingdom
    • France
    • Italy
    • Spain
    • Nordic
    • BENELUX
    • Rest of Europe
  • North America
    • United States
    • Canada
    • Mexico
  • Latin America
    • Brazil
    • Chile
    • Rest of Latin America
  • Middle East & Africa
    • Kingdom of Saudi Arabia
    • Other GCC Countries
    • Turkey
    • South Africa
    • Other African Union
    • Rest of Middle East & Africa

Frequently Asked Questions

How big is the generator bushing market in 2025?

The global generator bushing market is estimated to be valued at USD 219.1 million in 2025.

What will be the size of generator bushing market in 2035?

The market size for the generator bushing market is projected to reach USD 291.6 million by 2035.

How much will be the generator bushing market growth between 2025 and 2035?

The generator bushing market is expected to grow at a 2.9% CAGR between 2025 and 2035.

What are the key product types in the generator bushing market?

The key product types in generator bushing market are low voltage, medium voltage and high voltage.

Which application segment to contribute significant share in the generator bushing market in 2025?

In terms of application, power plants segment to command 31.0% share in the generator bushing market in 2025.

Table of Content

  1. Executive Summary
    • Global Market Outlook
    • Demand to side Trends
    • Supply to side Trends
    • Technology Roadmap Analysis
    • Analysis and Recommendations
  2. Market Overview
    • Market Coverage / Taxonomy
    • Market Definition / Scope / Limitations
  3. Market Background
    • Market Dynamics
      • Drivers
      • Restraints
      • Opportunity
      • Trends
    • Scenario Forecast
      • Demand in Optimistic Scenario
      • Demand in Likely Scenario
      • Demand in Conservative Scenario
    • Opportunity Map Analysis
    • Product Life Cycle Analysis
    • Supply Chain Analysis
    • Investment Feasibility Matrix
    • Value Chain Analysis
    • PESTLE and Porter’s Analysis
    • Regulatory Landscape
    • Regional Parent Market Outlook
    • Production and Consumption Statistics
    • Import and Export Statistics
  4. Global Market Analysis 2020 to 2024 and Forecast, 2025 to 2035
    • Historical Market Size Value (USD Million) Analysis, 2020 to 2024
    • Current and Future Market Size Value (USD Million) Projections, 2025 to 2035
      • Y to o to Y Growth Trend Analysis
      • Absolute $ Opportunity Analysis
  5. Global Market Pricing Analysis 2020 to 2024 and Forecast 2025 to 2035
  6. Global Market Analysis 2020 to 2024 and Forecast 2025 to 2035, By Classification
    • Introduction / Key Findings
    • Historical Market Size Value (USD Million) Analysis By Classification , 2020 to 2024
    • Current and Future Market Size Value (USD Million) Analysis and Forecast By Classification , 2025 to 2035
      • Low Voltage
      • Medium Voltage
      • High Voltage
    • Y to o to Y Growth Trend Analysis By Classification , 2020 to 2024
    • Absolute $ Opportunity Analysis By Classification , 2025 to 2035
  7. Global Market Analysis 2020 to 2024 and Forecast 2025 to 2035, By Application
    • Introduction / Key Findings
    • Historical Market Size Value (USD Million) Analysis By Application, 2020 to 2024
    • Current and Future Market Size Value (USD Million) Analysis and Forecast By Application, 2025 to 2035
      • Power Plants
      • Substations
      • Power Distribution Room
      • Other Places Where Electricity Is Used
    • Y to o to Y Growth Trend Analysis By Application, 2020 to 2024
    • Absolute $ Opportunity Analysis By Application, 2025 to 2035
  8. Global Market Analysis 2020 to 2024 and Forecast 2025 to 2035, By Region
    • Introduction
    • Historical Market Size Value (USD Million) Analysis By Region, 2020 to 2024
    • Current Market Size Value (USD Million) Analysis and Forecast By Region, 2025 to 2035
      • North America
      • Latin America
      • Western Europe
      • Eastern Europe
      • East Asia
      • South Asia and Pacific
      • Middle East & Africa
    • Market Attractiveness Analysis By Region
  9. North America Market Analysis 2020 to 2024 and Forecast 2025 to 2035, By Country
    • Historical Market Size Value (USD Million) Trend Analysis By Market Taxonomy, 2020 to 2024
    • Market Size Value (USD Million) Forecast By Market Taxonomy, 2025 to 2035
      • By Country
        • USA
        • Canada
        • Mexico
      • By Classification
      • By Application
    • Market Attractiveness Analysis
      • By Country
      • By Classification
      • By Application
    • Key Takeaways
  10. Latin America Market Analysis 2020 to 2024 and Forecast 2025 to 2035, By Country
    • Historical Market Size Value (USD Million) Trend Analysis By Market Taxonomy, 2020 to 2024
    • Market Size Value (USD Million) Forecast By Market Taxonomy, 2025 to 2035
      • By Country
        • Brazil
        • Chile
        • Rest of Latin America
      • By Classification
      • By Application
    • Market Attractiveness Analysis
      • By Country
      • By Classification
      • By Application
    • Key Takeaways
  11. Western Europe Market Analysis 2020 to 2024 and Forecast 2025 to 2035, By Country
    • Historical Market Size Value (USD Million) Trend Analysis By Market Taxonomy, 2020 to 2024
    • Market Size Value (USD Million) Forecast By Market Taxonomy, 2025 to 2035
      • By Country
        • Germany
        • UK
        • Italy
        • Spain
        • France
        • Nordic
        • BENELUX
        • Rest of Western Europe
      • By Classification
      • By Application
    • Market Attractiveness Analysis
      • By Country
      • By Classification
      • By Application
    • Key Takeaways
  12. Eastern Europe Market Analysis 2020 to 2024 and Forecast 2025 to 2035, By Country
    • Historical Market Size Value (USD Million) Trend Analysis By Market Taxonomy, 2020 to 2024
    • Market Size Value (USD Million) Forecast By Market Taxonomy, 2025 to 2035
      • By Country
        • Russia
        • Poland
        • Hungary
        • Balkan & Baltic
        • Rest of Eastern Europe
      • By Classification
      • By Application
    • Market Attractiveness Analysis
      • By Country
      • By Classification
      • By Application
    • Key Takeaways
  13. East Asia Market Analysis 2020 to 2024 and Forecast 2025 to 2035, By Country
    • Historical Market Size Value (USD Million) Trend Analysis By Market Taxonomy, 2020 to 2024
    • Market Size Value (USD Million) Forecast By Market Taxonomy, 2025 to 2035
      • By Country
        • China
        • Japan
        • South Korea
      • By Classification
      • By Application
    • Market Attractiveness Analysis
      • By Country
      • By Classification
      • By Application
    • Key Takeaways
  14. South Asia and Pacific Market Analysis 2020 to 2024 and Forecast 2025 to 2035, By Country
    • Historical Market Size Value (USD Million) Trend Analysis By Market Taxonomy, 2020 to 2024
    • Market Size Value (USD Million) Forecast By Market Taxonomy, 2025 to 2035
      • By Country
        • India
        • ASEAN
        • Australia & New Zealand
        • Rest of South Asia and Pacific
      • By Classification
      • By Application
    • Market Attractiveness Analysis
      • By Country
      • By Classification
      • By Application
    • Key Takeaways
  15. Middle East & Africa Market Analysis 2020 to 2024 and Forecast 2025 to 2035, By Country
    • Historical Market Size Value (USD Million) Trend Analysis By Market Taxonomy, 2020 to 2024
    • Market Size Value (USD Million) Forecast By Market Taxonomy, 2025 to 2035
      • By Country
        • Kingdom of Saudi Arabia
        • Other GCC Countries
        • Turkiye
        • South Africa
        • Other African Union
        • Rest of Middle East & Africa
      • By Classification
      • By Application
    • Market Attractiveness Analysis
      • By Country
      • By Classification
      • By Application
    • Key Takeaways
  16. Key Countries Market Analysis
    • USA
      • Pricing Analysis
      • Market Share Analysis, 2024
        • By Classification
        • By Application
    • Canada
      • Pricing Analysis
      • Market Share Analysis, 2024
        • By Classification
        • By Application
    • Mexico
      • Pricing Analysis
      • Market Share Analysis, 2024
        • By Classification
        • By Application
    • Brazil
      • Pricing Analysis
      • Market Share Analysis, 2024
        • By Classification
        • By Application
    • Chile
      • Pricing Analysis
      • Market Share Analysis, 2024
        • By Classification
        • By Application
    • Germany
      • Pricing Analysis
      • Market Share Analysis, 2024
        • By Classification
        • By Application
    • UK
      • Pricing Analysis
      • Market Share Analysis, 2024
        • By Classification
        • By Application
    • Italy
      • Pricing Analysis
      • Market Share Analysis, 2024
        • By Classification
        • By Application
    • Spain
      • Pricing Analysis
      • Market Share Analysis, 2024
        • By Classification
        • By Application
    • France
      • Pricing Analysis
      • Market Share Analysis, 2024
        • By Classification
        • By Application
    • India
      • Pricing Analysis
      • Market Share Analysis, 2024
        • By Classification
        • By Application
    • ASEAN
      • Pricing Analysis
      • Market Share Analysis, 2024
        • By Classification
        • By Application
    • Australia & New Zealand
      • Pricing Analysis
      • Market Share Analysis, 2024
        • By Classification
        • By Application
    • China
      • Pricing Analysis
      • Market Share Analysis, 2024
        • By Classification
        • By Application
    • Japan
      • Pricing Analysis
      • Market Share Analysis, 2024
        • By Classification
        • By Application
    • South Korea
      • Pricing Analysis
      • Market Share Analysis, 2024
        • By Classification
        • By Application
    • Russia
      • Pricing Analysis
      • Market Share Analysis, 2024
        • By Classification
        • By Application
    • Poland
      • Pricing Analysis
      • Market Share Analysis, 2024
        • By Classification
        • By Application
    • Hungary
      • Pricing Analysis
      • Market Share Analysis, 2024
        • By Classification
        • By Application
    • Kingdom of Saudi Arabia
      • Pricing Analysis
      • Market Share Analysis, 2024
        • By Classification
        • By Application
    • Turkiye
      • Pricing Analysis
      • Market Share Analysis, 2024
        • By Classification
        • By Application
    • South Africa
      • Pricing Analysis
      • Market Share Analysis, 2024
        • By Classification
        • By Application
  17. Market Structure Analysis
    • Competition Dashboard
    • Competition Benchmarking
    • Market Share Analysis of Top Players
      • By Regional
      • By Classification
      • By Application
  18. Competition Analysis
    • Competition Deep Dive
      • Nanjing Electric
        • Overview
        • Product Portfolio
        • Profitability by Market Segments (Product/Age /Sales Channel/Region)
        • Sales Footprint
        • Strategy Overview
          • Marketing Strategy
          • Product Strategy
          • Channel Strategy
      • Hitachi Energy
      • Trench Group
      • GE
      • HSP Hochspannungsgeräte
      • SERD
      • AGTServices
      • Pfiffner
      • Mitsubishi Electric Power Products
      • Reinhausen Power Composites
      • Toshiba Energy Systems & Solutions
      • Suzhou Yunteng Electric
      • ChinSun Bushing
  19. Assumptions & Acronyms Used
  20. Research Methodology

List of Tables

  • Table 1: Global Market Value (USD Million) Forecast by Region, 2020 to 2035
  • Table 2: Global Market Value (USD Million) Forecast by Classification , 2020 to 2035
  • Table 3: Global Market Value (USD Million) Forecast by Application, 2020 to 2035
  • Table 4: North America Market Value (USD Million) Forecast by Country, 2020 to 2035
  • Table 5: North America Market Value (USD Million) Forecast by Classification , 2020 to 2035
  • Table 6: North America Market Value (USD Million) Forecast by Application, 2020 to 2035
  • Table 7: Latin America Market Value (USD Million) Forecast by Country, 2020 to 2035
  • Table 8: Latin America Market Value (USD Million) Forecast by Classification , 2020 to 2035
  • Table 9: Latin America Market Value (USD Million) Forecast by Application, 2020 to 2035
  • Table 10: Western Europe Market Value (USD Million) Forecast by Country, 2020 to 2035
  • Table 11: Western Europe Market Value (USD Million) Forecast by Classification , 2020 to 2035
  • Table 12: Western Europe Market Value (USD Million) Forecast by Application, 2020 to 2035
  • Table 13: Eastern Europe Market Value (USD Million) Forecast by Country, 2020 to 2035
  • Table 14: Eastern Europe Market Value (USD Million) Forecast by Classification , 2020 to 2035
  • Table 15: Eastern Europe Market Value (USD Million) Forecast by Application, 2020 to 2035
  • Table 16: East Asia Market Value (USD Million) Forecast by Country, 2020 to 2035
  • Table 17: East Asia Market Value (USD Million) Forecast by Classification , 2020 to 2035
  • Table 18: East Asia Market Value (USD Million) Forecast by Application, 2020 to 2035
  • Table 19: South Asia and Pacific Market Value (USD Million) Forecast by Country, 2020 to 2035
  • Table 20: South Asia and Pacific Market Value (USD Million) Forecast by Classification , 2020 to 2035
  • Table 21: South Asia and Pacific Market Value (USD Million) Forecast by Application, 2020 to 2035
  • Table 22: Middle East & Africa Market Value (USD Million) Forecast by Country, 2020 to 2035
  • Table 23: Middle East & Africa Market Value (USD Million) Forecast by Classification , 2020 to 2035
  • Table 24: Middle East & Africa Market Value (USD Million) Forecast by Application, 2020 to 2035

List of Figures

  • Figure 1: Global Market Pricing Analysis
  • Figure 2: Global Market Value (USD Million) Forecast 2020-2035
  • Figure 3: Global Market Value Share and BPS Analysis by Classification , 2025 and 2035
  • Figure 4: Global Market Y-o-Y Growth Comparison by Classification , 2025-2035
  • Figure 5: Global Market Attractiveness Analysis by Classification
  • Figure 6: Global Market Value Share and BPS Analysis by Application, 2025 and 2035
  • Figure 7: Global Market Y-o-Y Growth Comparison by Application, 2025-2035
  • Figure 8: Global Market Attractiveness Analysis by Application
  • Figure 9: Global Market Value (USD Million) Share and BPS Analysis by Region, 2025 and 2035
  • Figure 10: Global Market Y-o-Y Growth Comparison by Region, 2025-2035
  • Figure 11: Global Market Attractiveness Analysis by Region
  • Figure 12: North America Market Incremental Dollar Opportunity, 2025-2035
  • Figure 13: Latin America Market Incremental Dollar Opportunity, 2025-2035
  • Figure 14: Western Europe Market Incremental Dollar Opportunity, 2025-2035
  • Figure 15: Eastern Europe Market Incremental Dollar Opportunity, 2025-2035
  • Figure 16: East Asia Market Incremental Dollar Opportunity, 2025-2035
  • Figure 17: South Asia and Pacific Market Incremental Dollar Opportunity, 2025-2035
  • Figure 18: Middle East & Africa Market Incremental Dollar Opportunity, 2025-2035
  • Figure 19: North America Market Value Share and BPS Analysis by Country, 2025 and 2035
  • Figure 20: North America Market Value Share and BPS Analysis by Classification , 2025 and 2035
  • Figure 21: North America Market Y-o-Y Growth Comparison by Classification , 2025-2035
  • Figure 22: North America Market Attractiveness Analysis by Classification
  • Figure 23: North America Market Value Share and BPS Analysis by Application, 2025 and 2035
  • Figure 24: North America Market Y-o-Y Growth Comparison by Application, 2025-2035
  • Figure 25: North America Market Attractiveness Analysis by Application
  • Figure 26: Latin America Market Value Share and BPS Analysis by Country, 2025 and 2035
  • Figure 27: Latin America Market Value Share and BPS Analysis by Classification , 2025 and 2035
  • Figure 28: Latin America Market Y-o-Y Growth Comparison by Classification , 2025-2035
  • Figure 29: Latin America Market Attractiveness Analysis by Classification
  • Figure 30: Latin America Market Value Share and BPS Analysis by Application, 2025 and 2035
  • Figure 31: Latin America Market Y-o-Y Growth Comparison by Application, 2025-2035
  • Figure 32: Latin America Market Attractiveness Analysis by Application
  • Figure 33: Western Europe Market Value Share and BPS Analysis by Country, 2025 and 2035
  • Figure 34: Western Europe Market Value Share and BPS Analysis by Classification , 2025 and 2035
  • Figure 35: Western Europe Market Y-o-Y Growth Comparison by Classification , 2025-2035
  • Figure 36: Western Europe Market Attractiveness Analysis by Classification
  • Figure 37: Western Europe Market Value Share and BPS Analysis by Application, 2025 and 2035
  • Figure 38: Western Europe Market Y-o-Y Growth Comparison by Application, 2025-2035
  • Figure 39: Western Europe Market Attractiveness Analysis by Application
  • Figure 40: Eastern Europe Market Value Share and BPS Analysis by Country, 2025 and 2035
  • Figure 41: Eastern Europe Market Value Share and BPS Analysis by Classification , 2025 and 2035
  • Figure 42: Eastern Europe Market Y-o-Y Growth Comparison by Classification , 2025-2035
  • Figure 43: Eastern Europe Market Attractiveness Analysis by Classification
  • Figure 44: Eastern Europe Market Value Share and BPS Analysis by Application, 2025 and 2035
  • Figure 45: Eastern Europe Market Y-o-Y Growth Comparison by Application, 2025-2035
  • Figure 46: Eastern Europe Market Attractiveness Analysis by Application
  • Figure 47: East Asia Market Value Share and BPS Analysis by Country, 2025 and 2035
  • Figure 48: East Asia Market Value Share and BPS Analysis by Classification , 2025 and 2035
  • Figure 49: East Asia Market Y-o-Y Growth Comparison by Classification , 2025-2035
  • Figure 50: East Asia Market Attractiveness Analysis by Classification
  • Figure 51: East Asia Market Value Share and BPS Analysis by Application, 2025 and 2035
  • Figure 52: East Asia Market Y-o-Y Growth Comparison by Application, 2025-2035
  • Figure 53: East Asia Market Attractiveness Analysis by Application
  • Figure 54: South Asia and Pacific Market Value Share and BPS Analysis by Country, 2025 and 2035
  • Figure 55: South Asia and Pacific Market Value Share and BPS Analysis by Classification , 2025 and 2035
  • Figure 56: South Asia and Pacific Market Y-o-Y Growth Comparison by Classification , 2025-2035
  • Figure 57: South Asia and Pacific Market Attractiveness Analysis by Classification
  • Figure 58: South Asia and Pacific Market Value Share and BPS Analysis by Application, 2025 and 2035
  • Figure 59: South Asia and Pacific Market Y-o-Y Growth Comparison by Application, 2025-2035
  • Figure 60: South Asia and Pacific Market Attractiveness Analysis by Application
  • Figure 61: Middle East & Africa Market Value Share and BPS Analysis by Country, 2025 and 2035
  • Figure 62: Middle East & Africa Market Value Share and BPS Analysis by Classification , 2025 and 2035
  • Figure 63: Middle East & Africa Market Y-o-Y Growth Comparison by Classification , 2025-2035
  • Figure 64: Middle East & Africa Market Attractiveness Analysis by Classification
  • Figure 65: Middle East & Africa Market Value Share and BPS Analysis by Application, 2025 and 2035
  • Figure 66: Middle East & Africa Market Y-o-Y Growth Comparison by Application, 2025-2035
  • Figure 67: Middle East & Africa Market Attractiveness Analysis by Application
  • Figure 68: Global Market - Tier Structure Analysis
  • Figure 69: Global Market - Company Share Analysis
Dashboard
Dashboard
Dashboard
Dashboard
Dashboard
Dashboard

Our Research Products

Full Research Suite

The "Full Research Suite" delivers actionable market intel, deep dives on markets or technologies, so clients act faster, cut risk, and unlock growth.

Competitor Leaderboard Report

The Leaderboard benchmarks and ranks top vendors, classifying them as Established Leaders, Leading Challengers, or Disruptors & Challengers.

Future Leaders Index

Locates where complements amplify value and substitutes erode it, forecasting net impact by horizon

Market Data & Forecasts

We deliver granular, decision-grade intel: market sizing, 5-year forecasts, pricing, adoption, usage, revenue, and operational KPIs—plus competitor tracking, regulation, and value chains—across 60 countries broadly.

Market Focus Report

Spot the shifts before they hit your P&L. We track inflection points, adoption curves, pricing moves, and ecosystem plays to show where demand is heading, why it is changing, and what to do next across high-growth markets and disruptive tech

Survey Report

Real-time reads of user behavior. We track shifting priorities, perceptions of today’s and next-gen services, and provider experience, then pace how fast tech moves from trial to adoption, blending buyer, consumer, and channel inputs with social signals (#WhySwitch, #UX).

Bespoke Reports

Partner with our analyst team to build a custom report designed around your business priorities. From analysing market trends to assessing competitors or crafting bespoke datasets, we tailor insights to your needs.

Supplier Intelligence

Discovery & Profiling

Capacity & Footprint

Performance & Risk

Compliance & Governance

Commercial Readiness

Who Supplies Whom

Scorecards & Shortlists

Playbooks & Docs

Category Intelligence

Definition & Scope

Demand & Use Cases

Cost Drivers

Market Structure

Supply Chain Map

Trade & Policy

Operating Norms

Deliverables

Buyer Intelligence

Account Basics

Spend & Scope

Procurement Model

Vendor Requirements

Terms & Policies

Entry Strategy

Pain Points & Triggers

Outputs

Pricing Analysis

Benchmarks

Trends

Should-Cost

Indexation

Landed Cost

Commercial Terms

Deliverables

Brand Analysis

Positioning & Value Prop

Share & Presence

Customer Evidence

Go-to-Market

Digital & Reputation

Compliance & Trust

KPIs & Gaps

Outputs

Full Research Suite comprises of:

Market outlook & trends analysis

Market outlook & trends analysis

Interviews & case studies

Interviews & case studies

Strategic recommendations

Strategic recommendations

Vendor profiles & capabilities analysis

Vendor profiles & capabilities analysis

5-year forecasts

5-year forecasts

8 regions and 60+ country-level data splits

8 regions and 60+ country-level data splits

Market segment data splits

Market segment data splits

12 months of continuous data updates

12 months of continuous data updates

DELIVERED AS:

PDF EXCEL ONLINE

Full Research Suite


$5000

$7500

$10000

Buy Report Now
Similar Industry Reports

Similar Industry Reports

Generator Sales Market

Generator Sales Market Size and Share Forecast Outlook 2025 to 2035

Generator Sets Market

Generator Sets Market Size and Share Forecast Outlook 2025 to 2035

Gas Generator Sets Market

Gas Generator Sets Market Growth - Trends & Forecast 2025 to 2035

Hydrogenerators Market

Hydrogenerators Market

Power Generator for Military Market

Power Generator for Military Market Size and Share Forecast Outlook 2025 to 2035

Motor Generator Set Market

Motor Generator Set Market Size, Growth, and Forecast 2025 to 2035

Pulse Generator Market

Pulse Generator Market

Ozone Generators Market

Ozone Generators Market

Hybrid Generator Sets Market

Hybrid Generator Sets Market Size and Share Forecast Outlook 2025 to 2035

Signal Generator Market

Signal Generator Market Analysis by Product, Technology, Application, End-use, and Region through 2035

Silent Generator Market

Silent Generator Market Analysis by Sound Level, Type, Phase, Power Rating, Fuel, Application, End User, and Region through 2035

Standby Generator Sets Market

Standby Generator Sets Market Size and Share Forecast Outlook 2025 to 2035

Telecom Generator Market

Telecom Generator Market Size and Share Forecast Outlook 2025 to 2035

Railway Generators Market

Railway Generators Market Growth - Trends & Forecast 2025 to 2035

Hydrogen Generator Market

Hydrogen Generator Market Size and Share Forecast Outlook 2025 to 2035

Surgical Generators Market

Surgical Generators Market – Trends & Forecast 2025 to 2035

Aircraft Generators Market

Aircraft Generators Market Trends and Forecast 2025 to 2035

Gasoline Generator Market

Gasoline Generator Market - Growth & Demand 2025 to 2035

PLL Clock Generator Market

PLL Clock Generator Market Size and Share Forecast Outlook 2025 to 2035

RF Plasma Generators Market

RF Plasma Generators Market

Future Market Insights

Generator Bushing Market

Chat With MaRIA

Chat With

MaRIA

Hi There, I am MaRIA, Your Market Research Intelligence Assistant. How may I help you?