Carbon-Dioxide Synthesis Cosmetics Market Size and Share Forecast Outlook 2025 to 2035

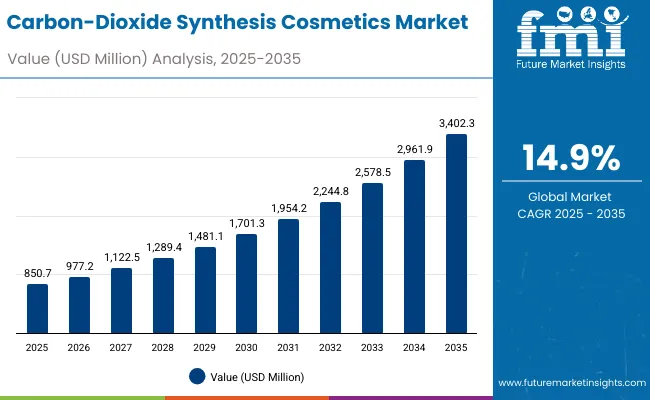
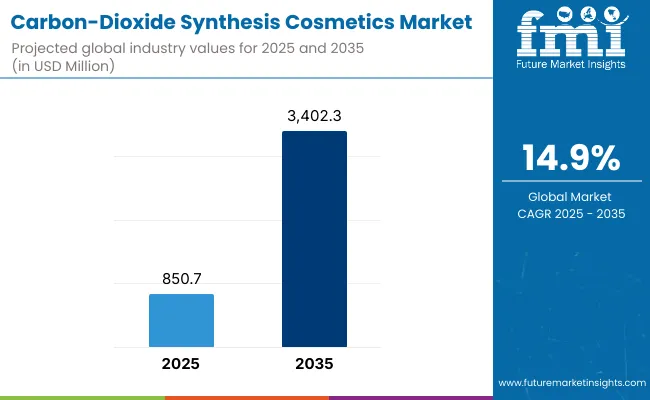
The Global Carbon-Dioxide Synthesis Cosmetics Market is expected to record a valuation of USD 850.7 million in 2025 and USD 3,402.3 million in 2035, with an increase of USD 2,551.6 million, which equals a growth of nearly 300% over the decade. The overall expansion represents a CAGR of 14.9% and a 4X increase in market size.
Carbon Dioxide Synthesis Cosmetics Market

Quick Stats for Global Carbon-Dioxide Synthesis Cosmetics Market

  • Global Carbon-Dioxide Synthesis Cosmetics Market Value (2025): USD 850.7 million
  • Global Carbon-Dioxide Synthesis Cosmetics Market Forecast Value (2035): USD 3,402.3 million
  • Global Carbon-Dioxide Synthesis Cosmetics Market Forecast CAGR: 14.9%
  • Leading Segment in Global Carbon-Dioxide Synthesis Cosmetics Market in 2025: Carbon-negative claims (53.4%)
  • Key Growth Regions in the Global Carbon-Dioxide Synthesis Cosmetics Market: China, India, Japan, USA, Germany, UK
  • Top Key Players in Global Carbon-Dioxide Synthesis Cosmetics Market: LanzaTech, BASF, Givaudan, Evonik, Clariant, Carbon Clean, Algatech, DSM-Firmenich, Croda, Symrise

Carbon Dioxide Synthesis Cosmetics Market Value Analysis

Global Carbon-Dioxide Synthesis Cosmetics Market Key Takeaways

Metric Value
Global Carbon-Dioxide Synthesis Cosmetics Market Estimated Value in (2025E) USD 850.7 million
Global Carbon-Dioxide Synthesis Cosmetics Market Forecast Value in (2035F) USD 3,402.3 million
Forecast CAGR (2025 to 2035) 14.9%

During the first five-year period from 2025 to 2030, the market increases from USD 850.7 million to USD 1,701.3 million, adding USD 850.6 million, which accounts for around one-third of the total decade growth. This phase records steady adoption in sustainable skincare innovations, driven by consumer preference for carbon-negative claims, eco-certified sourcing, and bio-actives developed using CO₂-capture technologies.

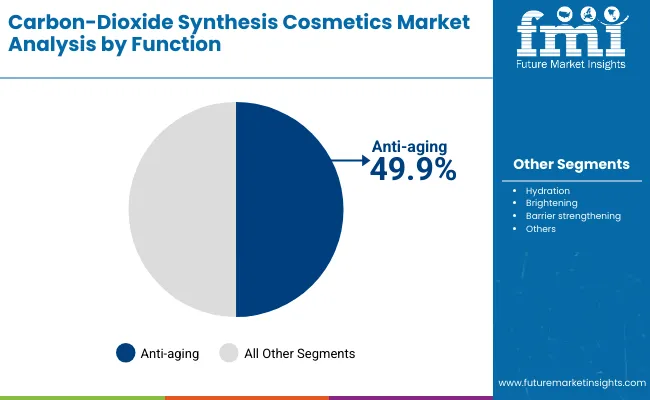
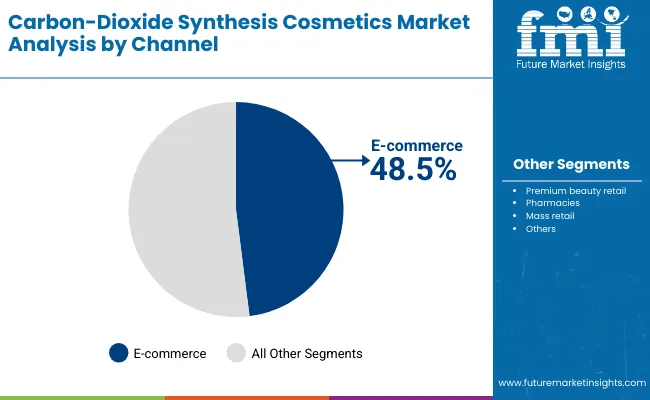
E-commerce dominates distribution during this period, contributing 48.5% of sales in 2025, as digital-native beauty shoppers accelerate adoption of green cosmetic products with transparent claims. Anti-aging emerges as the core function, holding a 49.9% value share in 2025, reflecting the rising influence of climate-conscious aging consumers.

The second half from 2030 to 2035 contributes USD 1,701.0 million, equal to 67% of total growth, as the market jumps from USD 1,701.3 million to USD 3,402.3 million. This acceleration is powered by widespread deployment of CO₂-based bio-synthesis platforms, large-scale algae fixation facilities, and advanced synthetic CO₂ compounds integrated into serums and creams.

By 2035, mid-market and premium segments converge as carbon-negative and vegan claims become industry standards, while advanced retail ecosystems push premium beauty retail beyond its current share. Software-like enablers, including digital traceability and blockchain certification platforms, play a role in maintaining eco-claims authenticity, strengthening consumer trust, and unlocking recurring brand loyalty.

From 2020 to 2024, the Global Carbon-Dioxide Synthesis Cosmetics Market expanded from niche-scale pilot projects to early-stage commercialization, with global revenues increasing steadily as sustainability-driven consumers sought alternatives to petrochemical-based cosmetics.

During this period, the competitive landscape was dominated by European and USA-based players with strong sustainability credentials, including BASF, Symrise, and Croda, which controlled over 60% of the market through investments in green chemistry, synthetic biology, and algae fixation platforms.

Carbon-negative claims became a core differentiator, enabling early entrants to command premium price points and capture mindshare among eco-conscious consumers. Service-based models were negligible, and adoption was concentrated in select premium beauty and e-commerce channels.

Demand for carbon-dioxide synthesis cosmetics expands significantly in 2025 to USD 850.7 million, and the revenue mix begins to shift as e-commerce consolidates its dominance and premium beauty retailers increasingly stock CO₂-based innovations. Traditional cosmetic giants such as BASF and Evonik face competition from biotech disruptors like LanzaTech and Algatech, which are leveraging CO₂ capture and algae fixation to create new bio-active ingredients.

Digital-first brands emphasize clean-label and eco-certification, often verified through blockchain-backed traceability systems. Competitive advantage in this market is shifting from product-level innovation to ecosystem integration, where sustainability claims, carbon-negative certifications, and circular value chains provide both growth momentum and resilience.

Why the Global Carbon-Dioxide Synthesis Cosmetics Market is growing?

Advances in carbon capture, synthetic biology, and algae fixation technologies have transformed the ability of cosmetics companies to develop bio-actives and oils using CO₂ as a feedstock. This shift has improved ingredient sustainability while enabling performance on par with, or exceeding, traditional petrochemical and plant-based alternatives.

Anti-aging products, supported by CO₂-based peptides and antioxidants, have gained early traction as consumers demand both efficacy and climate responsibility. E-commerce has amplified market penetration by providing global visibility to carbon-negative and eco-certified brands.

The growth of clean-label and vegan claims has also fueled demand. Consumers increasingly expect beauty products to align with climate-conscious lifestyles, and brands are integrating CO₂-based compounds to meet this requirement. Innovations in CO₂-extracted oils and fixation-derived extracts are expanding their use beyond serums into creams, lotions, and barrier-strengthening masks. Moreover, regulatory incentives in Europe and Asia-Pacific are encouraging large-scale investment into circular cosmetic ingredient production, which enhances market adoption.

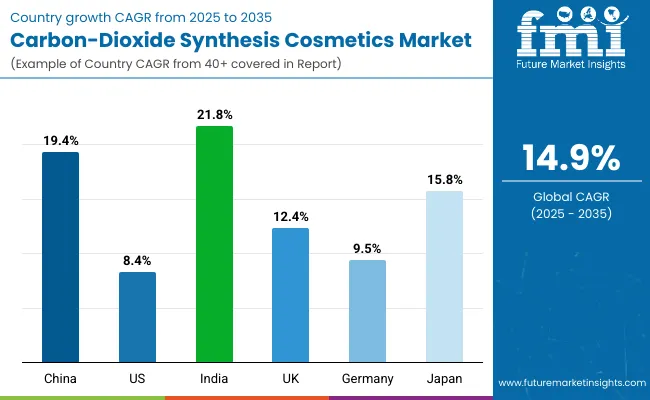
Segment growth is expected to be led by carbon-negative claims, anti-aging functions, and e-commerce channels, supported by strong CAGR in emerging regions such as India (21.8%) and China (19.4%). While the USA and Germany provide stability through established retail infrastructure, Asia-Pacific countries are driving incremental growth by embracing new green chemistry technologies. Overall, the market is growing because it addresses two converging consumer needs: visible skin benefits and measurable sustainability outcomes.

Segmental Analysis

The Global Carbon-Dioxide Synthesis Cosmetics Market is segmented by source technology, function, product type, channel, and claim. Source technologies include CO₂-captured bio-actives, algae fixation extracts, synthetic CO₂-based compounds, and CO₂-extracted oils, highlighting the breadth of sustainable innovation driving adoption.

Function segmentation covers hydration, anti-aging, brightening, and barrier strengthening, reflecting the core areas where eco-active performance is most valued. Product types include serums, creams/lotions, masks, and oils, offering multiple applications that blend mainstream cosmetic formats with sustainability-driven differentiation.

Channel segmentation spans e-commerce, premium beauty retail, pharmacies, and mass retail, indicating the diverse pathways through which consumers access these products. Claims are classified into carbon-negative, eco-certified, clean-label, and vegan, with carbon-negative dominating early adoption due to strong consumer resonance. Regionally, the scope spans North America, Latin America, Europe, Asia-Pacific, and the Middle East & Africa, with country-level analysis highlighting China, India, Japan, USA, Germany, and UK as high-priority growth markets.
Insights into the Claim Segment with Carbon-negative Leading in Market Share

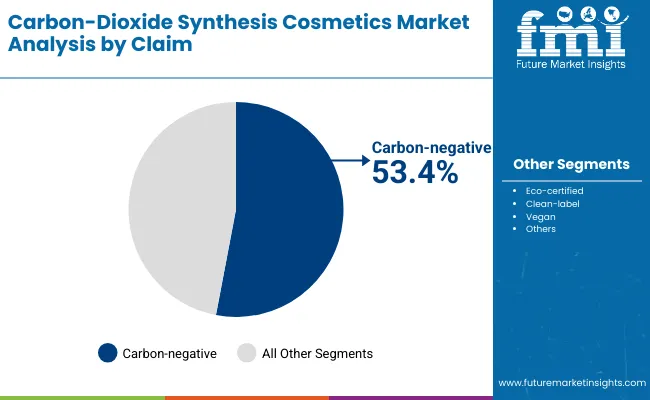
Carbon Dioxide Synthesis Cosmetics Market By Claim

Claim Value Share % 2025
Carbon-negative 53.4%
Others 46.6%

The carbon-negative segment is projected to contribute 53.4% of the Global Carbon-Dioxide Synthesis Cosmetics Market revenue in 2025, maintaining its lead as the dominant claim category. This growth is driven by rising consumer awareness around climate change, and the preference for products that actively reduce or offset carbon emissions. Beauty shoppers increasingly demand measurable sustainability outcomes, and carbon-negative certification offers a transparent and powerful differentiator.

The segment’s strength is further supported by growing investments from global cosmetics leaders and biotech innovators in carbon capture and utilization pathways. Brands are incorporating CO₂-derived peptides, oils, and extracts to substantiate their claims. As regulatory frameworks evolve in Europe and Asia-Pacific to reward low-carbon products, carbon-negative cosmetics are expected to remain the backbone of this market, reshaping competitive positioning and creating new consumer loyalty models.
Insights into the Function Segment with Anti-aging Dominating the Demand

Carbon Dioxide Synthesis Cosmetics Market By Function

Function Value Share % 2025
Anti-aging 49.9%
Others 50.1%

The anti-aging segment is forecasted to hold 49.9% of the Global Carbon-Dioxide Synthesis Cosmetics Market share in 2025, led by its application in serums, creams, and oils designed for mature skin. This dominance is explained by consumer willingness to invest in high-efficacy, premium-priced solutions that combine visible results with climate-conscious values. Anti-aging products are also the most adaptable format for integrating CO₂-based bio-actives, such as antioxidants, peptides, and barrier-strengthening compounds.

Their appeal extends beyond traditional anti-wrinkle care to holistic skin health, including hydration, brightening, and protection from environmental stressors. The segment’s growth is further bolstered by the Asian markets, particularly China, Japan, and India, where anti-aging rituals are deeply embedded in cultural beauty practices. With the addition of CO₂-derived bio-synthesis ingredients, anti-aging products provide both performance and eco-conscious assurance, securing their dominance through 2035.
Insights into the Channel Segment with E-commerce Driving Market Expansion

Carbon Dioxide Synthesis Cosmetics Market By Channel

Channel Value Share % 2025
E-commerce 48.5%
Others 51.5%

The e-commerce segment is projected to account for 48.5% of the Global Carbon-Dioxide Synthesis Cosmetics Market revenue in 2025, establishing itself as a critical distribution channel. Online platforms have become the preferred space for consumers to discover, evaluate, and purchase eco-certified, clean-label, and carbon-negative cosmetics. Transparency tools such as digital certifications, blockchain-tracked sourcing, and AI-powered product recommendations amplify the visibility of CO₂-derived innovations.

The segment’s momentum is further supported by the rise of direct-to-consumer brands and subscription models, enabling startups and biotech-backed cosmetic innovators to bypass traditional retail constraints. Social media and digital storytelling reinforce the credibility of eco-claims, while partnerships with major e-commerce platforms enhance global reach. By 2035, e-commerce is expected to dominate even further, cementing its role as the driver of adoption for carbon-negative and vegan beauty products.

What are the Drivers, Restraints, and Key Trends of the Global Carbon-Dioxide Synthesis Cosmetics Market?

Drivers

Rising Adoption of Carbon-Negative and Eco-Certified Claims

One of the strongest growth drivers is the rising adoption of carbon-negative claims, which already account for 53.4% of the global market in 2025. Unlike conventional sustainability labels, carbon-negative directly appeals to consumers who want tangible climate impact attached to their purchase. This trend is not only consumer-driven but also supported by global retailers and regulators that increasingly demand measurable sustainability credentials.

Large beauty groups such as BASF, Evonik, and Croda are investing in CO₂-captured bio-actives and synthetic CO₂-based compounds precisely to validate such claims. As eco-certified and clean-label products expand their visibility on e-commerce platforms, brands offering carbon-negative credentials enjoy premium positioning and price resilience, reinforcing this as a primary growth engine for the decade.

Biotechnology Integration in Anti-aging Formulations

Anti-aging, holding a 49.9% market share in 2025, is being transformed by the integration of CO₂-derived peptides, antioxidants, and algae fixation extracts. Unlike traditional formulations, these biotech-enabled ingredients provide a dual benefit: visible skin improvements and environmental responsibility. Consumers in China, Japan, and India-markets with double-digit CAGRs-are particularly receptive to anti-aging routines tied to eco-conscious values.

For instance, CO₂-extracted oils are being used in high-performance serums to reinforce skin barriers while maintaining vegan and clean-label positioning. The ability of biotechnology to merge efficacy with sustainability is creating an entirely new premium tier within anti-aging, making it one of the most critical growth drivers.

Restraints

High Production Costs of CO₂-Based Compounds

Despite strong consumer pull, the production of CO₂-based bio-actives, fixation extracts, and synthetic compounds remains significantly cost-intensive compared to conventional petrochemical or botanical ingredients. Carbon capture infrastructure, algae cultivation systems, and specialized reactors for CO₂ conversion require large upfront capital investment.

Smaller beauty brands, especially in mass retail channels, struggle to absorb these costs, limiting adoption outside premium and niche categories. This cost barrier is particularly evident in developing markets, where consumers remain price-sensitive despite growing environmental awareness.

Regulatory Ambiguity in Eco-Claims

While carbon-negative and eco-certified claims drive growth, regulatory frameworks for CO₂-derived cosmetics are not yet harmonized globally. For example, Europe has strong incentives and recognition mechanisms for carbon accounting, while the USA and several Asia-Pacific markets lack standardized certification protocols.

This inconsistency exposes brands to risks of greenwashing accusations, consumer mistrust, and compliance challenges. Companies investing heavily in traceability systems face uneven ROI across regions, and delays in regulatory clarity may slow market momentum, particularly in mass retail and pharmacy distribution channels.

Key Trends

Blockchain and Digital Traceability for Eco-Claims

A major trend reshaping the market is the integration of digital traceability systems-including blockchain and AI-based certification platforms-into the cosmetics supply chain. As carbon-negative and vegan claims gain traction, consumers demand proof of authenticity.

Brands are adopting end-to-end transparency tools that verify CO₂ capture, algae cultivation, and extraction methods. For example, digital QR codes embedded in packaging allow buyers to track the carbon savings and origin of each serum or cream. This not only strengthens consumer trust but also helps companies defend their claims in markets with tightening regulatory scrutiny.

Expansion of E-commerce as the Testing Ground for Green Innovation

With e-commerce already capturing 48.5% of market sales in 2025, it is emerging as the primary testing ground for carbon-negative innovations. Startups and biotech-backed brands bypass traditional premium retail by launching directly online with eco-certified products. Digital-native consumers, particularly millennials and Gen Z, use online platforms to discover, compare, and validate claims such as clean-label and vegan.

Subscription models are gaining popularity, where consumers commit to recurring deliveries of CO₂-derived serums or masks, reinforcing both loyalty and recurring revenues. This trend positions e-commerce not just as a channel, but as an innovation incubator where carbon-dioxide synthesis cosmetics can rapidly scale before moving into pharmacies and mass retail.
Analysis of Global Carbon-Dioxide Synthesis Cosmetics Market By Key Countries

Carbon Dioxide Synthesis Cosmetics Market Country Wise Analysis

Country Estimated CAGR (2025 to 2035)
China 19.4%
USA 8.4%
India 21.8%
UK 12.4%
Germany 9.5%
Japan 15.8%

The country-wise CAGR outlook highlights a clear divergence in growth momentum for the Global Carbon-Dioxide Synthesis Cosmetics Market between emerging and mature markets. India (21.8%) and China (19.4%) are forecasted to lead global expansion, driven by rapid adoption of eco-certified, vegan, and carbon-negative skincare products. Rising disposable incomes, urbanization, and a younger consumer base prioritizing sustainability are fueling demand for CO₂-derived serums, creams, and oils.

China, in particular, benefits from strong government incentives around carbon neutrality, while India’s expanding middle-class consumer segment is adopting clean-label beauty faster than previous generations. Japan (15.8%) also demonstrates strong growth, where innovation in algae fixation and anti-aging rituals intersects with cultural preferences for advanced skincare, making it a high-value innovation hub.

In contrast, developed Western markets such as the USA (8.4%), Germany (9.5%), and the UK (12.4%) are expected to record more moderate but stable growth. These markets are already advanced in terms of premium beauty adoption, but their expansion is constrained by higher market saturation and slower regulatory adoption of carbon-negative frameworks.

Nevertheless, consumer pressure for transparency, combined with the strong presence of established players like BASF, Symrise, and Croda, sustains steady demand. The USA is also witnessing significant online traction, with e-commerce platforms enabling niche carbon-dioxide synthesis cosmetic brands to find dedicated consumer bases.

Overall, while developed regions provide stability and premium validation, the high double-digit CAGR in Asia-Pacific is set to drive the majority of incremental growth for this market over the forecast period.
Sales Outlook for Carbon-Dioxide Synthesis Cosmetics in the United States

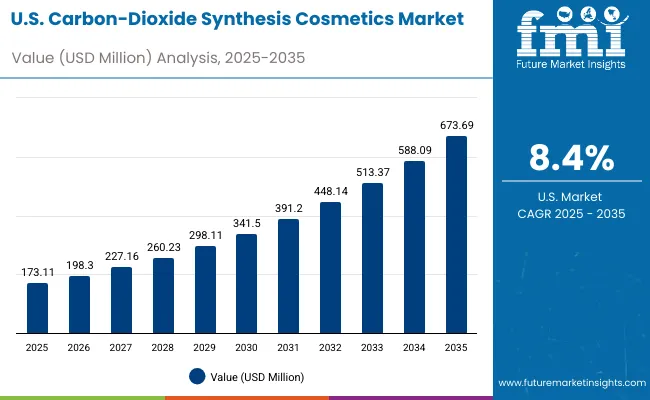
Usa Carbon Dioxide Synthesis Cosmetics Market

Year USA Market (USD Million)
2025 173.11
2026 198.30
2027 227.16
2028 260.23
2029 298.11
2030 341.50
2031 391.20
2032 448.14
2033 513.37
2034 588.09
2035 673.69

The Global Carbon-Dioxide Synthesis Cosmetics Market in the United States is projected to grow at a CAGR of 8.4%, led by increased consumer adoption of carbon-negative and clean-label claims. Premium beauty retail and e-commerce are driving early adoption, particularly among millennial and Gen Z consumers who demand transparency and measurable eco-impact.

Anti-aging remains the top functional driver, with serums and creams integrating CO₂-derived peptides and oils to meet rising demand for performance-based sustainability. Pharmaceutical and dermatology-backed cosmetic brands are also experimenting with CO₂-based actives in barrier-strengthening formulations. Strategic partnerships with eco-certification bodies and supply chain traceability providers are reinforcing brand credibility.

  • Carbon-negative products account for 54.7% of USA sales in 2025, equivalent to USD 94.6 million.
  • E-commerce continues to expand as the dominant distribution channel, providing visibility for clean-label brands.
  • Anti-aging innovations with CO₂-derived peptides are shaping consumer loyalty in premium beauty categories.

Growth and Expansion Outlook for Carbon-Dioxide Synthesis Cosmetics in the United Kingdom

The Global Carbon-Dioxide Synthesis Cosmetics Market in the United Kingdom is expected to grow at a CAGR of 12.4%, supported by consumer demand for eco-certified and vegan cosmetic products. The UK market benefits from strong regulatory support, with carbon and sustainability labeling increasingly emphasized across the cosmetics industry. Premium retail chains and pharmacies are expanding their CO₂-based product portfolios, while e-commerce provides broader accessibility to clean-label brands.

Anti-aging and hydration functions dominate, particularly in serums and creams that highlight eco-certified sourcing. Heritage-driven beauty brands in the UK are repositioning themselves with sustainability at the core of their narratives, blending tradition with cutting-edge CO₂-derived innovations.

  • Premium beauty retailers are expanding CO₂-based skincare assortments with vegan positioning.
  • Eco-certified and carbon-negative labels are reinforcing trust among UK consumers.
  • Anti-aging and hydration claims are driving mid- to premium-market adoption.

Growth and Expansion Outlook for Carbon-Dioxide Synthesis Cosmetics in India

India is witnessing rapid growth in the Global Carbon-Dioxide Synthesis Cosmetics Market, which is forecast to expand at a CAGR of 21.8% through 2035 - the highest among major markets. Rising awareness among urban consumers and growing disposable incomes are fueling demand for eco-certified, vegan, and carbon-negative beauty products.

Tier-2 cities are seeing accelerated adoption as local retailers and e-commerce platforms introduce affordable CO₂-derived creams, serums, and oils. Anti-aging and brightening claims resonate strongly in India, with cultural preferences favoring multifunctional products. Local startups are partnering with global biotech suppliers to integrate algae fixation extracts and CO₂-extracted oils into clean-label cosmetic launches.
  • Affordable CO₂-based serums are expanding into tier-2 city retail ecosystems.
  • Brightening and anti-aging claims are driving the strongest consumer demand.
  • Domestic brands are partnering with global players for technology and ingredient access.

Sales Outlook for Carbon-Dioxide Synthesis Cosmetics in China

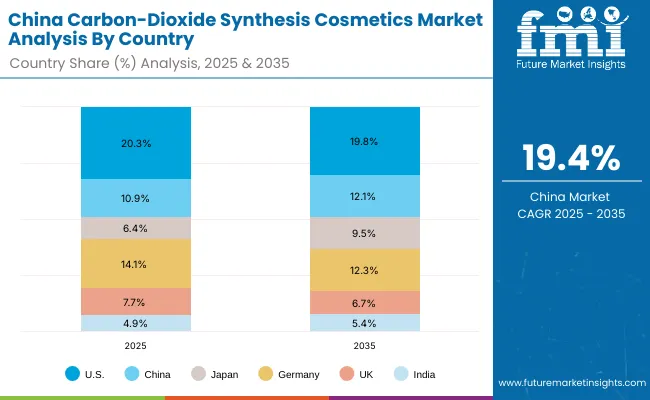
China Carbon Dioxide Synthesis Cosmetics Market By Country

The Global Carbon-Dioxide Synthesis Cosmetics Market in China is expected to grow at a CAGR of 19.4%, among the highest globally. China’s momentum is fueled by anti-aging and hydration functions, with a strong preference for serums and creams incorporating CO₂-captured bio-actives. Government-driven sustainability targets and consumer eco-consciousness are accelerating adoption of carbon-negative and eco-certified products.

Domestic cosmetic leaders are integrating CO₂-extracted oils into mainstream beauty lines, while cross-border e-commerce introduces premium eco-certified products from Europe. Young, urban consumers increasingly use digital platforms to validate eco-claims, making traceability and blockchain verification critical in brand strategies.

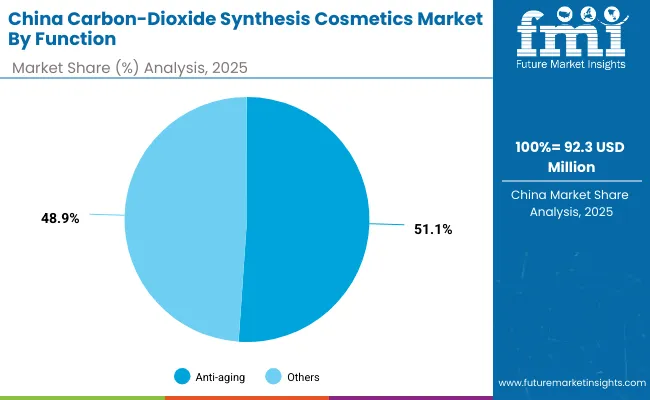
  • Anti-aging accounts for 51.1% of China’s functional share in 2025, equivalent to USD 47.2 million.
  • Domestic brands are scaling algae fixation extracts to compete with global multinationals.
  • Cross-border e-commerce channels accelerate premium carbon-negative adoption in urban centers.
Country 2025 Share (%)
USA 20.3%
China 10.9%
Japan 6.4%
Germany 14.1%
UK 7.7%
India 4.9%
Country 2035 Share (%)
USA 19.8%
China 12.1%
Japan 9.5%
Germany 12.3%
UK 6.7%
India 5.4%

Growth Outlook for Carbon-Dioxide Synthesis Cosmetics Market in the USA

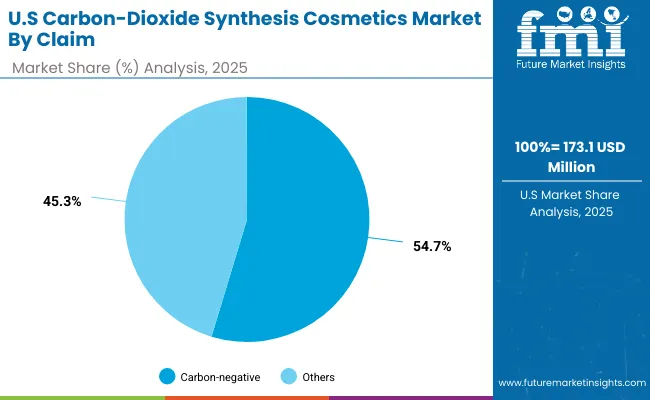
Usa Carbon Dioxide Synthesis Cosmetics Market By Claim

USA by Claim Value Share % 2025
Carbon-negative 54.7%
Others 45.3%

The Global Carbon-Dioxide Synthesis Cosmetics Market in the United States is projected at USD 173.1 million in 2025. Carbon-negative contributes 54.7%, while other claims hold 45.3%, showing a strong consumer inclination toward sustainability-driven formulations. The dominance of carbon-negative products stems from USA consumers’ demand for measurable eco-impact alongside product performance. Premium retailers and e-commerce channels are reinforcing this preference by highlighting transparency, certifications, and traceable sourcing.

A key catalyst for growth in the USA is the rising influence of dermatology-backed cosmetic solutions and barrier-strengthening serums developed using CO₂-derived oils and peptides. With digital-native consumers demanding authenticity, blockchain-backed traceability and eco-label validation are becoming mandatory in brand strategies. By 2035, this trend is expected to consolidate the USA as a stable but steadily expanding market, driven by premium adoption and ecosystem trust.
  • Market size for USA is USD 173.1 million in 2025.
  • Carbon-negative claims lead at 54.7% vs 45.3%.
  • Growth supported by premium beauty retail and regulatory alignment with eco-labels.

Opportunity Analysis of China Carbon-Dioxide Synthesis Cosmetics Market

China Carbon Dioxide Synthesis Cosmetics Market By Function

China by Function Value Share % 2025
Anti-aging 51.1%
Others 48.9%

The Global Carbon-Dioxide Synthesis Cosmetics Market in China is valued at USD 92.3 million in 2025, with anti-aging leading at 51.1%, followed by other functions at 48.9%. The dominance of anti-aging reflects China’s demographic structure and cultural emphasis on skincare routines that prioritize longevity and skin health. Anti-aging serums and creams incorporating CO₂-captured bio-actives and algae fixation extracts are particularly favored among urban middle-class and premium consumers.

China’s momentum is reinforced by government carbon neutrality initiatives, which create an enabling environment for companies to scale carbon-negative and eco-certified formulations. Domestic beauty brands are leveraging CO₂-extracted oils to compete with multinational giants, while cross-border e-commerce introduces European eco-certified offerings. As consumer sophistication increases, digital verification of eco-claims through apps and QR code systems is becoming central to trust-building in the Chinese market.
  • Market size for China in 2025 is USD 92.3 million.
  • Global market share is approximately 10.9% in 2025, projected to rise to 12.1% by 2035.
  • Anti-aging leads at 51.1%, driven by cultural skincare practices and urban adoption.

Competitive Landscape of Carbon-Dioxide Synthesis Cosmetics Market

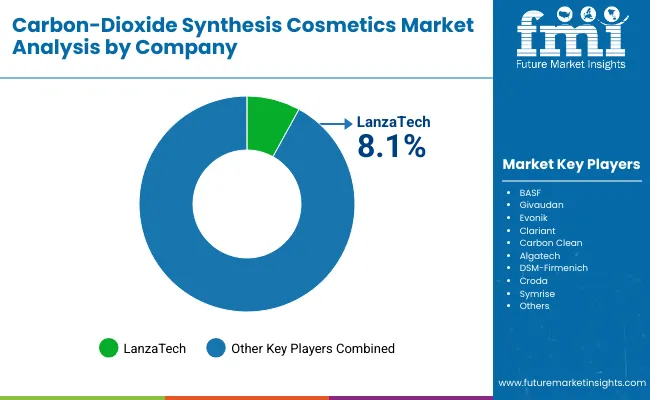
Carbon Dioxide Synthesis Cosmetics Market By Company

Company Global Value Share 2025
LanzaTech 8.1%
Others 91.9%

The Global Carbon-Dioxide Synthesis Cosmetics Market is moderately fragmented, with global chemical majors, biotech innovators, and specialty ingredient providers competing across diverse product categories. LanzaTech, holding 8.1% of global share in 2025, leads with its pioneering carbon capture technology, converting CO₂ emissions into bio-active ingredients now used in serums and creams. This early-mover advantage positions it as a benchmark for carbon-negative product innovation.

Large multinational players such as BASF, Evonik, Clariant, DSM-Firmenich, Croda, and Symrise are driving scale by integrating CO₂-derived compounds into their broader cosmetics ingredient portfolios. Their strategies emphasize advanced research in synthetic CO₂-based compounds and algae fixation extracts, often backed by collaborations with biotech startups. These firms leverage established distribution and brand partnerships to quickly scale carbon-negative formulations in both premium and mass markets.

Niche innovators such as Carbon Clean and Algatech focus on specialization-Carbon Clean in industrial-scale CO₂ capture adapted for cosmetic ingredients, and Algatech in algae fixation extracts for anti-aging and hydration formulations. Their regional adaptability and deep R&D pipelines make them critical disruptors despite smaller global scale.

Competitive differentiation is shifting away from traditional cosmetic claims toward integrated sustainability ecosystems. Companies are competing not just on ingredient efficacy but also on lifecycle carbon accounting, eco-certifications, blockchain traceability, and recurring partnerships with digital-first brands. This transition underscores that future leadership will depend less on raw ingredient innovation alone, and more on the ability to combine science, certification, and transparency into scalable consumer-facing solutions.

Key Developments in Global Carbon-Dioxide Synthesis Cosmetics Market

  • On September 2, 2025, LanzaTech, Mibelle Group, and Fraunhofer IGB unveiled a CO₂-based sustainable fat ingredient that can act as a replacement for palm oil in cosmetics and everyday products. This novel ingredient comes from biotechnological processes using CO₂ recycling and aims to replicate the functional & physical properties of palm oil (heat resistance, shelf life, etc.) without relying on oil crops and deforestation.
  • On ~April 2025, Evonik introduced a new segment called Botanicals & Natural Actives, consolidating its capabilities in botanical extracts, natural actives, and claim-substantiated ingredients. This move was backed by recent acquisitions (such as Novachem) and is aimed at meeting rising consumer demand for eco-friendly, clean-label, and high-performance actives.

Scope of the Report

Item Value
Quantitative Units USD 850.7 Million
Source Technology CO₂-captured bio-actives, Algae CO₂ fixation extracts, Synthetic CO₂-based compounds, CO₂-extracted oils
Function Hydration, Anti-aging, Brightening, Barrier strengthening
Product Type Serums, Creams/lotions, Masks, Oils
Channel E-commerce, Premium beauty retail, Pharmacies, Mass retail
Claim Carbon-negative, Eco-certified, Clean-label, Vegan
Regions Covered North America, Europe, Asia-Pacific, Latin America, Middle East & Africa
Country Covered United States, Canada, Germany, France, United Kingdom, China, Japan, India, Brazil, South Africa
Key Companies Profiled LanzaTech , BASF, Givaudan , Evonik , Clariant , Carbon Clean, Algatech , DSM- Firmenich , Croda , Symrise
Additional Attributes Dollar sales by function and channel, growth of carbon-negative and eco-certified claims, rising adoption of CO₂-derived bio-actives in anti-aging and hydration products, sector-specific traction in e-commerce and premium retail, expansion of vegan and clean-label positioning, integration of blockchain and digital traceability for eco-claims, regional trends influenced by climate-neutrality initiatives, and innovations in algae fixation and CO₂-extracted oils.

Key Segments

By Source Technology:

  • CO₂-captured bio-actives
  • Algae CO₂ fixation extracts
  • Synthetic CO₂-based compounds
  • CO₂-extracted oils

By Function:

  • Hydration
  • Anti-aging
  • Brightening
  • Barrier strengthening

By Product Type:

  • Serums
  • Creams/lotions
  • Masks
  • Oils

By Channel:

  • E-commerce
  • Premium beauty retail
  • Pharmacies
  • Mass retail

By Claim:

  • Carbon-negative
  • Eco-certified
  • Clean-label
  • Vegan

By Region:

  • North America
  • Latin America
  • Europe
  • East Asia
  • South Asia & Pacific
  • Middle East and Africa

Table of Content

  1. Executive Summary
    • Global Market Outlook
    • Demand-side Trends
    • Supply-side Trends
    • Technology Roadmap Analysis
    • Analysis and Recommendations
  2. Market Overview
    • Market Coverage / Taxonomy
    • Market Definition / Scope / Limitations
  3. Market Background
    • Market Dynamics
      • Drivers
      • Restraints
      • Opportunity
      • Trends
    • Scenario Forecast
      • Demand in Optimistic Scenario
      • Demand in Likely Scenario
      • Demand in Conservative Scenario
    • Opportunity Map Analysis
    • Product Life Cycle Analysis
    • Supply Chain Analysis
    • Investment Feasibility Matrix
    • Value Chain Analysis
    • PESTLE and Porter’s Analysis
    • Regulatory Landscape
    • Regional Parent Market Outlook
    • Production and Consumption Statistics
    • Import and Export Statistics
  4. Global Analysis 2020 to 2024 and Forecast, 2025 to 2035
    • Historical Market Size Value (USD Million) Analysis, 2020 to 2024
    • Current and Future Market Size Value (USD Million) Projections, 2025 to 2035
      • Y-o-Y Growth Trend Analysis
      • Absolute $ Opportunity Analysis
  5. Global Pricing Analysis 2020 to 2024 and Forecast 2025 to 2035
  6. Global Analysis 2020 to 2024 and Forecast 2025 to 2035, By Source Technology
    • Introduction / Key Findings
    • Historical Market Size Value (USD Million) Analysis By Source Technology, 2020 to 2024
    • Current and Future Market Size Value (USD Million) Analysis and Forecast By Source Technology, 2025 to 2035
      • CO₂-captured bio-actives
      • Algae CO₂ fixation extracts
      • Synthetic CO₂-based compounds
      • CO₂-extracted oils
    • Y-o-Y Growth Trend Analysis By Source Technology, 2020 to 2024
    • Absolute $ Opportunity Analysis By Source Technology, 2025 to 2035
  7. Global Analysis 2020 to 2024 and Forecast 2025 to 2035, By Function
    • Introduction / Key Findings
    • Historical Market Size Value (USD Million) Analysis By Function, 2020 to 2024
    • Current and Future Market Size Value (USD Million) Analysis and Forecast By Function, 2025 to 2035
      • Hydration
      • Anti-aging
      • Brightening
      • Barrier strengthening
    • Y-o-Y Growth Trend Analysis By Function, 2020 to 2024
    • Absolute $ Opportunity Analysis By Function, 2025 to 2035
  8. Global Analysis 2020 to 2024 and Forecast 2025 to 2035, By Product Type
    • Introduction / Key Findings
    • Historical Market Size Value (USD Million) Analysis By Product Type, 2020 to 2024
    • Current and Future Market Size Value (USD Million) Analysis and Forecast By Product Type, 2025 to 2035
      • Serums
      • Creams/lotions
      • Masks
      • Oils
    • Y-o-Y Growth Trend Analysis By Product Type, 2020 to 2024
    • Absolute $ Opportunity Analysis By Product Type, 2025 to 2035
  9. Global Analysis 2020 to 2024 and Forecast 2025 to 2035, By Channel
    • Introduction / Key Findings
    • Historical Market Size Value (USD Million) Analysis By Channel, 2020 to 2024
    • Current and Future Market Size Value (USD Million) Analysis and Forecast By Channel, 2025 to 2035
      • E-commerce
      • Premium beauty retail
      • Pharmacies
      • Mass retail
    • Y-o-Y Growth Trend Analysis By Channel, 2020 to 2024
    • Absolute $ Opportunity Analysis By Channel, 2025 to 2035
  10. Global Analysis 2020 to 2024 and Forecast 2025 to 2035, By Claim
    • Introduction / Key Findings
    • Historical Market Size Value (USD Million) Analysis By Claim, 2020 to 2024
    • Current and Future Market Size Value (USD Million) Analysis and Forecast By Claim, 2025 to 2035
      • Carbon-negative
      • Eco-certified
      • Clean-label
      • Vegan
    • Y-o-Y Growth Trend Analysis By Claim, 2020 to 2024
    • Absolute $ Opportunity Analysis By Claim, 2025 to 2035
  11. Global Analysis 2020 to 2024 and Forecast 2025 to 2035, By Region
    • Introduction
    • Historical Market Size Value (USD Million) Analysis By Region, 2020 to 2024
    • Current Market Size Value (USD Million) Analysis and Forecast By Region, 2025 to 2035
      • North America
      • Latin America
      • Europe
      • East Asia
      • South Asia & Pacific
      • Middle East and Africa
    • Market Attractiveness Analysis By Region
  12. North America Analysis 2020 to 2024 and Forecast 2025 to 2035, By Country
    • Historical Market Size Value (USD Million) Trend Analysis By Market Taxonomy, 2020 to 2024
    • Market Size Value (USD Million) Forecast By Market Taxonomy, 2025 to 2035
      • By Country
        • USA
        • Canada
      • By Source Technology
      • By Function
      • By Product Type
      • By Channel
      • By Claim
    • Market Attractiveness Analysis
      • By Country
      • By Source Technology
      • By Function
      • By Product Type
      • By Channel
      • By Claim
    • Key Takeaways
  13. Latin America Analysis 2020 to 2024 and Forecast 2025 to 2035, By Country
    • Historical Market Size Value (USD Million) Trend Analysis By Market Taxonomy, 2020 to 2024
    • Market Size Value (USD Million) Forecast By Market Taxonomy, 2025 to 2035
      • By Country
        • Brazil
        • Mexico
        • Colombia
        • Rest of Latin America
      • By Source Technology
      • By Function
      • By Product Type
      • By Channel
      • By Claim
    • Market Attractiveness Analysis
      • By Country
      • By Source Technology
      • By Function
      • By Product Type
      • By Channel
      • By Claim
    • Key Takeaways
  14. Europe Analysis 2020 to 2024 and Forecast 2025 to 2035, By Country
    • Historical Market Size Value (USD Million) Trend Analysis By Market Taxonomy, 2020 to 2024
    • Market Size Value (USD Million) Forecast By Market Taxonomy, 2025 to 2035
      • By Country
        • Germany
        • UK
        • France
        • Italy
        • Spain
        • Belgium
        • Netherlands
        • Nordic
        • Switzerland
        • Russia
        • Poland
        • Rest of Europe
      • By Source Technology
      • By Function
      • By Product Type
      • By Channel
      • By Claim
    • Market Attractiveness Analysis
      • By Country
      • By Source Technology
      • By Function
      • By Product Type
      • By Channel
      • By Claim
    • Key Takeaways
  15. East Asia Analysis 2020 to 2024 and Forecast 2025 to 2035, By Country
    • Historical Market Size Value (USD Million) Trend Analysis By Market Taxonomy, 2020 to 2024
    • Market Size Value (USD Million) Forecast By Market Taxonomy, 2025 to 2035
      • By Country
        • China
        • Japan
        • South Korea
      • By Source Technology
      • By Function
      • By Product Type
      • By Channel
      • By Claim
    • Market Attractiveness Analysis
      • By Country
      • By Source Technology
      • By Function
      • By Product Type
      • By Channel
      • By Claim
    • Key Takeaways
  16. South Asia & Pacific Analysis 2020 to 2024 and Forecast 2025 to 2035, By Country
    • Historical Market Size Value (USD Million) Trend Analysis By Market Taxonomy, 2020 to 2024
    • Market Size Value (USD Million) Forecast By Market Taxonomy, 2025 to 2035
      • By Country
        • India
        • Thailand
        • Malaysia
        • Indonesia
        • Singapore
        • Vietnam
        • Australia
        • New Zealand
        • Rest of South Asia
      • By Source Technology
      • By Function
      • By Product Type
      • By Channel
      • By Claim
    • Market Attractiveness Analysis
      • By Country
      • By Source Technology
      • By Function
      • By Product Type
      • By Channel
      • By Claim
    • Key Takeaways
  17. Middle East and Africa Analysis 2020 to 2024 and Forecast 2025 to 2035, By Country
    • Historical Market Size Value (USD Million) Trend Analysis By Market Taxonomy, 2020 to 2024
    • Market Size Value (USD Million) Forecast By Market Taxonomy, 2025 to 2035
      • By Country
        • Turkey
        • UAE
        • Saudi Arabia
        • Israel
        • Other GCC Countries
        • North Africa
        • South Africa
      • By Source Technology
      • By Function
      • By Product Type
      • By Channel
      • By Claim
    • Market Attractiveness Analysis
      • By Country
      • By Source Technology
      • By Function
      • By Product Type
      • By Channel
      • By Claim
    • Key Takeaways
  18. Key Countries Analysis
    • USA
      • Pricing Analysis
      • Market Share Analysis, 2024
        • By Source Technology
        • By Function
        • By Product Type
        • By Channel
        • By Claim
    • Canada
      • Pricing Analysis
      • Market Share Analysis, 2024
        • By Source Technology
        • By Function
        • By Product Type
        • By Channel
        • By Claim
    • Mexico
      • Pricing Analysis
      • Market Share Analysis, 2024
        • By Source Technology
        • By Function
        • By Product Type
        • By Channel
        • By Claim
    • Brazil
      • Pricing Analysis
      • Market Share Analysis, 2024
        • By Source Technology
        • By Function
        • By Product Type
        • By Channel
        • By Claim
    • Germany
      • Pricing Analysis
      • Market Share Analysis, 2024
        • By Source Technology
        • By Function
        • By Product Type
        • By Channel
        • By Claim
    • UK
      • Pricing Analysis
      • Market Share Analysis, 2024
        • By Source Technology
        • By Function
        • By Product Type
        • By Channel
        • By Claim
    • Italy
      • Pricing Analysis
      • Market Share Analysis, 2024
        • By Source Technology
        • By Function
        • By Product Type
        • By Channel
        • By Claim
    • Spain
      • Pricing Analysis
      • Market Share Analysis, 2024
        • By Source Technology
        • By Function
        • By Product Type
        • By Channel
        • By Claim
    • France
      • Pricing Analysis
      • Market Share Analysis, 2024
        • By Source Technology
        • By Function
        • By Product Type
        • By Channel
        • By Claim
    • India
      • Pricing Analysis
      • Market Share Analysis, 2024
        • By Source Technology
        • By Function
        • By Product Type
        • By Channel
        • By Claim
    • Australia & New Zealand
      • Pricing Analysis
      • Market Share Analysis, 2024
        • By Source Technology
        • By Function
        • By Product Type
        • By Channel
        • By Claim
    • China
      • Pricing Analysis
      • Market Share Analysis, 2024
        • By Source Technology
        • By Function
        • By Product Type
        • By Channel
        • By Claim
    • Japan
      • Pricing Analysis
      • Market Share Analysis, 2024
        • By Source Technology
        • By Function
        • By Product Type
        • By Channel
        • By Claim
    • South Korea
      • Pricing Analysis
      • Market Share Analysis, 2024
        • By Source Technology
        • By Function
        • By Product Type
        • By Channel
        • By Claim
    • Russia
      • Pricing Analysis
      • Market Share Analysis, 2024
        • By Source Technology
        • By Function
        • By Product Type
        • By Channel
        • By Claim
    • Poland
      • Pricing Analysis
      • Market Share Analysis, 2024
        • By Source Technology
        • By Function
        • By Product Type
        • By Channel
        • By Claim
    • Hungary
      • Pricing Analysis
      • Market Share Analysis, 2024
        • By Source Technology
        • By Function
        • By Product Type
        • By Channel
        • By Claim
    • Kingdom of Saudi Arabia
      • Pricing Analysis
      • Market Share Analysis, 2024
        • By Source Technology
        • By Function
        • By Product Type
        • By Channel
        • By Claim
    • South Africa
      • Pricing Analysis
      • Market Share Analysis, 2024
        • By Source Technology
        • By Function
        • By Product Type
        • By Channel
        • By Claim
  19. Market Structure Analysis
    • Competition Dashboard
    • Competition Benchmarking
    • Market Share Analysis of Top Players
      • By Regional
      • By Source Technology
      • By Function
      • By Product Type
      • By Channel
      • By Claim
  20. Competition Analysis
    • Competition Deep Dive
      • LanzaTech
        • Overview
        • Product Portfolio
        • Profitability by Market Segments (Product/Age /Sales Channel/Region)
        • Sales Footprint
        • Strategy Overview
        • BASF
        • Givaudan
        • Evonik
        • Clariant
        • Carbon Clean
        • Algatech
        • DSM-Firmenich
        • Croda
        • Symrise
  21. Assumptions & Acronyms Used
  22. Research Methodology

List of Tables

  • Table 1: Global Value (USD Million) Forecast by Region, 2020-2035
  • Table 2: Global Value (USD Million) Forecast by Source Technology, 2020-2035
  • Table 3: Global Value (USD Million) Forecast by Function, 2020-2035
  • Table 4: Global Value (USD Million) Forecast by Product Type, 2020-2035
  • Table 5: Global Value (USD Million) Forecast by Channel, 2020-2035
  • Table 6: Global Value (USD Million) Forecast by Claim, 2020-2035
  • Table 7: North America Value (USD Million) Forecast by Country, 2020-2035
  • Table 8: North America Value (USD Million) Forecast by Source Technology, 2020-2035
  • Table 9: North America Value (USD Million) Forecast by Function, 2020-2035
  • Table 10: North America Value (USD Million) Forecast by Product Type, 2020-2035
  • Table 11: North America Value (USD Million) Forecast by Channel, 2020-2035
  • Table 12: North America Value (USD Million) Forecast by Claim, 2020-2035
  • Table 13: Latin America Value (USD Million) Forecast by Country, 2020-2035
  • Table 14: Latin America Value (USD Million) Forecast by Source Technology, 2020-2035
  • Table 15: Latin America Value (USD Million) Forecast by Function, 2020-2035
  • Table 16: Latin America Value (USD Million) Forecast by Product Type, 2020-2035
  • Table 17: Latin America Value (USD Million) Forecast by Channel, 2020-2035
  • Table 18: Latin America Value (USD Million) Forecast by Claim, 2020-2035
  • Table 19: Europe Value (USD Million) Forecast by Country, 2020-2035
  • Table 20: Europe Value (USD Million) Forecast by Source Technology, 2020-2035
  • Table 21: Europe Value (USD Million) Forecast by Function, 2020-2035
  • Table 22: Europe Value (USD Million) Forecast by Product Type, 2020-2035
  • Table 23: Europe Value (USD Million) Forecast by Channel, 2020-2035
  • Table 24: Europe Value (USD Million) Forecast by Claim, 2020-2035
  • Table 25: East Asia Value (USD Million) Forecast by Country, 2020-2035
  • Table 26: East Asia Value (USD Million) Forecast by Source Technology, 2020-2035
  • Table 27: East Asia Value (USD Million) Forecast by Function, 2020-2035
  • Table 28: East Asia Value (USD Million) Forecast by Product Type, 2020-2035
  • Table 29: East Asia Value (USD Million) Forecast by Channel, 2020-2035
  • Table 30: East Asia Value (USD Million) Forecast by Claim, 2020-2035
  • Table 31: South Asia & Pacific Value (USD Million) Forecast by Country, 2020-2035
  • Table 32: South Asia & Pacific Value (USD Million) Forecast by Source Technology, 2020-2035
  • Table 33: South Asia & Pacific Value (USD Million) Forecast by Function, 2020-2035
  • Table 34: South Asia & Pacific Value (USD Million) Forecast by Product Type, 2020-2035
  • Table 35: South Asia & Pacific Value (USD Million) Forecast by Channel, 2020-2035
  • Table 36: South Asia & Pacific Value (USD Million) Forecast by Claim, 2020-2035
  • Table 37: Middle East and Africa Value (USD Million) Forecast by Country, 2020-2035
  • Table 38: Middle East and Africa Value (USD Million) Forecast by Source Technology, 2020-2035
  • Table 39: Middle East and Africa Value (USD Million) Forecast by Function, 2020-2035
  • Table 40: Middle East and Africa Value (USD Million) Forecast by Product Type, 2020-2035
  • Table 41: Middle East and Africa Value (USD Million) Forecast by Channel, 2020-2035
  • Table 42: Middle East and Africa Value (USD Million) Forecast by Claim, 2020-2035

List of Figures

  • Figure 1: Global Pricing Analysis
  • Figure 2: Global Value (USD Million) Forecast 2020-2035
  • Figure 3: Global Value Share and BPS Analysis by Source Technology, 2025 and 2035
  • Figure 4: Global Y-o-Y Growth Comparison by Source Technology, 2025-2035
  • Figure 5: Global Attractiveness Analysis by Source Technology
  • Figure 6: Global Value Share and BPS Analysis by Function, 2025 and 2035
  • Figure 7: Global Y-o-Y Growth Comparison by Function, 2025-2035
  • Figure 8: Global Attractiveness Analysis by Function
  • Figure 9: Global Value Share and BPS Analysis by Product Type, 2025 and 2035
  • Figure 10: Global Y-o-Y Growth Comparison by Product Type, 2025-2035
  • Figure 11: Global Attractiveness Analysis by Product Type
  • Figure 12: Global Value Share and BPS Analysis by Channel, 2025 and 2035
  • Figure 13: Global Y-o-Y Growth Comparison by Channel, 2025-2035
  • Figure 14: Global Attractiveness Analysis by Channel
  • Figure 15: Global Value Share and BPS Analysis by Claim, 2025 and 2035
  • Figure 16: Global Y-o-Y Growth Comparison by Claim, 2025-2035
  • Figure 17: Global Attractiveness Analysis by Claim
  • Figure 18: Global Value (USD Million) Share and BPS Analysis by Region, 2025 and 2035
  • Figure 19: Global Y-o-Y Growth Comparison by Region, 2025-2035
  • Figure 20: Global Attractiveness Analysis by Region
  • Figure 21: North America Incremental $ Opportunity, 2025-2035
  • Figure 22: Latin America Incremental $ Opportunity, 2025-2035
  • Figure 23: Europe Incremental $ Opportunity, 2025-2035
  • Figure 24: East Asia Incremental $ Opportunity, 2025-2035
  • Figure 25: South Asia & Pacific Incremental $ Opportunity, 2025-2035
  • Figure 26: Middle East and Africa Incremental $ Opportunity, 2025-2035
  • Figure 27: North America Value Share and BPS Analysis by Country, 2025 and 2035
  • Figure 28: North America Value Share and BPS Analysis by Source Technology, 2025 and 2035
  • Figure 29: North America Y-o-Y Growth Comparison by Source Technology, 2025-2035
  • Figure 30: North America Attractiveness Analysis by Source Technology
  • Figure 31: North America Value Share and BPS Analysis by Function, 2025 and 2035
  • Figure 32: North America Y-o-Y Growth Comparison by Function, 2025-2035
  • Figure 33: North America Attractiveness Analysis by Function
  • Figure 34: North America Value Share and BPS Analysis by Product Type, 2025 and 2035
  • Figure 35: North America Y-o-Y Growth Comparison by Product Type, 2025-2035
  • Figure 36: North America Attractiveness Analysis by Product Type
  • Figure 37: North America Value Share and BPS Analysis by Channel, 2025 and 2035
  • Figure 38: North America Y-o-Y Growth Comparison by Channel, 2025-2035
  • Figure 39: North America Attractiveness Analysis by Channel
  • Figure 40: North America Value Share and BPS Analysis by Claim, 2025 and 2035
  • Figure 41: North America Y-o-Y Growth Comparison by Claim, 2025-2035
  • Figure 42: North America Attractiveness Analysis by Claim
  • Figure 43: Latin America Value Share and BPS Analysis by Country, 2025 and 2035
  • Figure 44: Latin America Value Share and BPS Analysis by Source Technology, 2025 and 2035
  • Figure 45: Latin America Y-o-Y Growth Comparison by Source Technology, 2025-2035
  • Figure 46: Latin America Attractiveness Analysis by Source Technology
  • Figure 47: Latin America Value Share and BPS Analysis by Function, 2025 and 2035
  • Figure 48: Latin America Y-o-Y Growth Comparison by Function, 2025-2035
  • Figure 49: Latin America Attractiveness Analysis by Function
  • Figure 50: Latin America Value Share and BPS Analysis by Product Type, 2025 and 2035
  • Figure 51: Latin America Y-o-Y Growth Comparison by Product Type, 2025-2035
  • Figure 52: Latin America Attractiveness Analysis by Product Type
  • Figure 53: Latin America Value Share and BPS Analysis by Channel, 2025 and 2035
  • Figure 54: Latin America Y-o-Y Growth Comparison by Channel, 2025-2035
  • Figure 55: Latin America Attractiveness Analysis by Channel
  • Figure 56: Latin America Value Share and BPS Analysis by Claim, 2025 and 2035
  • Figure 57: Latin America Y-o-Y Growth Comparison by Claim, 2025-2035
  • Figure 58: Latin America Attractiveness Analysis by Claim
  • Figure 59: Europe Value Share and BPS Analysis by Country, 2025 and 2035
  • Figure 60: Europe Value Share and BPS Analysis by Source Technology, 2025 and 2035
  • Figure 61: Europe Y-o-Y Growth Comparison by Source Technology, 2025-2035
  • Figure 62: Europe Attractiveness Analysis by Source Technology
  • Figure 63: Europe Value Share and BPS Analysis by Function, 2025 and 2035
  • Figure 64: Europe Y-o-Y Growth Comparison by Function, 2025-2035
  • Figure 65: Europe Attractiveness Analysis by Function
  • Figure 66: Europe Value Share and BPS Analysis by Product Type, 2025 and 2035
  • Figure 67: Europe Y-o-Y Growth Comparison by Product Type, 2025-2035
  • Figure 68: Europe Attractiveness Analysis by Product Type
  • Figure 69: Europe Value Share and BPS Analysis by Channel, 2025 and 2035
  • Figure 70: Europe Y-o-Y Growth Comparison by Channel, 2025-2035
  • Figure 71: Europe Attractiveness Analysis by Channel
  • Figure 72: Europe Value Share and BPS Analysis by Claim, 2025 and 2035
  • Figure 73: Europe Y-o-Y Growth Comparison by Claim, 2025-2035
  • Figure 74: Europe Attractiveness Analysis by Claim
  • Figure 75: East Asia Value Share and BPS Analysis by Country, 2025 and 2035
  • Figure 76: East Asia Value Share and BPS Analysis by Source Technology, 2025 and 2035
  • Figure 77: East Asia Y-o-Y Growth Comparison by Source Technology, 2025-2035
  • Figure 78: East Asia Attractiveness Analysis by Source Technology
  • Figure 79: East Asia Value Share and BPS Analysis by Function, 2025 and 2035
  • Figure 80: East Asia Y-o-Y Growth Comparison by Function, 2025-2035
  • Figure 81: East Asia Attractiveness Analysis by Function
  • Figure 82: East Asia Value Share and BPS Analysis by Product Type, 2025 and 2035
  • Figure 83: East Asia Y-o-Y Growth Comparison by Product Type, 2025-2035
  • Figure 84: East Asia Attractiveness Analysis by Product Type
  • Figure 85: East Asia Value Share and BPS Analysis by Channel, 2025 and 2035
  • Figure 86: East Asia Y-o-Y Growth Comparison by Channel, 2025-2035
  • Figure 87: East Asia Attractiveness Analysis by Channel
  • Figure 88: East Asia Value Share and BPS Analysis by Claim, 2025 and 2035
  • Figure 89: East Asia Y-o-Y Growth Comparison by Claim, 2025-2035
  • Figure 90: East Asia Attractiveness Analysis by Claim
  • Figure 91: South Asia & Pacific Value Share and BPS Analysis by Country, 2025 and 2035
  • Figure 92: South Asia & Pacific Value Share and BPS Analysis by Source Technology, 2025 and 2035
  • Figure 93: South Asia & Pacific Y-o-Y Growth Comparison by Source Technology, 2025-2035
  • Figure 94: South Asia & Pacific Attractiveness Analysis by Source Technology
  • Figure 95: South Asia & Pacific Value Share and BPS Analysis by Function, 2025 and 2035
  • Figure 96: South Asia & Pacific Y-o-Y Growth Comparison by Function, 2025-2035
  • Figure 97: South Asia & Pacific Attractiveness Analysis by Function
  • Figure 98: South Asia & Pacific Value Share and BPS Analysis by Product Type, 2025 and 2035
  • Figure 99: South Asia & Pacific Y-o-Y Growth Comparison by Product Type, 2025-2035
  • Figure 100: South Asia & Pacific Attractiveness Analysis by Product Type
  • Figure 101: South Asia & Pacific Value Share and BPS Analysis by Channel, 2025 and 2035
  • Figure 102: South Asia & Pacific Y-o-Y Growth Comparison by Channel, 2025-2035
  • Figure 103: South Asia & Pacific Attractiveness Analysis by Channel
  • Figure 104: South Asia & Pacific Value Share and BPS Analysis by Claim, 2025 and 2035
  • Figure 105: South Asia & Pacific Y-o-Y Growth Comparison by Claim, 2025-2035
  • Figure 106: South Asia & Pacific Attractiveness Analysis by Claim
  • Figure 107: Middle East and Africa Value Share and BPS Analysis by Country, 2025 and 2035
  • Figure 108: Middle East and Africa Value Share and BPS Analysis by Source Technology, 2025 and 2035
  • Figure 109: Middle East and Africa Y-o-Y Growth Comparison by Source Technology, 2025-2035
  • Figure 110: Middle East and Africa Attractiveness Analysis by Source Technology
  • Figure 111: Middle East and Africa Value Share and BPS Analysis by Function, 2025 and 2035
  • Figure 112: Middle East and Africa Y-o-Y Growth Comparison by Function, 2025-2035
  • Figure 113: Middle East and Africa Attractiveness Analysis by Function
  • Figure 114: Middle East and Africa Value Share and BPS Analysis by Product Type, 2025 and 2035
  • Figure 115: Middle East and Africa Y-o-Y Growth Comparison by Product Type, 2025-2035
  • Figure 116: Middle East and Africa Attractiveness Analysis by Product Type
  • Figure 117: Middle East and Africa Value Share and BPS Analysis by Channel, 2025 and 2035
  • Figure 118: Middle East and Africa Y-o-Y Growth Comparison by Channel, 2025-2035
  • Figure 119: Middle East and Africa Attractiveness Analysis by Channel
  • Figure 120: Middle East and Africa Value Share and BPS Analysis by Claim, 2025 and 2035
  • Figure 121: Middle East and Africa Y-o-Y Growth Comparison by Claim, 2025-2035
  • Figure 122: Middle East and Africa Attractiveness Analysis by Claim
  • Figure 123: Global - Tier Structure Analysis
  • Figure 124: Global - Company Share Analysis

Frequently Asked Questions

How big is the Global Carbon-Dioxide Synthesis Cosmetics Market in 2025?

The Global Carbon-Dioxide Synthesis Cosmetics Market is estimated to be valued at USD 850.7 million in 2025.

What will be the size of the Global Carbon-Dioxide Synthesis Cosmetics Market in 2035?

The market size for the Global Carbon-Dioxide Synthesis Cosmetics Market is projected to reach USD 3,402.3 million by 2035.

How much will be the Global Carbon-Dioxide Synthesis Cosmetics Market growth between 2025 and 2035?

The Global Carbon-Dioxide Synthesis Cosmetics Market is expected to grow at a 14.9% CAGR between 2025 and 2035.

What are the key product types in the Global Carbon-Dioxide Synthesis Cosmetics Market?

The key product types in the Global Carbon-Dioxide Synthesis Cosmetics Market are serums, creams/lotions, masks, and oils.

Which claim segment will contribute a significant share in the Global Carbon-Dioxide Synthesis Cosmetics Market in 2025?

In terms of claims, the carbon-negative segment is set to command 53.4% share in the Global Carbon-Dioxide Synthesis Cosmetics Market in 2025.

Explore Similar Insights

Future Market Insights

Carbon-Dioxide Synthesis Cosmetics Market

Chat With

MaRIA

Hi There, I am MaRIA, Your Market Research Intelligence Assistant. How may I help you?