Biomimetic Collagen Synthesis Market Size and Share Forecast Outlook 2025 to 2035

A valuation of USD 1,410.5 million has been recorded for the biomimetic collagen synthesis market in 2025, and this figure is projected to advance to USD 4,753.1 million by 2035. The growth equals an incremental addition of over USD 3,342.6 million across the decade, representing a CAGR of 12.9%.
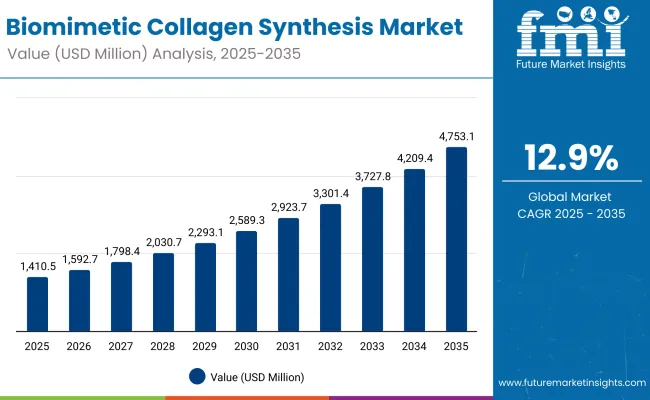
Quick Stats for Biomimetic Collagen Synthesis Market

  • Biomimetic Collagen Synthesis Market Value (2025): USD 1,410.5 Million
  • Biomimetic Collagen Synthesis Market Forecast Value (2035): USD 4,753.1 Million
  • Biomimetic Collagen Synthesis Market Forecast CAGR: 12.9%
  • Leading Segment in Biomimetic Collagen Synthesis Market in 2025: Collagen boosting (56.6%)
  • Key Growth Regions in the Biomimetic Collagen Synthesis Market: Asia-Pacific, North America, Europe
  • Top Key Players in Biomimetic Collagen Synthesis Market: DSM-Firmenich, Evonik, Croda, Ashland, BASF, Givaudan, Seppic, Mibelle Biochemistry, Sederma, Provital

Biomimetic Collagen Synthesis Market

Biomimetic Collagen Synthesis Market Key Takeaways

Metric Value
Biomimetic Collagen Synthesis Market Estimated Value In (2025e) USD 1,410.5 Million
Biomimetic Collagen Synthesis Market Forecast Value In (2035f) USD 4,753.1 Million
Forecast CAGR (2025 to 2035) 12.90%

During the first half of the forecast period from 2025 to 2030, the market is anticipated to expand steadily from USD 1,410.5 million to USD 2,589.3 million. This stage is expected to contribute USD 1,178.8 million, which accounts for nearly 35% of the overall decade growth. The progress during this timeframe is likely to be underpinned by rising demand for advanced wrinkle repair formulations and heightened adoption of clinical-grade biomimetic actives.

Between 2030 and 2035, accelerated momentum is expected as the market grows from USD 2,589.3 million to USD 4,753.1 million. This second phase represents USD 2,163.8 million of value creation, equating to almost two-thirds of total decade expansion. Stronger uptake in high-growth regions such as China and India, alongside biotech-driven collagen boosting pathways, is expected to support this surge.

The wrinkle repair segment is projected to dominate throughout the period, while biotech-engineered proteins are anticipated to capture the largest share among ingredient types in 2025 with 56.6%, reinforcing their role as the primary growth driver for the industry outlook.

From 2020 to 2024, the biomimetic collagen synthesis market expanded steadily, reflecting early adoption of biotech-engineered proteins and peptide-based mimetics. During this phase, multinational chemical and life sciences leaders consolidated their positions, contributing to structured growth and reinforcing clinical validation standards. Competitive differentiation was driven by sustainability frameworks, research depth, and dermatologist partnerships, while consumer-facing companies increasingly sought efficacy-backed formulations.

The market is projected to reach USD 1,410.5 million in 2025, setting the stage for accelerated expansion led by Asia-Pacific, where China and India are advancing at double-digit growth rates. Between 2025 and 2035, the revenue mix is expected to tilt strongly toward clinical-grade offerings and serums, supported by digital retail platforms and precision dermatology services. Competitive strategies are forecast to shift away from volume supply toward integrated ecosystems combining biotech innovation, clinical trials, and sustainability alignment. Emerging entrants specializing in enzyme-stimulated pathways, clean-label proteins, and vegan formulations are anticipated to gain share. Long-term advantage is expected to be defined by intellectual property strength, regulatory trust, and alignment with evolving consumer values.

Why The Biomimetic Collagen Synthesis Market is growing?

Growth in the biomimetic collagen synthesis market is being fueled by rising consumer demand for advanced anti-aging and skin-repair solutions. Significant progress in biotechnology has enabled proteins and peptides to be engineered with higher efficacy, which has strengthened the appeal of wrinkle repair and collagen boosting formulations. Clinical-grade claims have been positioned as a key trust driver, encouraging wider adoption across both developed and emerging economies.

Increased emphasis on preventive skincare and dermal longevity has further elevated demand, particularly among younger demographics seeking early intervention. Digital platforms and e-commerce channels have been leveraged to accelerate accessibility, while dermatology clinics and pharmacies have been utilized to build credibility. Regional expansion is being driven by rapid adoption in Asia, with China and India forecast to deliver the fastest growth trajectories. Continued investment in sustainable bio-based pathways and regulatory support for innovative collagen technologies are expected to provide strong momentum for future expansion.

Segmental Analysis

The biomimetic collagen synthesis market has been structured across multiple dimensions to capture the evolving dynamics of consumer demand and scientific innovation. Segmentation reflects how functions, claims, and product formats are shaping adoption patterns. Functional categorization underscores the dermal benefits prioritized by different consumer groups, while claim-based segmentation highlights the importance of credibility and clinical validation in driving purchase behavior.

Product type segmentation further reveals the formats that are gaining prominence in both professional dermatology settings and consumer skincare routines. Each of these categories is expected to advance in line with biotechnological progress, heightened emphasis on evidence-backed formulations, and regulatory frameworks supporting safe, sustainable innovation. Together, these segments provide a comprehensive understanding of how market value will be distributed and which areas are poised to define growth trajectories through 2035.
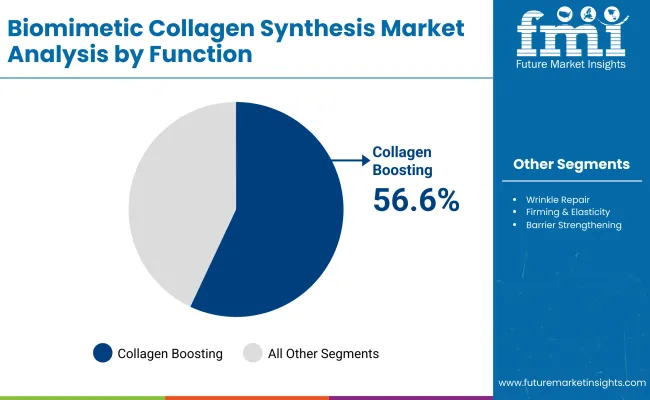
Insights into the Function Segment with Collagen Boosting Leading in Market Share

Biomimetic Collagen Synthesis Market By Function

Segment Market Value Share, 2025
Collagen boosting 56.6%
Others 43.4%

The function segment is anticipated to be driven by collagen boosting, which is expected to contribute 56.6% of the total market value in 2025, equivalent to USD 791.9 million. Rising demand for preventive skincare solutions and scientifically validated dermal repair products is positioning this category as the largest growth contributor. Wrinkle repair and elasticity enhancement are being recognized as critical needs across demographics, with collagen boosting technologies at the center of innovation. Greater integration of biotech-engineered proteins and sustainable active ingredients is forecast to provide further momentum. With consumer preferences shifting toward long-term dermal health, collagen boosting is expected to remain the dominant function through the forecast horizon.
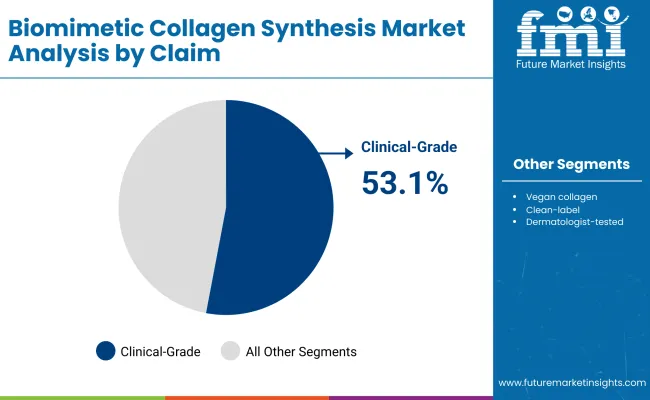
Insights into the Claim Segment with Clinical-grade Leading in Market Share

Biomimetic Collagen Synthesis Market By Claim

Segment Market Value Share, 2025
Clinical-grade 53.1%
Others 46.9%

The claim segment is projected to be led by clinical-grade offerings, which are expected to represent 53.1% of global value in 2025, equating to USD 735.4 million. This dominance is being supported by consumer trust in dermatologist-tested, efficacy-backed formulations that ensure visible results. Increasing emphasis on scientific validation in marketing claims is reinforcing adoption in both mature and emerging markets. As skincare buyers prioritize safety and evidence-driven performance, clinical-grade products are forecast to consolidate their leadership. Ongoing R&D and partnerships with dermatological institutions are expected to further elevate this segment’s reputation. With credibility emerging as the key driver in premium skincare, clinical-grade claims are anticipated to maintain their leading share throughout the decade.
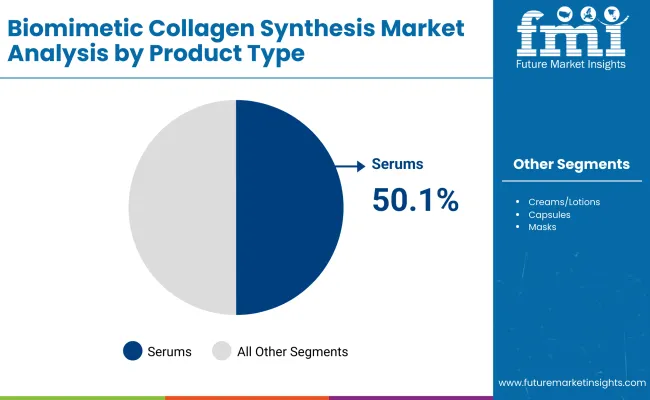
Insights into the Product Type Segment with Serums Leading in Market Share

Biomimetic Collagen Synthesis Market By Product

Segment Market Value Share, 2025
Serums 50.1%
Others 49.9%

The product type segment is expected to be led by serums, which are anticipated to capture 50.1% share in 2025, valued at USD 707.1 million. The dominance of serums is being driven by their concentrated formulations and rapid absorption benefits, which align with consumer preferences for high-efficacy skincare. Their suitability for layering within multi-step routines has reinforced adoption across all age groups. Innovation in delivery mechanisms and peptide-based biomimetic actives is expected to expand their appeal further. As consumer awareness of targeted skincare continues to increase, serums are forecast to retain their leadership position. Growth is anticipated to be accelerated by premium positioning, clinical validation, and alignment with evolving clean-label and sustainable product trends.

What are the Drivers, Restraints, and Key Trends of the Biomimetic Collagen Synthesis Market?

Complex regulatory pathways and high R&D expenditure are shaping the biomimetic collagen synthesis market, while biotechnology innovations, clinical validation requirements, and sustainability imperatives are influencing adoption patterns, creating both opportunities and challenges for stakeholders across advanced skincare and dermatology domains.

Integration of Bioinformatics and AI in Collagen Pathway Design

A significant driver for the biomimetic collagen synthesis market is the application of bioinformatics and artificial intelligence in molecular design and protein engineering. Predictive algorithms are being employed to simulate collagen biosynthesis pathways, enabling identification of optimized peptide structures with greater speed and precision. These technologies are expected to lower experimental inefficiencies and shorten development cycles, while ensuring higher reproducibility of results. By combining computational biology with laboratory-scale innovation, scalability of novel biomimetic actives can be achieved more effectively. This integration is likely to provide a competitive edge to industry participants, particularly in regions where clinical validation and regulatory scrutiny are stringent, such as Europe and North America.

Sustainability-Driven Shifts Toward Biotech-Engineered Alternatives

A key trend influencing the market is the transition from animal-derived collagen sources toward sustainable biotech-engineered alternatives. Consumer scrutiny of sourcing transparency and environmental impact is intensifying, leading to a greater preference for proteins developed through fermentation or plant-cell culture technologies. This trend aligns with clean-label and vegan positioning, ensuring resonance with ethically conscious buyers.

Regulatory encouragement of greener biotechnology solutions is further reinforcing this shift, pushing manufacturers to prioritize renewable production platforms. By aligning innovation pipelines with sustainability objectives, companies are expected to differentiate themselves in highly competitive premium skincare categories. Over time, sustainability-driven collagen synthesis is forecast to become an industry benchmark rather than a niche offering.
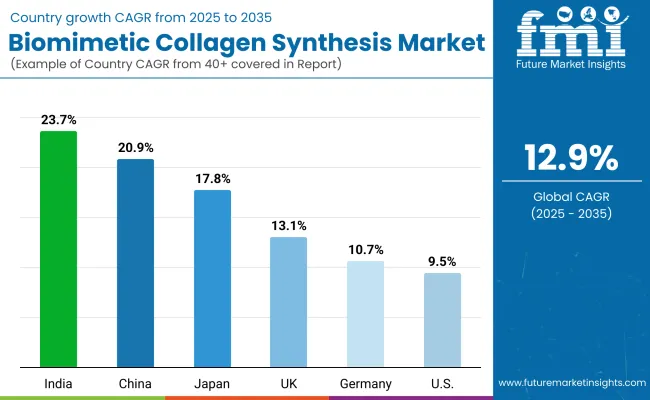
Analysis of Biomimetic Collagen Synthesis Market By Key Countries

Biomimetic Collagen Synthesis Market By Country

Countries CAGR
China 20.9%
USA 9.5%
India 23.7%
UK 13.1%
Germany 10.7%
Japan 17.8%

The global biomimetic collagen synthesis market displays clear disparities in country-level growth trajectories, influenced by biotechnology maturity, regulatory frameworks, and evolving consumer expectations in advanced skincare. India is projected to achieve the fastest expansion, with a CAGR of 23.7% between 2025 and 2035, supported by rising adoption of preventive skincare among younger demographics and an accelerating biotech innovation ecosystem.

China is expected to follow closely with a CAGR of 20.9%, as government-backed initiatives to promote sustainable biotech and consumer appetite for clinical-grade anti-aging solutions reinforce market expansion. Japan is forecast to progress at a CAGR of 17.8%, reflecting the country’s strong emphasis on science-led beauty innovations and long-standing cultural demand for dermal longevity solutions.

In Europe, steady growth is projected, led by the UK at 13.1% CAGR and Germany at 10.7%. Both countries are likely to benefit from stringent quality standards and advanced dermatology practices that prioritize clinically validated biomimetic actives. The USA, by contrast, is expected to expand more moderately at 9.5%, with adoption shaped by mature dermatology markets and greater emphasis on premium, evidence-driven formulations. Overall, high-growth momentum is anticipated to remain centered in Asia, while Europe and North America sustain expansion through regulatory compliance and premium positioning.
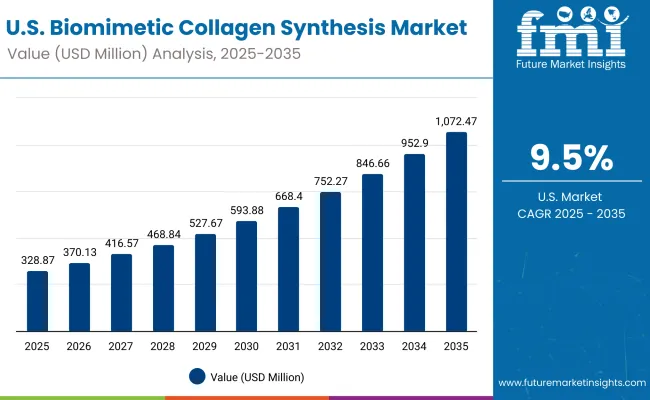
Sales Outlook for Biomimetic Collagen Synthesis in the United States

Biomimetic Collagen Synthesis Market Usa

Year USA Biomimetic Collagen Synthesis Market (USD Million)
2025 328.87
2026 370.13
2027 416.57
2028 468.84
2029 527.67
2030 593.88
2031 668.40
2032 752.27
2033 846.66
2034 952.90
2035 1,072.47

The biomimetic collagen synthesis market in the United States is forecast to expand at a CAGR of 9.5% between 2025 and 2035. Market size is projected to grow from USD 328.87 million in 2025 to USD 1,072.47 million by 2035, reflecting steady adoption of advanced collagen pathways. Expansion is expected to be reinforced by consumer trust in clinical-grade formulations and a strong dermatology infrastructure that prioritizes evidence-backed solutions. Premium positioning, e-commerce accessibility, and partnerships with dermatology clinics are likely to accelerate the adoption of biomimetic actives.

  • Clinical-grade collagen claims are being positioned as the leading trust-building factor in the USA skincare market.
  • Strategic alignment with biotech-engineered proteins is expected to reinforce long-term competitive advantage.

Growth and Expansion Outlook for Biomimetic Collagen Synthesis Market in the United Kingdom

The biomimetic collagen synthesis market in the UK is forecast to expand at a CAGR of 13.1% between 2025 and 2035. Market development is expected to be underpinned by a stringent evidence threshold in dermatology, where clinician-endorsed, clinical-grade claims are prioritized in procurement and retail ranging. Growth is likely to be supported by strong private dermatology networks, robust pharmacy chains, and e-commerce marketplaces that reward transparency in ingredient provenance and efficacy dossiers. Premium pricing power is expected to hold, as consumers exhibit high receptivity to biotech-engineered proteins with sustainability credentials and traceable manufacturing. Regulatory expectations around green claims and data substantiation are anticipated to elevate barriers to entry, favoring IP-backed actives and partnerships with academic centers.

  • Clinical-grade positioning is being used to anchor retail and clinic formularies.
  • Sustainability and provenance are being treated as decision-making criteria, not add-ons.
  • Omni-channel models linking clinics, pharmacies, and e-commerce are expected to scale.
  • IP-rich suppliers are projected to gain share through exclusivity agreements.

Growth and Expansion Outlook for Biomimetic Collagen Synthesis Market in India

The biomimetic collagen synthesis market in India is projected to grow at a CAGR of 23.7% from 2025 to 2035. Expansion is expected to be propelled by rapid modernization of beauty-dermatology services, where protocolized anti-aging regimens increasingly incorporate biomimetic actives. Tier-2 and tier-3 city penetration is anticipated to accelerate through tele-dermatology and D2C platforms, while domestic biotech manufacturing is likely to enhance affordability and supply continuity. Regulatory streamlining around cosmeceutical claims is expected to reward standardized testing and post-market surveillance, improving consumer confidence. With a youthful population attentive to long-horizon skin health, multi-step routines are likely to anchor recurring purchases of serums featuring engineered peptides.

  • Domestic fermentation and fill-finish capabilities are being scaled for cost efficiency.
  • Dermatologist-led influencer ecosystems are expected to shape protocol adoption.
  • Clean-label and vegan cues are being leveraged to move consumers up the value ladder.
  • Retail diagnostics and skin analyzers are projected to raise attachment rates per visit.

Sales Outlook for Biomimetic Collagen Synthesis in China

The biomimetic collagen synthesis market in China is anticipated to advance at a CAGR of 20.9% over 2025-2035. Growth is expected to be framed by a policy environment supportive of biotech self-reliance, accelerating investment in fermentation, precision peptide design, and compliant manufacturing. Cross-border channels are forecast to coexist with locally produced, CFDA-registered clinical-grade products, with performance claims scrutinized through increasingly rigorous testing norms. Consumer sophistication in anti-aging and barrier-repair categories is expected to translate into premium trade-up, particularly within serums and targeted boosters. Data-rich e-commerce ecosystems are likely to enable fast iteration of claims, pack sizes, and regimen bundles, compressing product cycle times.
  • Industrial parks dedicated to beauty biotech are being utilized to de-risk scaling.
  • Real-world evidence (RWE) programs are expected to validate outcomes post-launch.
  • Private clinics and medical-aesthetic chains are projected to standardize collagen protocols.
  • Social commerce and live-streaming are being used to accelerate cohort testing and upsell.

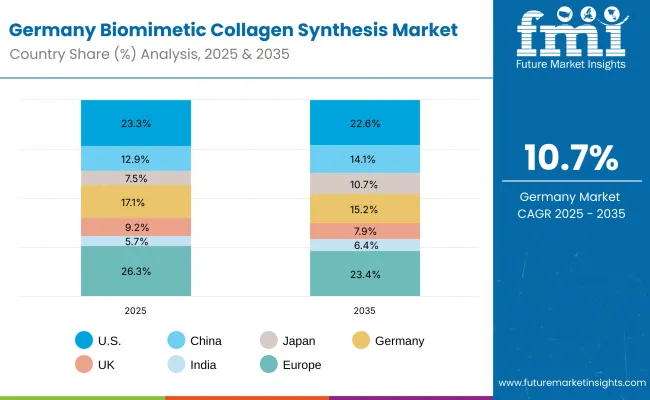
In-depth Analysis of Biomimetic Collagen Synthesis in Germany

Biomimetic Collagen Synthesis Market Germany

Countries 2025 Share (%)
USA 23.3%
China 12.9%
Japan 7.5%
Germany 17.1%
UK 9.2%
India 5.7%
Countries 2035 Share (%)
USA 22.6%
China 14.1%
Japan 10.7%
Germany 15.2%
UK 7.9%
India 6.4%

The biomimetic collagen synthesis market in Germany is expected to post a CAGR of 10.7% through 2035. Market progress is likely to be anchored in pharmacy-led distribution and dermatologist stewardship, where documented efficacy and safety profiles are treated as non-negotiable. Procurement practices are anticipated to favor suppliers offering GMP-grade production, lifecycle carbon accounting, and comprehensive technical dossiers. As reimbursement-adjacent preventive care gains traction, clinic-dispensed regimens featuring biomimetic peptides are expected to complement OTC maintenance. Engineering-driven consumers are likely to reward measurable outcomes, supporting devices and diagnostics that pair with high-potency serums.
  • Audit-ready supply chains with GMP and ISO credentials are being prioritized by buyers.
  • Environmental product declarations (EPDs) are expected to influence institutional listings.
  • Co-development with university dermatology centers is being used to secure clinical credibility.
  • Subscription models via pharmacies and clinics are projected to stabilize repeat purchase behavior.

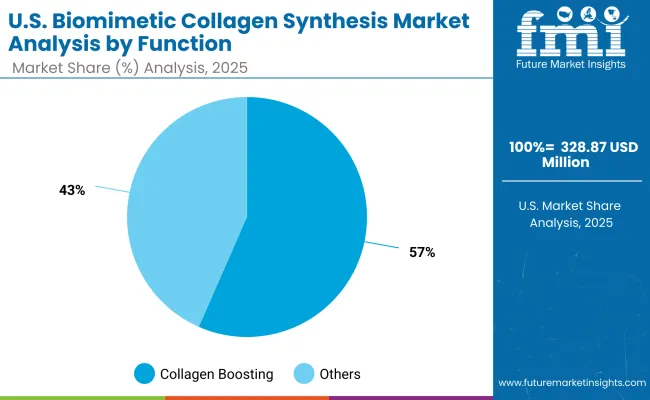
Growth Outlook For Biomimetic Collagen Synthesis Market in USA

Biomimetic Collagen Synthesis Market Usa 2

Segment Market Value Share, 2025
Collagen boosting 56.6%
Others 43.4%

The biomimetic collagen synthesis market in the United States is projected at USD 328.87 million in 2025. Collagen boosting contributes 56.6% (USD 186.0 million), while other functions account for 43.4% (USD 142.84 million). This functional dominance highlights a clear preference for formulations designed to stimulate dermal regeneration and prevent age-related structural decline. The prioritization of collagen boosting reflects the country’s advanced dermatology ecosystem, where evidence-based interventions are being widely adopted to meet rising demand for clinically validated outcomes.

Unlike general-purpose products, collagen-boosting actives are being positioned as high-value innovations with both preventive and corrective benefits. Greater penetration in clinical-grade regimens and integration into dermatology protocols are expected to further reinforce the segment’s leadership. As awareness of skin longevity accelerates, collagen boosting is forecast to remain the anchor of the USA functional landscape.
  • Collagen boosting holds the largest function share at 56.6% in 2025.
  • Function-specific innovation is projected to remain the key driver of premium adoption.
  • Dermatology-led clinical validation is reinforcing consumer trust in targeted solutions.

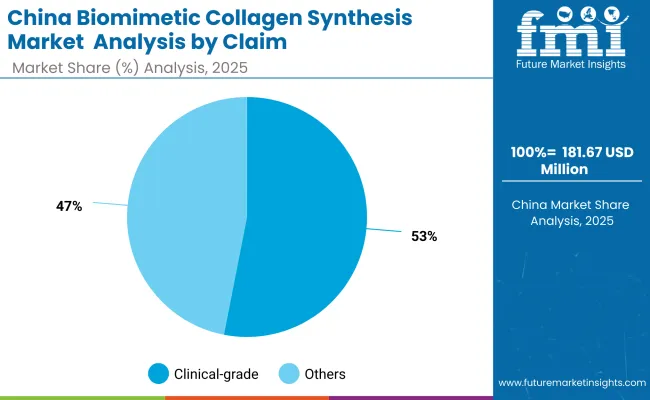
Opportunity Analysis of China Biomimetic Collagen Synthesis Market

Biomimetic Collagen Synthesis Market China

Segment Market Value Share, 2025
Clinical-grade 53.1%
Others 46.9%

The biomimetic collagen synthesis market in China is projected at USD 181.67 million in 2025. Clinical-grade offerings contribute 53.1% (USD 96.4 million), while other claims represent 46.9% (USD 85.27 million). The clear leadership of clinical-grade formulations reflects the increasing prioritization of scientific validation and regulatory compliance in China’s fast-expanding skincare sector. This positioning is expected to be strengthened by growing consumer trust in efficacy-backed solutions that align with both dermatologist recommendations and national quality standards. Unlike general claims, clinical-grade products are being recognized as premium-tier interventions with high adoption among middle- and upper-income demographics. With government initiatives encouraging biotech self-reliance and stricter oversight of product claims, clinical-grade biomimetic actives are forecast to consolidate their dominance. The shift toward credibility-driven skincare is likely to anchor China’s rapid CAGR of 20.9% through 2035.
  • Clinical-grade claims hold the majority share at 53.1% in 2025.
  • Regulatory emphasis on validated claims is reshaping competitive strategies.
  • Growing demand for dermatologist-tested solutions is driving premium adoption.

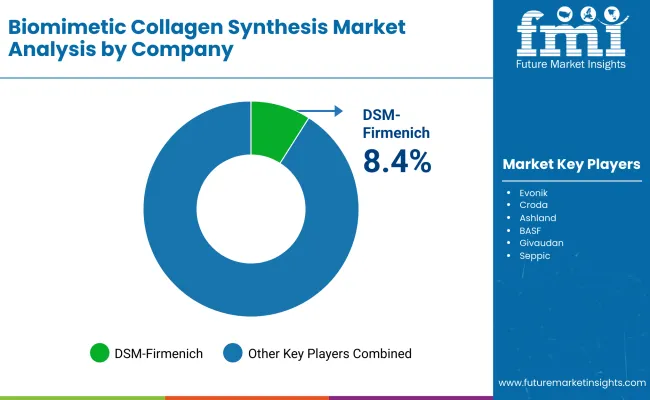
Competitive Landscape of Biomimetic Collagen Synthesis Market

Biomimetic Collagen Synthesis Market By Company

The biomimetic collagen synthesis market is moderately fragmented, with global leaders, mid-sized innovators, and specialized formulators competing across advanced skincare and cosmeceutical applications. Global leaders such as DSM-Firmenich, BASF, and Evonik hold measurable shares, anchored by deep expertise in biotechnology, fermentation, and protein engineering. DSM-Firmenich dominates the market with a global value share of 8.4% in 2025 (estimated slightly above 8% in 2024), reflecting its early investments in sustainable biomimetic actives and its strong partnerships across dermatology and clinical-grade skincare brands.

Mid-sized innovators, including Croda, Ashland, and Givaudan, are positioned around peptide-based collagen boosters, natural mimetics, and clinical formulation support. Their focus is directed toward combining biotech-engineered pathways with consumer-driven positioning such as clean-label and vegan claims. These companies are expected to accelerate adoption through product diversification and alignment with dermatology-backed claims.

Specialist firms such as Seppic, Mibelle Biochemistry, Sederma, and Provital emphasize niche biomimetic technologies and application-specific solutions. Their strength lies in customization for targeted dermal functions, R&D-driven product differentiation, and agility in capturing regional opportunities.

Competitive differentiation is shifting from ingredient supply alone toward integrated innovation ecosystems, where biotech research, regulatory validation, and sustainability frameworks converge. By embedding collagen synthesis technologies within premium skincare pipelines, players are expected to build long-term brand partnerships and expand influence across high-growth Asia-Pacific and European markets.

Key Developments In Biomimetic Collagen Synthesis Market

  • In April 2025, DSM-Firmenich introduced SYN®-COLL CB, a patented, natural-origin tripeptide powered by green chemistry, to slow skin aging by mimicking body’s collagen-boosting mechanisms. It was released as an eco-conscious, high-performance peptide acting against UV-induced collagen degradation.
  • In June 2025, a research group published a clinical breakthrough around a biomimetic scaffold made from soluble collagen, capable of replicating native tissue’s structure and function. It was shown to enable functional regeneration (nerve, tendon) in animal models, while synchronizing scaffold degradation with tissue growth.

Scope of the Report

Item Value
Quantitative Units USD 1,410.5 Million in 2025 → USD 4,753.1 Million in 2035
Function Collagen boosting, Wrinkle repair, Firming & elasticity, Barrier strengthening
Ingredient Type Biotech-engineered proteins, Peptide-based, Plant-derived mimetics, Enzyme-stimulated
Product Type Serums, Creams/Lotions, Capsules, Masks
Claim Clinical-grade, Vegan collagen, Clean-label, Dermatologist-tested
Channel E-commerce, Dermatology clinics, Pharmacies, Premium retail
Regions Covered North America, Europe, Asia-Pacific, Latin America, Middle East & Africa
Countries Covered United States, Canada, Germany, United Kingdom, France, China, Japan, India, Brazil, South Africa
Key Companies Profiled DSM-Firmenich, Evonik, Croda, Ashland, BASF, Givaudan, Seppic, Mibelle Biochemistry, Sederma, Provital
Additional Attributes Dollar sales by function, ingredient, and product type; expansion of clinical-grade formulations; strong adoption in Asia led by China (20.9% CAGR) and India (23.7% CAGR); sustainability-driven demand for biotech-engineered proteins; e-commerce and clinic-based channel growth; competitive landscape led by DSM-Firmenich with 8.4% global share in 2025

Key Segments

By Source:

  • Cactus extracts
  • Baobab
  • Aloe vera
  • Prickly pear

By Function:

  • Hydration
  • Repair & soothing
  • Anti-aging
  • Protection from environmental stress

By Product Type:

  • Serums
  • Creams/lotions
  • Gels
  • Masks

By Channel:

  • E-commerce
  • Pharmacies
  • Specialty retail
  • Mass retail

By Claim:

  • Sustainable sourcing
  • Natural/organic
  • Vegan
  • Clean-label

By Region:

  • North America
  • Latin America
  • Europe
  • East Asia
  • South Asia & Pacific
  • Middle East and Africa

Table of Content

  1. Executive Summary
    • Global Market Outlook
    • Demand-side Trends
    • Supply-side Trends
    • Technology Roadmap Analysis
    • Analysis and Recommendations
  2. Market Overview
    • Market Coverage / Taxonomy
    • Market Definition / Scope / Limitations
  3. Market Background
    • Market Dynamics
      • Drivers
      • Restraints
      • Opportunity
      • Trends
    • Scenario Forecast
      • Demand in Optimistic Scenario
      • Demand in Likely Scenario
      • Demand in Conservative Scenario
    • Opportunity Map Analysis
    • Product Life Cycle Analysis
    • Supply Chain Analysis
    • Investment Feasibility Matrix
    • Value Chain Analysis
    • PESTLE and Porter’s Analysis
    • Regulatory Landscape
    • Regional Parent Market Outlook
    • Production and Consumption Statistics
    • Import and Export Statistics
  4. Global Market Analysis 2020 to 2024 and Forecast, 2025 to 2035
    • Historical Market Size Value (USD Million) Analysis, 2020 to 2024
    • Current and Future Market Size Value (USD Million) Projections, 2025 to 2035
      • Y-o-Y Growth Trend Analysis
      • Absolute $ Opportunity Analysis
  5. Global Market Pricing Analysis 2020 to 2024 and Forecast 2025 to 2035
  6. Global Market Analysis 2020 to 2024 and Forecast 2025 to 2035, By Source
    • Introduction / Key Findings
    • Historical Market Size Value (USD Million) Analysis By Source, 2020 to 2024
    • Current and Future Market Size Value (USD Million) Analysis and Forecast By Source, 2025 to 2035
      • Cactus extracts
      • Baobab
      • Aloe vera
      • Prickly pear
    • Y-o-Y Growth Trend Analysis By Source, 2020 to 2024
    • Absolute $ Opportunity Analysis By Source, 2025 to 2035
  7. Global Market Analysis 2020 to 2024 and Forecast 2025 to 2035, By Function
    • Introduction / Key Findings
    • Historical Market Size Value (USD Million) Analysis By Function, 2020 to 2024
    • Current and Future Market Size Value (USD Million) Analysis and Forecast By Function, 2025 to 2035
      • Hydration
      • Repair & soothing
      • Anti-aging
      • Protection from environmental stress
    • Y-o-Y Growth Trend Analysis By Function, 2020 to 2024
    • Absolute $ Opportunity Analysis By Function, 2025 to 2035
  8. Global Market Analysis 2020 to 2024 and Forecast 2025 to 2035, By Product Type
    • Introduction / Key Findings
    • Historical Market Size Value (USD Million) Analysis By Product Type, 2020 to 2024
    • Current and Future Market Size Value (USD Million) Analysis and Forecast By Product Type, 2025 to 2035
      • Serums
      • Creams/lotions
      • Gels
      • Masks
    • Y-o-Y Growth Trend Analysis By Product Type, 2020 to 2024
    • Absolute $ Opportunity Analysis By Product Type, 2025 to 2035
  9. Global Market Analysis 2020 to 2024 and Forecast 2025 to 2035, By Channel
    • Introduction / Key Findings
    • Historical Market Size Value (USD Million) Analysis By Channel, 2020 to 2024
    • Current and Future Market Size Value (USD Million) Analysis and Forecast By Channel, 2025 to 2035
      • E-commerce
      • Pharmacies
      • Specialty retail
      • Mass retail
    • Y-o-Y Growth Trend Analysis By Channel, 2020 to 2024
    • Absolute $ Opportunity Analysis By Channel, 2025 to 2035
  10. Global Market Analysis 2020 to 2024 and Forecast 2025 to 2035, By Claim
    • Introduction / Key Findings
    • Historical Market Size Value (USD Million) Analysis By Claim, 2020 to 2024
    • Current and Future Market Size Value (USD Million) Analysis and Forecast By Claim, 2025 to 2035
      • Sustainable sourcing
      • Natural/organic
      • Vegan
      • Clean-label
    • Y-o-Y Growth Trend Analysis By Claim, 2020 to 2024
    • Absolute $ Opportunity Analysis By Claim, 2025 to 2035
  11. Global Market Analysis 2020 to 2024 and Forecast 2025 to 2035, By Region
    • Introduction
    • Historical Market Size Value (USD Million) Analysis By Region, 2020 to 2024
    • Current Market Size Value (USD Million) Analysis and Forecast By Region, 2025 to 2035
      • North America
      • Latin America
      • Europe
      • East Asia
      • South Asia & Pacific
      • Middle East and Africa
    • Market Attractiveness Analysis By Region
  12. North America Market Analysis 2020 to 2024 and Forecast 2025 to 2035, By Country
    • Historical Market Size Value (USD Million) Trend Analysis By Market Taxonomy, 2020 to 2024
    • Market Size Value (USD Million) Forecast By Market Taxonomy, 2025 to 2035
      • By Country
        • USA
        • Canada
      • By Source
      • By Function
      • By Product Type
      • By Channel
      • By Claim
    • Market Attractiveness Analysis
      • By Country
      • By Source
      • By Function
      • By Product Type
      • By Channel
      • By Claim
    • Key Takeaways
  13. Latin America Market Analysis 2020 to 2024 and Forecast 2025 to 2035, By Country
    • Historical Market Size Value (USD Million) Trend Analysis By Market Taxonomy, 2020 to 2024
    • Market Size Value (USD Million) Forecast By Market Taxonomy, 2025 to 2035
      • By Country
        • Brazil
        • Mexico
        • Colombia
        • Rest of Latin America
      • By Source
      • By Function
      • By Product Type
      • By Channel
      • By Claim
    • Market Attractiveness Analysis
      • By Country
      • By Source
      • By Function
      • By Product Type
      • By Channel
      • By Claim
    • Key Takeaways
  14. Europe Market Analysis 2020 to 2024 and Forecast 2025 to 2035, By Country
    • Historical Market Size Value (USD Million) Trend Analysis By Market Taxonomy, 2020 to 2024
    • Market Size Value (USD Million) Forecast By Market Taxonomy, 2025 to 2035
      • By Country
        • Germany
        • UK
        • France
        • Italy
        • Spain
        • Belgium
        • Netherlands
        • Nordic
        • Switzerland
        • Russia
        • Poland
        • Rest of Europe
      • By Source
      • By Function
      • By Product Type
      • By Channel
      • By Claim
    • Market Attractiveness Analysis
      • By Country
      • By Source
      • By Function
      • By Product Type
      • By Channel
      • By Claim
    • Key Takeaways
  15. East Asia Market Analysis 2020 to 2024 and Forecast 2025 to 2035, By Country
    • Historical Market Size Value (USD Million) Trend Analysis By Market Taxonomy, 2020 to 2024
    • Market Size Value (USD Million) Forecast By Market Taxonomy, 2025 to 2035
      • By Country
        • China
        • Japan
        • South Korea
      • By Source
      • By Function
      • By Product Type
      • By Channel
      • By Claim
    • Market Attractiveness Analysis
      • By Country
      • By Source
      • By Function
      • By Product Type
      • By Channel
      • By Claim
    • Key Takeaways
  16. South Asia & Pacific Market Analysis 2020 to 2024 and Forecast 2025 to 2035, By Country
    • Historical Market Size Value (USD Million) Trend Analysis By Market Taxonomy, 2020 to 2024
    • Market Size Value (USD Million) Forecast By Market Taxonomy, 2025 to 2035
      • By Country
        • India
        • Thailand
        • Malaysia
        • Indonesia
        • Singapore
        • Vietnam
        • Australia
        • New Zealand
        • Rest of South Asia
      • By Source
      • By Function
      • By Product Type
      • By Channel
      • By Claim
    • Market Attractiveness Analysis
      • By Country
      • By Source
      • By Function
      • By Product Type
      • By Channel
      • By Claim
    • Key Takeaways
  17. Middle East and Africa Market Analysis 2020 to 2024 and Forecast 2025 to 2035, By Country
    • Historical Market Size Value (USD Million) Trend Analysis By Market Taxonomy, 2020 to 2024
    • Market Size Value (USD Million) Forecast By Market Taxonomy, 2025 to 2035
      • By Country
        • Turkey
        • UAE
        • Saudi Arabia
        • Israel
        • Other GCC Countries
        • North Africa
        • South Africa
      • By Source
      • By Function
      • By Product Type
      • By Channel
      • By Claim
    • Market Attractiveness Analysis
      • By Country
      • By Source
      • By Function
      • By Product Type
      • By Channel
      • By Claim
    • Key Takeaways
  18. Key Countries Market Analysis
    • USA
      • Pricing Analysis
      • Market Share Analysis, 2024
        • By Source
        • By Function
        • By Product Type
        • By Channel
        • By Claim
    • Canada
      • Pricing Analysis
      • Market Share Analysis, 2024
        • By Source
        • By Function
        • By Product Type
        • By Channel
        • By Claim
    • Mexico
      • Pricing Analysis
      • Market Share Analysis, 2024
        • By Source
        • By Function
        • By Product Type
        • By Channel
        • By Claim
    • Brazil
      • Pricing Analysis
      • Market Share Analysis, 2024
        • By Source
        • By Function
        • By Product Type
        • By Channel
        • By Claim
    • Germany
      • Pricing Analysis
      • Market Share Analysis, 2024
        • By Source
        • By Function
        • By Product Type
        • By Channel
        • By Claim
    • UK
      • Pricing Analysis
      • Market Share Analysis, 2024
        • By Source
        • By Function
        • By Product Type
        • By Channel
        • By Claim
    • Italy
      • Pricing Analysis
      • Market Share Analysis, 2024
        • By Source
        • By Function
        • By Product Type
        • By Channel
        • By Claim
    • Spain
      • Pricing Analysis
      • Market Share Analysis, 2024
        • By Source
        • By Function
        • By Product Type
        • By Channel
        • By Claim
    • France
      • Pricing Analysis
      • Market Share Analysis, 2024
        • By Source
        • By Function
        • By Product Type
        • By Channel
        • By Claim
    • India
      • Pricing Analysis
      • Market Share Analysis, 2024
        • By Source
        • By Function
        • By Product Type
        • By Channel
        • By Claim
    • Australia & New Zealand
      • Pricing Analysis
      • Market Share Analysis, 2024
        • By Source
        • By Function
        • By Product Type
        • By Channel
        • By Claim
    • China
      • Pricing Analysis
      • Market Share Analysis, 2024
        • By Source
        • By Function
        • By Product Type
        • By Channel
        • By Claim
    • Japan
      • Pricing Analysis
      • Market Share Analysis, 2024
        • By Source
        • By Function
        • By Product Type
        • By Channel
        • By Claim
    • South Korea
      • Pricing Analysis
      • Market Share Analysis, 2024
        • By Source
        • By Function
        • By Product Type
        • By Channel
        • By Claim
    • Russia
      • Pricing Analysis
      • Market Share Analysis, 2024
        • By Source
        • By Function
        • By Product Type
        • By Channel
        • By Claim
    • Poland
      • Pricing Analysis
      • Market Share Analysis, 2024
        • By Source
        • By Function
        • By Product Type
        • By Channel
        • By Claim
    • Hungary
      • Pricing Analysis
      • Market Share Analysis, 2024
        • By Source
        • By Function
        • By Product Type
        • By Channel
        • By Claim
    • Kingdom of Saudi Arabia
      • Pricing Analysis
      • Market Share Analysis, 2024
        • By Source
        • By Function
        • By Product Type
        • By Channel
        • By Claim
    • South Africa
      • Pricing Analysis
      • Market Share Analysis, 2024
        • By Source
        • By Function
        • By Product Type
        • By Channel
        • By Claim
  19. Market Structure Analysis
    • Competition Dashboard
    • Competition Benchmarking
    • Market Share Analysis of Top Players
      • By Regional
      • By Source
      • By Function
      • By Product Type
      • By Channel
      • By Claim
  20. Competition Analysis
    • Competition Deep Dive
      • Clariant
        • Overview
        • Product Portfolio
        • Profitability by Market Segments (Product/Age /Sales Channel/Region)
        • Sales Footprint
        • Strategy Overview
        • BASF
        • Ashland
        • Croda
        • Seppic
        • Givaudan
        • Bio Botanica
        • Aloecorp
        • Sabinsa
        • Desert Essence
    • Assumptions & Acronyms Used
    • Research Methodology

List of Tables

  • Table 1: Global Market Value (USD Million) Forecast by Region, 2020-2035
  • Table 2: Global Market Value (USD Million) Forecast by Source, 2020-2035
  • Table 3: Global Market Value (USD Million) Forecast by Function, 2020-2035
  • Table 4: Global Market Value (USD Million) Forecast by Product Type, 2020-2035
  • Table 5: Global Market Value (USD Million) Forecast by Channel, 2020-2035
  • Table 6: Global Market Value (USD Million) Forecast by Claim, 2020-2035
  • Table 7: North America Market Value (USD Million) Forecast by Country, 2020-2035
  • Table 8: North America Market Value (USD Million) Forecast by Source, 2020-2035
  • Table 9: North America Market Value (USD Million) Forecast by Function, 2020-2035
  • Table 10: North America Market Value (USD Million) Forecast by Product Type, 2020-2035
  • Table 11: North America Market Value (USD Million) Forecast by Channel, 2020-2035
  • Table 12: North America Market Value (USD Million) Forecast by Claim, 2020-2035
  • Table 13: Latin America Market Value (USD Million) Forecast by Country, 2020-2035
  • Table 14: Latin America Market Value (USD Million) Forecast by Source, 2020-2035
  • Table 15: Latin America Market Value (USD Million) Forecast by Function, 2020-2035
  • Table 16: Latin America Market Value (USD Million) Forecast by Product Type, 2020-2035
  • Table 17: Latin America Market Value (USD Million) Forecast by Channel, 2020-2035
  • Table 18: Latin America Market Value (USD Million) Forecast by Claim, 2020-2035
  • Table 19: Europe Market Value (USD Million) Forecast by Country, 2020-2035
  • Table 20: Europe Market Value (USD Million) Forecast by Source, 2020-2035
  • Table 21: Europe Market Value (USD Million) Forecast by Function, 2020-2035
  • Table 22: Europe Market Value (USD Million) Forecast by Product Type, 2020-2035
  • Table 23: Europe Market Value (USD Million) Forecast by Channel, 2020-2035
  • Table 24: Europe Market Value (USD Million) Forecast by Claim, 2020-2035
  • Table 25: East Asia Market Value (USD Million) Forecast by Country, 2020-2035
  • Table 26: East Asia Market Value (USD Million) Forecast by Source, 2020-2035
  • Table 27: East Asia Market Value (USD Million) Forecast by Function, 2020-2035
  • Table 28: East Asia Market Value (USD Million) Forecast by Product Type, 2020-2035
  • Table 29: East Asia Market Value (USD Million) Forecast by Channel, 2020-2035
  • Table 30: East Asia Market Value (USD Million) Forecast by Claim, 2020-2035
  • Table 31: South Asia & Pacific Market Value (USD Million) Forecast by Country, 2020-2035
  • Table 32: South Asia & Pacific Market Value (USD Million) Forecast by Source, 2020-2035
  • Table 33: South Asia & Pacific Market Value (USD Million) Forecast by Function, 2020-2035
  • Table 34: South Asia & Pacific Market Value (USD Million) Forecast by Product Type, 2020-2035
  • Table 35: South Asia & Pacific Market Value (USD Million) Forecast by Channel, 2020-2035
  • Table 36: South Asia & Pacific Market Value (USD Million) Forecast by Claim, 2020-2035
  • Table 37: Middle East and Africa Market Value (USD Million) Forecast by Country, 2020-2035
  • Table 38: Middle East and Africa Market Value (USD Million) Forecast by Source, 2020-2035
  • Table 39: Middle East and Africa Market Value (USD Million) Forecast by Function, 2020-2035
  • Table 40: Middle East and Africa Market Value (USD Million) Forecast by Product Type, 2020-2035
  • Table 41: Middle East and Africa Market Value (USD Million) Forecast by Channel, 2020-2035
  • Table 42: Middle East and Africa Market Value (USD Million) Forecast by Claim, 2020-2035

List of Figures

  • Figure 1: Global Market Pricing Analysis
  • Figure 2: Global Market Value (USD Million) Forecast 2020-2035
  • Figure 3: Global Market Value Share and BPS Analysis by Source, 2025 and 2035
  • Figure 4: Global Market Y-o-Y Growth Comparison by Source, 2025-2035
  • Figure 5: Global Market Attractiveness Analysis by Source
  • Figure 6: Global Market Value Share and BPS Analysis by Function, 2025 and 2035
  • Figure 7: Global Market Y-o-Y Growth Comparison by Function, 2025-2035
  • Figure 8: Global Market Attractiveness Analysis by Function
  • Figure 9: Global Market Value Share and BPS Analysis by Product Type, 2025 and 2035
  • Figure 10: Global Market Y-o-Y Growth Comparison by Product Type, 2025-2035
  • Figure 11: Global Market Attractiveness Analysis by Product Type
  • Figure 12: Global Market Value Share and BPS Analysis by Channel, 2025 and 2035
  • Figure 13: Global Market Y-o-Y Growth Comparison by Channel, 2025-2035
  • Figure 14: Global Market Attractiveness Analysis by Channel
  • Figure 15: Global Market Value Share and BPS Analysis by Claim, 2025 and 2035
  • Figure 16: Global Market Y-o-Y Growth Comparison by Claim, 2025-2035
  • Figure 17: Global Market Attractiveness Analysis by Claim
  • Figure 18: Global Market Value (USD Million) Share and BPS Analysis by Region, 2025 and 2035
  • Figure 19: Global Market Y-o-Y Growth Comparison by Region, 2025-2035
  • Figure 20: Global Market Attractiveness Analysis by Region
  • Figure 21: North America Market Incremental $ Opportunity, 2025-2035
  • Figure 22: Latin America Market Incremental $ Opportunity, 2025-2035
  • Figure 23: Europe Market Incremental $ Opportunity, 2025-2035
  • Figure 24: East Asia Market Incremental $ Opportunity, 2025-2035
  • Figure 25: South Asia & Pacific Market Incremental $ Opportunity, 2025-2035
  • Figure 26: Middle East and Africa Market Incremental $ Opportunity, 2025-2035
  • Figure 27: North America Market Value Share and BPS Analysis by Country, 2025 and 2035
  • Figure 28: North America Market Value Share and BPS Analysis by Source, 2025 and 2035
  • Figure 29: North America Market Y-o-Y Growth Comparison by Source, 2025-2035
  • Figure 30: North America Market Attractiveness Analysis by Source
  • Figure 31: North America Market Value Share and BPS Analysis by Function, 2025 and 2035
  • Figure 32: North America Market Y-o-Y Growth Comparison by Function, 2025-2035
  • Figure 33: North America Market Attractiveness Analysis by Function
  • Figure 34: North America Market Value Share and BPS Analysis by Product Type, 2025 and 2035
  • Figure 35: North America Market Y-o-Y Growth Comparison by Product Type, 2025-2035
  • Figure 36: North America Market Attractiveness Analysis by Product Type
  • Figure 37: North America Market Value Share and BPS Analysis by Channel, 2025 and 2035
  • Figure 38: North America Market Y-o-Y Growth Comparison by Channel, 2025-2035
  • Figure 39: North America Market Attractiveness Analysis by Channel
  • Figure 40: North America Market Value Share and BPS Analysis by Claim, 2025 and 2035
  • Figure 41: North America Market Y-o-Y Growth Comparison by Claim, 2025-2035
  • Figure 42: North America Market Attractiveness Analysis by Claim
  • Figure 43: Latin America Market Value Share and BPS Analysis by Country, 2025 and 2035
  • Figure 44: Latin America Market Value Share and BPS Analysis by Source, 2025 and 2035
  • Figure 45: Latin America Market Y-o-Y Growth Comparison by Source, 2025-2035
  • Figure 46: Latin America Market Attractiveness Analysis by Source
  • Figure 47: Latin America Market Value Share and BPS Analysis by Function, 2025 and 2035
  • Figure 48: Latin America Market Y-o-Y Growth Comparison by Function, 2025-2035
  • Figure 49: Latin America Market Attractiveness Analysis by Function
  • Figure 50: Latin America Market Value Share and BPS Analysis by Product Type, 2025 and 2035
  • Figure 51: Latin America Market Y-o-Y Growth Comparison by Product Type, 2025-2035
  • Figure 52: Latin America Market Attractiveness Analysis by Product Type
  • Figure 53: Latin America Market Value Share and BPS Analysis by Channel, 2025 and 2035
  • Figure 54: Latin America Market Y-o-Y Growth Comparison by Channel, 2025-2035
  • Figure 55: Latin America Market Attractiveness Analysis by Channel
  • Figure 56: Latin America Market Value Share and BPS Analysis by Claim, 2025 and 2035
  • Figure 57: Latin America Market Y-o-Y Growth Comparison by Claim, 2025-2035
  • Figure 58: Latin America Market Attractiveness Analysis by Claim
  • Figure 59: Europe Market Value Share and BPS Analysis by Country, 2025 and 2035
  • Figure 60: Europe Market Value Share and BPS Analysis by Source, 2025 and 2035
  • Figure 61: Europe Market Y-o-Y Growth Comparison by Source, 2025-2035
  • Figure 62: Europe Market Attractiveness Analysis by Source
  • Figure 63: Europe Market Value Share and BPS Analysis by Function, 2025 and 2035
  • Figure 64: Europe Market Y-o-Y Growth Comparison by Function, 2025-2035
  • Figure 65: Europe Market Attractiveness Analysis by Function
  • Figure 66: Europe Market Value Share and BPS Analysis by Product Type, 2025 and 2035
  • Figure 67: Europe Market Y-o-Y Growth Comparison by Product Type, 2025-2035
  • Figure 68: Europe Market Attractiveness Analysis by Product Type
  • Figure 69: Europe Market Value Share and BPS Analysis by Channel, 2025 and 2035
  • Figure 70: Europe Market Y-o-Y Growth Comparison by Channel, 2025-2035
  • Figure 71: Europe Market Attractiveness Analysis by Channel
  • Figure 72: Europe Market Value Share and BPS Analysis by Claim, 2025 and 2035
  • Figure 73: Europe Market Y-o-Y Growth Comparison by Claim, 2025-2035
  • Figure 74: Europe Market Attractiveness Analysis by Claim
  • Figure 75: East Asia Market Value Share and BPS Analysis by Country, 2025 and 2035
  • Figure 76: East Asia Market Value Share and BPS Analysis by Source, 2025 and 2035
  • Figure 77: East Asia Market Y-o-Y Growth Comparison by Source, 2025-2035
  • Figure 78: East Asia Market Attractiveness Analysis by Source
  • Figure 79: East Asia Market Value Share and BPS Analysis by Function, 2025 and 2035
  • Figure 80: East Asia Market Y-o-Y Growth Comparison by Function, 2025-2035
  • Figure 81: East Asia Market Attractiveness Analysis by Function
  • Figure 82: East Asia Market Value Share and BPS Analysis by Product Type, 2025 and 2035
  • Figure 83: East Asia Market Y-o-Y Growth Comparison by Product Type, 2025-2035
  • Figure 84: East Asia Market Attractiveness Analysis by Product Type
  • Figure 85: East Asia Market Value Share and BPS Analysis by Channel, 2025 and 2035
  • Figure 86: East Asia Market Y-o-Y Growth Comparison by Channel, 2025-2035
  • Figure 87: East Asia Market Attractiveness Analysis by Channel
  • Figure 88: East Asia Market Value Share and BPS Analysis by Claim, 2025 and 2035
  • Figure 89: East Asia Market Y-o-Y Growth Comparison by Claim, 2025-2035
  • Figure 90: East Asia Market Attractiveness Analysis by Claim
  • Figure 91: South Asia & Pacific Market Value Share and BPS Analysis by Country, 2025 and 2035
  • Figure 92: South Asia & Pacific Market Value Share and BPS Analysis by Source, 2025 and 2035
  • Figure 93: South Asia & Pacific Market Y-o-Y Growth Comparison by Source, 2025-2035
  • Figure 94: South Asia & Pacific Market Attractiveness Analysis by Source
  • Figure 95: South Asia & Pacific Market Value Share and BPS Analysis by Function, 2025 and 2035
  • Figure 96: South Asia & Pacific Market Y-o-Y Growth Comparison by Function, 2025-2035
  • Figure 97: South Asia & Pacific Market Attractiveness Analysis by Function
  • Figure 98: South Asia & Pacific Market Value Share and BPS Analysis by Product Type, 2025 and 2035
  • Figure 99: South Asia & Pacific Market Y-o-Y Growth Comparison by Product Type, 2025-2035
  • Figure 100: South Asia & Pacific Market Attractiveness Analysis by Product Type
  • Figure 101: South Asia & Pacific Market Value Share and BPS Analysis by Channel, 2025 and 2035
  • Figure 102: South Asia & Pacific Market Y-o-Y Growth Comparison by Channel, 2025-2035
  • Figure 103: South Asia & Pacific Market Attractiveness Analysis by Channel
  • Figure 104: South Asia & Pacific Market Value Share and BPS Analysis by Claim, 2025 and 2035
  • Figure 105: South Asia & Pacific Market Y-o-Y Growth Comparison by Claim, 2025-2035
  • Figure 106: South Asia & Pacific Market Attractiveness Analysis by Claim
  • Figure 107: Middle East and Africa Market Value Share and BPS Analysis by Country, 2025 and 2035
  • Figure 108: Middle East and Africa Market Value Share and BPS Analysis by Source, 2025 and 2035
  • Figure 109: Middle East and Africa Market Y-o-Y Growth Comparison by Source, 2025-2035
  • Figure 110: Middle East and Africa Market Attractiveness Analysis by Source
  • Figure 111: Middle East and Africa Market Value Share and BPS Analysis by Function, 2025 and 2035
  • Figure 112: Middle East and Africa Market Y-o-Y Growth Comparison by Function, 2025-2035
  • Figure 113: Middle East and Africa Market Attractiveness Analysis by Function
  • Figure 114: Middle East and Africa Market Value Share and BPS Analysis by Product Type, 2025 and 2035
  • Figure 115: Middle East and Africa Market Y-o-Y Growth Comparison by Product Type, 2025-2035
  • Figure 116: Middle East and Africa Market Attractiveness Analysis by Product Type
  • Figure 117: Middle East and Africa Market Value Share and BPS Analysis by Channel, 2025 and 2035
  • Figure 118: Middle East and Africa Market Y-o-Y Growth Comparison by Channel, 2025-2035
  • Figure 119: Middle East and Africa Market Attractiveness Analysis by Channel
  • Figure 120: Middle East and Africa Market Value Share and BPS Analysis by Claim, 2025 and 2035
  • Figure 121: Middle East and Africa Market Y-o-Y Growth Comparison by Claim, 2025-2035
  • Figure 122: Middle East and Africa Market Attractiveness Analysis by Claim
  • Figure 123: Global Market - Tier Structure Analysis
  • Figure 124: Global Market - Company Share Analysis

Frequently Asked Questions

How big is the Biomimetic Collagen Synthesis Market in 2025?

The global biomimetic collagen synthesis market is estimated to be valued at USD 1,410.5 million in 2025.

What will be the size of the Biomimetic Collagen Synthesis Market in 2035?

The market size for the biomimetic collagen synthesis market is projected to reach USD 4,753.1 million by 2035.

How much will be the Biomimetic Collagen Synthesis Market growth between 2025 and 2035?

The biomimetic collagen synthesis market is expected to grow at a CAGR of 12.9% between 2025 and 2035.

What are the key product types in the Biomimetic Collagen Synthesis Market?

The key product types in the biomimetic collagen synthesis market include serums, creams/lotions, capsules, and masks.

Which functional segment is expected to contribute the largest share in the Biomimetic Collagen Synthesis Market in 2025?

In terms of function, collagen boosting is anticipated to command the largest share at 56.6% in the biomimetic collagen synthesis market in 2025.

Explore Similar Insights

Future Market Insights

Biomimetic Collagen Synthesis Market

Chat With

MaRIA

Hi There, I am MaRIA, Your Market Research Intelligence Assistant. How may I help you?