Carbon-Neutral Skincare Ingredients Market Size and Share Forecast Outlook 2025 to 2035

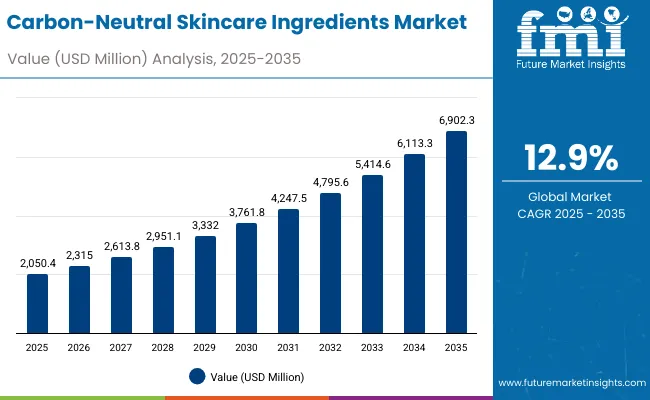
The Carbon-Neutral Skincare Ingredients Market is expected to record a valuation of USD 2,050.4 million in 2025 and USD 6,902.3 million in 2035, with an increase of USD 4,851.9 million, which equals a growth of more than 193% over the decade. The overall expansion represents a CAGR of 12.9% and a 3X increase in market size.
Quick Stats for Carbon-Neutral Skincare Ingredients Market

  • Carbon-Neutral Skincare Ingredients Market Value (2025): USD 2,050.4 million
  • Carbon-Neutral Skincare Ingredients Market Forecast Value (2035): USD 6,902.3 million
  • Carbon-Neutral Skincare Ingredients Market Forecast CAGR: 12.9%
  • Carbon-Neutral Skincare Ingredients Market Leading Segment in 2025: Carbon-neutral certified (52.3%)
  • Key Growth Regions: China, India, Japan, USA, Europe (Germany, UK)
  • Top Key Players: Unilever, L’Oréal, The Body Shop, BASF, Givaudan, DSM-Firmenich, Croda, Clariant, Procter & Gamble, Seppic

Carbon Neutral Skincare Ingredients Market

Carbon-Neutral Skincare Ingredients Market Key Takeaways

Metric Value
Carbon-Neutral Skincare Ingredients Market Estimated Value in (2025E) USD 2,050.4 million
Carbon-Neutral Skincare Ingredients Market Forecast Value in (2035F) USD 6,902.3 million
Forecast CAGR (2025 to 2035) 12.9%

During the first five-year period from 2025 to 2030, the market increases from USD 2,050.4 million to USD 3,761.8 million, adding USD 1,711.4 million, which accounts for over 35% of the total decade growth. This phase records steady adoption of carbon-neutral formulations across hydration-focused products, sun care, and creams/lotions, driven by demand from consumers aligning beauty purchases with sustainability pledges. E-commerce dominates in this period as it caters to over 48% of global distribution, becoming the most important channel for eco-conscious beauty.

The second half from 2030 to 2035 contributes USD 3,140.5 million, equal to 65% of total growth, as the market jumps from USD 3,761.8 million to USD 6,902.3 million. This acceleration is powered by widespread certification adoption, rapid innovation in fermentation-derived actives, and the scaling of upcycled byproduct extracts in premium formulations. China and India spearhead global demand, with CAGRs of 19.8% and 23.6% respectively, making Asia the fastest-growing regional cluster. Premium retail and natural/organic beauty stores gain share in this phase, but e-commerce retains leadership due to its global reach.

From 2020 to 2024, the Carbon-Neutral Skincare Ingredients Market grew steadily as eco-conscious beauty shifted from niche to mainstream. During this period, the competitive landscape was dominated by multinational consumer goods leaders, with Unilever and L’Oréal driving sustainability narratives and certification programs. Competitive differentiation relied heavily on carbon accounting, traceable sourcing, and low-impact production of skincare actives. Carbon-neutral certification moved from a marketing label to a core purchase driver, supported by the rise of digital marketplaces where eco-labels strongly influenced consumer choices.

Demand is expected to expand to USD 2,050.4 million in 2025, with the revenue mix increasingly tilted toward certified formulations, which account for more than half of the market. Traditional leaders face mounting competition from ingredient manufacturers like BASF, Croda, and DSM-Firmenich, who are embedding circularity and biotechnology at the supply chain level. Emerging entrants, including eco-conscious start-ups leveraging upcycled ingredients and fermentation technologies, are gaining visibility. The competitive advantage is shifting from scale alone to credibility in carbon reporting, certification partnerships, and the ability to integrate sustainability into both mass-market and premium product lines.

Why the Carbon-Neutral Skincare Ingredients Market is Growing?

Advances in sustainable ingredient innovation have improved both performance and environmental impact, allowing for more efficient formulation of eco-conscious skincare products. Hydration-focused actives have gained popularity due to their broad suitability across skin types and climates, accounting for 48.8% of global market share in 2025 (USD 993.9 million). The rise of fermentation-derived actives and mineral-based UV protectants has contributed to enhanced efficacy and stability, while also lowering the carbon footprint of production. Industries such as premium beauty, personal care, and pharmaceutical skincare are driving demand for carbon-neutral solutions that integrate seamlessly with existing consumer preferences for high-performance and natural formulations.

Expansion of carbon-neutral certification and eco-conscious initiatives has fueled market growth, with certified products already contributing 52.3% of value in 2025 (USD 1,076.8 million). Innovations in upcycled byproduct extracts and plant oils are expected to open new application areas, particularly in masks and sun care. Segment growth is expected to be led by carbon-neutral certified formulations, hydration-focused functions, and e-commerce channels, due to their precision targeting of eco-conscious buyers and adaptability to digital-first retail environments. By 2035, the market will be strongly defined by Asia-Pacific leadership, as countries such as India (CAGR 23.6%) and China (CAGR 19.8%) accelerate adoption through scalable, cost-effective innovations.

Segmental Analysis

The market is segmented by ingredient type, function, certification, product type, channel, and region. Ingredient types include plant oils & butters, fermentation-derived actives, mineral-based UV protectants, and upcycled byproduct extracts, highlighting the sustainable raw materials driving adoption. Functional categories cover anti-aging, hydration, brightening, and UV protection, designed to address diverse consumer skincare needs. Based on certification, the segmentation includes carbon-neutral certified, net-zero pledge brands, and eco-conscious initiatives, reflecting varying levels of climate accountability and sustainability commitments.

In terms of product type, the market spans serums, creams/lotions, masks, and sun care, which represent the leading commercial formats for carbon-neutral ingredients. Distribution channels include e-commerce, natural/organic beauty retail, pharmacies, and premium retail, each playing a critical role in shaping access and consumer trust. Regionally, the scope spans North America, Europe, Asia-Pacific, Latin America, and Middle East & Africa. At the country level, coverage includes the United States, Canada, Germany, France, United Kingdom, China, Japan, India, Brazil, and South Africa.
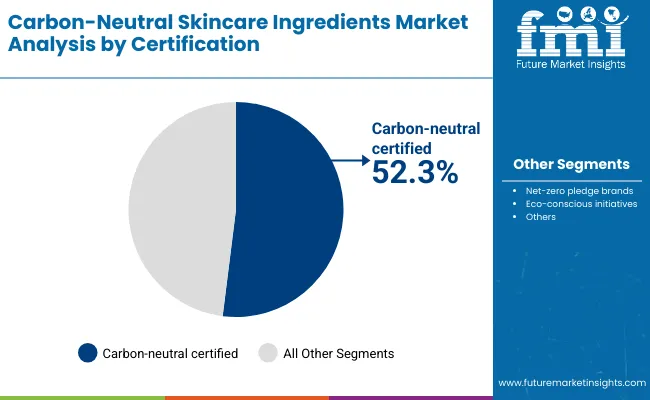
Insights into the Certification Segment with Carbon-Neutral Certified Leading in Market Share

Carbon Neutral Skincare Ingredients Market By Certification

Certification Value Share% 2025
Carbon-neutral certified 52.3%
Others 47.7%

Carbon-neutral certified products account for over half of global value in 2025. This dominance reflects the rising importance of third-party validation in consumer decision-making. Brands leveraging certification are not only targeting environmentally conscious buyers but also using it as a trust-building mechanism in premium and mass-market lines.
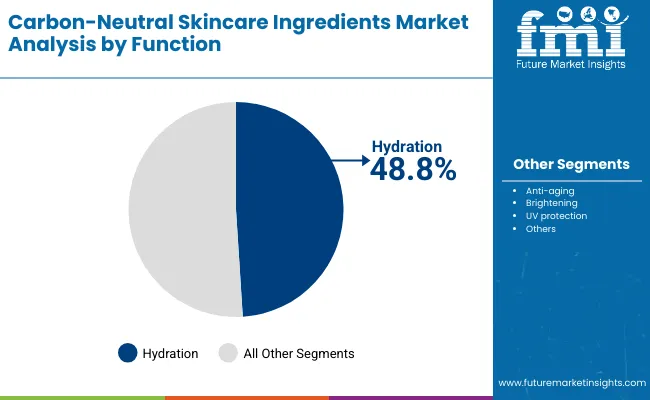
Insights into the Function Segment with Hydration Dominating the Demand

Carbon Neutral Skincare Ingredients Market By Function

Function Value Share% 2025
Hydration 48.8%
Others 51.2%

Hydration is the most sought-after function in carbon-neutral skincare. This dominance stems from increasing awareness of skin health, hydration-barrier repair, and climate-adaptive beauty products. The use of fermentation-derived actives and plant oils aligns with both efficacy and sustainability, reinforcing hydration as the leading functional demand driver.
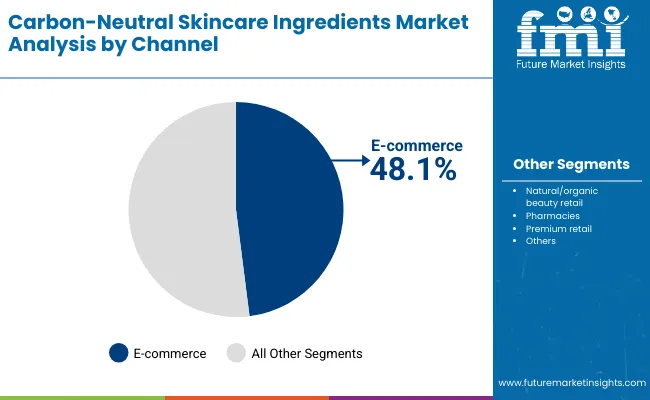
Insights into the Channel Segment with E-commerce Leading in Distribution

Carbon Neutral Skincare Ingredients Market By Channel

Channel Value Share% 2025
E-commerce 48.1%
Others 51.9%

E-commerce leads as the top distribution channel, reflecting digital-native beauty consumption patterns and the importance of online platforms in showcasing sustainability metrics. With consumers increasingly checking carbon-neutral claims online, platforms serve as both sales and education channels.

What are the Drivers, Restraints, and Key Trends of the Carbon-Neutral Skincare Ingredients Market?

Drivers

Rising Share of Carbon-Neutral Certification

The market is being driven by the rapid uptake of carbon-neutral certified products, which already account for more than USD 1,076.8 million in 2025. This certification is no longer a symbolic label but a competitive necessity for brands aiming to establish credibility in eco-conscious beauty. Players such as Unilever and L’Oréal are accelerating their investment in third-party certifications and carbon footprint audits to capture premium positioning.

Certification resonates most strongly in North America and Europe, where regulatory scrutiny and consumer activism push brands to validate sustainability claims. In Asia-Pacific, especially in China and Japan, carbon-neutral labeling is emerging as a differentiator for premium skincare, where rising disposable incomes align with ethical purchasing. This creates a double-layered growth driver: consumer willingness to pay more for verified carbon-neutral products, and multinational companies investing aggressively to meet this demand.

Fermentation-Derived Actives and Upcycled Ingredients Driving Functional Innovation

Fermentation-derived actives and upcycled byproduct extracts are rapidly scaling as ingredient categories because they directly address both sustainability and efficacy. Fermentation processes allow the production of potent anti-aging and brightening actives with reduced carbon footprints, while upcycled extracts enable brands to create “zero-waste” formulations that appeal to eco-conscious buyers. These innovations particularly support hydration products, which hold a 48.8% share in 2025 (USD 993.9 million), as well as anti-aging products in mature markets like the USA, Japan, and Germany.

Brands like DSM-Firmenich and Givaudan are investing in biotech fermentation platforms, while Croda and Seppic are leveraging food and beverage byproducts for skincare actives. This functional-ingredient innovation cycle is a structural growth driver because it links environmental responsibility with tangible product performance something consumers increasingly demand.

Restraints

High Cost of Certification and Low Adoption Among Emerging Brands

Despite the dominance of certified products, the costs associated with achieving carbon-neutral certification remain a barrier for emerging brands and smaller players. Certification involves extensive auditing, supply chain transparency, and recurring compliance costs. As a result, eco-conscious initiatives without official certification still account for 47.7% of the market (USD 979.0 million in 2025), reflecting cost-driven avoidance by many players. This limits the inclusivity of certification-driven growth and slows adoption in price-sensitive markets like India and Latin America, where affordability is a key consumer concern.

Regional Disparities in Growth and Carbon Accounting Standards

The market’s growth is uneven across geographies. While India and China post strong CAGRs of 23.6% and 19.8% respectively, mature markets like the USA (9.1%) and Germany (10.1%) show slower momentum. This divergence is exacerbated by inconsistent carbon accounting frameworks across regions. For example, Europe requires stringent proof of emission offsets, while some Asian markets allow self-declared eco-conscious initiatives. This regulatory disparity creates confusion for global brands trying to harmonize claims and slows the scaling of standardized product lines across multiple geographies.

Key Trends

Hydration as the Leading Gateway for Carbon-Neutral Skincare

Hydration dominates global demand with 48.8% share in 2025 (USD 993.9 million), making it the key entry point for carbon-neutral skincare. Unlike anti-aging or UV protection, hydration appeals universally across age groups and climates. In China, hydration accounts for over 51.3% of the functional demand, showing its cultural centrality. Brands are layering sustainability messaging onto hydration claims, positioning products as both skin-barrier supporting and environmentally safe. This trend is expected to sustain leadership into 2035, reinforcing hydration as the foundational category for eco-conscious adoption.

E-Commerce as the Leading Carbon-Neutral Storytelling Channel

With 48.1% share in 2025 (USD 993.9 million), e-commerce is more than a sales platform it is the primary channel for sustainability storytelling. Online beauty retailers and DTC brands are now highlighting carbon footprint reductions, certification badges, and eco-score labeling in product pages. This trend is particularly impactful in Asia, where platforms like Tmall, Lazada, and Rakuten are integrating carbon-neutral categories as premium product clusters. By 2035, e-commerce is expected to remain the dominant channel, supported by algorithm-driven product recommendations that highlight sustainability claims.
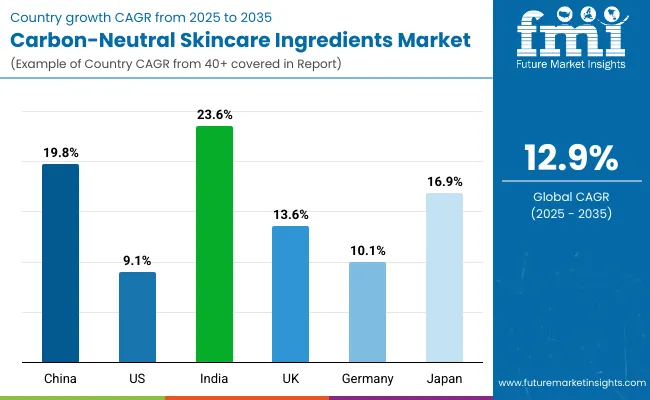
Analysis of Carbon-Neutral Skincare Ingredients Market By Key Countries

Carbon Neutral Skincare Ingredients Market By Country

Countries Estimated CAGR (2025 to 2035)
China 19.8%
USA 9.1%
India 23.6%
UK 13.6%
Germany 10.1%
Japan 16.9%

The Carbon-Neutral Skincare Ingredients Market shows sharp contrasts in growth dynamics across key countries. India emerges as the fastest-growing market with a projected CAGR of 23.6%, supported by rising disposable incomes, the rapid adoption of natural and eco-conscious beauty among younger consumers, and government-backed sustainability programs encouraging local sourcing of plant-based and upcycled ingredients.

China follows with a robust 19.8% CAGR, fueled by its massive consumer base, accelerated certification adoption, and e-commerce platforms actively promoting carbon-neutral categories as premium offerings. Japan, with a CAGR of 16.9%, reflects a strong alignment between cultural values of minimalism and biotech innovation, particularly fermentation-derived actives and mineral-based UV protectants, making it a highly influential trend-setting market in Asia-Pacific.

In contrast, mature Western markets demonstrate slower but stable growth trajectories. The USA posts a CAGR of 9.1%, indicating market maturity, where carbon-neutral products are already mainstream but face competitive pressures from established multinational brands. Germany, with a 10.1% CAGR, remains Europe’s anchor market, driven by regulatory rigor and consumer insistence on verified certifications.

The UK, posting 13.6% CAGR, balances innovation and retail-driven adoption, benefiting from the country’s strong natural/organic beauty retail landscape and consumer affinity for certified eco-conscious products. Collectively, these figures underline a global shift in growth leadership toward Asia-Pacific, while Europe and North America maintain market share through certification credibility and established sustainability practices.
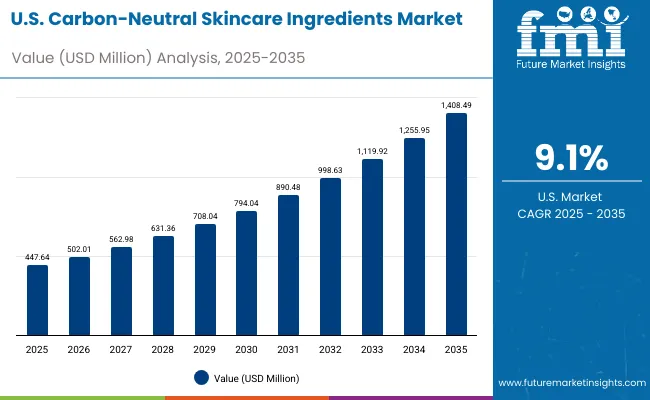
Sales Outlook for Carbon-Neutral Skincare Ingredients in the United States

Carbon Neutral Skincare Ingredients Market Usa

Year USA Carbon-Neutral Skincare Ingredients Market (USD Million)
2025 447.64
2026 502.01
2027 562.98
2028 631.36
2029 708.04
2030 794.04
2031 890.48
2032 998.63
2033 1,119.92
2034 1,255.95
2035 1,408.49

The Carbon-Neutral Skincare Ingredients Market in the United States is projected to grow at a CAGR of 9.1%, led by the strong demand for certified carbon-neutral formulations. With carbon-neutral certified products already accounting for 55.1% of market share in 2025 (USD 246.7 million), the USA consumer base is demonstrating clear preference for products with third-party validation. Growth is being driven by premium skincare categories such as serums and creams/lotions, where eco-labeling strongly influences purchase decisions.

Hydration and anti-aging functions dominate, while e-commerce and pharmacies are the most prominent channels for adoption. Multinational players including Unilever, L’Oréal, and Procter & Gamble are expanding their climate-neutral roadmaps in the USA, investing heavily in ingredient traceability and upcycled formulations.

  • Carbon-neutral certified formulations lead adoption with 55% market share in 2025.
  • E-commerce and pharmacy chains are core distribution hubs for eco-conscious consumers.
  • Premium skincare formats such as serums and creams are driving certified ingredient demand.

Growth and Expansion Outlook for Carbon-Neutral Skincare Ingredients in the United Kingdom

The Carbon-Neutral Skincare Ingredients Market in the United Kingdom is expected to grow at a CAGR of 13.6%, supported by consumer affinity for sustainability certifications and a mature natural/organic beauty retail landscape. Premium retail outlets and eco-focused specialty stores have integrated carbon impact labels, reinforcing the demand for certified ingredients. UK consumers show strong adoption of hydration and brightening functions, supported by fermentation-derived actives and mineral-based UV protectants. Government-backed sustainability initiatives and academic collaboration with biotech labs continue to strengthen the innovation pipeline.

  • Premium retail outlets and eco-focused stores are mainstreaming carbon impact labeling.
  • Brightening and hydration categories lead consumer demand for sustainable formulations.
  • Regulatory pressure and sustainability programs are accelerating certified adoption.

Growth and Expansion Outlook for Carbon-Neutral Skincare Ingredients in India

India is witnessing the fastest growth in the Carbon-Neutral Skincare Ingredients Market, forecast to expand at a CAGR of 23.6% through 2035. A surge in demand from urban millennials and Gen Z consumers is driving rapid adoption, particularly for hydration and brightening products. Tier-2 and Tier-3 cities are emerging as growth hubs, supported by cost-effective launches of eco-certified skincare lines. Local brands are increasingly adopting upcycled byproduct extracts to lower production costs and appeal to eco-conscious younger buyers. Educational campaigns and rising e-commerce penetration further amplify awareness.
  • Demand is accelerating in Tier-2 and Tier-3 cities via affordable eco-certified products.
  • Hydration and brightening products dominate India’s functional demand.
  • Local brands are innovating with upcycled ingredients to match affordability and sustainability.

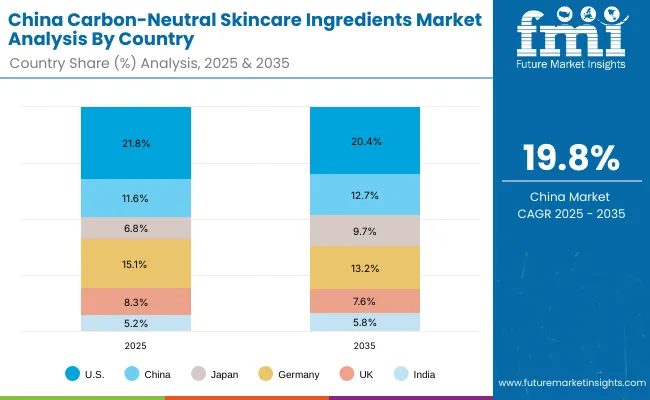
Sales Outlook for Carbon-Neutral Skincare Ingredients in China

Carbon Neutral Skincare Ingredients Market China

Countries 2025 Share (%)
USA 21.8%
China 11.6%
Japan 6.8%
Germany 15.1%
UK 8.3%
India 5.2%
Countries 2035 Share (%)
USA 20.4%
China 12.7%
Japan 9.7%
Germany 13.2%
UK 7.6%
India 5.8%

The Carbon-Neutral Skincare Ingredients Market in China is expected to grow at a CAGR of 19.8%, among the highest worldwide. This momentum is driven by the integration of carbon-neutral labels on hydration products, which already account for 51.3% share in 2025 (USD 122.6 million). E-commerce platforms such as Tmall and JD.com are amplifying certified beauty categories, often positioning them as premium offerings. Urban consumers are showing strong preference for fermentation-derived actives and mineral-based UV protectants, while government policies encourage climate-aligned product innovations. Local ingredient suppliers are also developing affordable, carbon-conscious alternatives that enable mass-market adoption.
  • Hydration leads with over 51% share of function demand in 2025.
  • E-commerce giants are positioning certified skincare as premium digital categories.
  • Local suppliers are creating cost-effective sustainable actives to broaden accessibility.

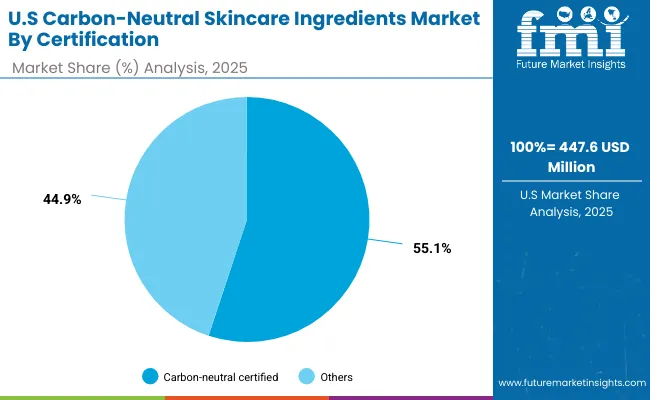
Growth Outlook for Carbon-Neutral Skincare Ingredients Market in the United States

Carbon Neutral Skincare Ingredients Market Usa 2

USA by Certification Value Share% 2025
Carbon-neutral certified 55.1%
Others 44.9%

The Carbon-Neutral Skincare Ingredients Market in the United States is projected at USD 447.6 million in 2025, growing to USD 1,408.5 million by 2035 at a CAGR of 9.1%. Carbon-neutral certified formulations contribute 55.1% (USD 246.7 million), while non-certified eco-conscious initiatives hold the remaining 44.9% (USD 200.9 million). This indicates a strong consumer preference for verifiable certification rather than unverified claims. Certification adoption is particularly high in premium skincare lines such as serums and creams/lotions, where third-party validation drives brand trust and willingness to pay.

The shift toward certification is reinforced by regulatory scrutiny and consumer watchdog groups demanding transparent carbon accounting. USA buyers increasingly prioritize hydration and anti-aging functions, aligning with demographic demand for skin health and longevity. E-commerce remains the leading channel, supported by pharmacies expanding their eco-certified assortments. As multinational corporations scale traceable sourcing and carbon accounting, the USA market is expected to consolidate around brands that combine efficacy, certification, and sustainability narratives.
  • Market size in the USA in 2025: USD 447.6 million
  • Carbon-neutral certified leads at 55.1% vs. 44.9%
  • Growth supported by consumer trust in certification and premium hydration/anti-aging demand

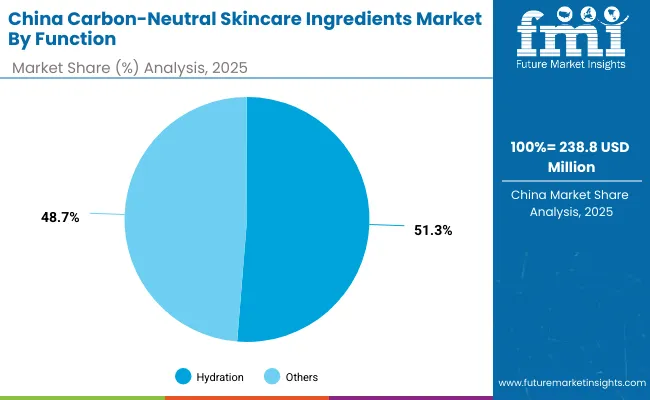
Opportunity Analysis of China Carbon-Neutral Skincare Ingredients Market

Carbon Neutral Skincare Ingredients Market China 2

China by Function Value Share% 2025
Hydration 51.3%
Others 48.7%

The Carbon-Neutral Skincare Ingredients Market in China is projected at USD 238.8 million in 2025, with a CAGR of 19.8%, one of the highest globally. Hydration dominates with a 51.3% share (USD 122.6 million), reflecting strong consumer preference for functional, barrier-supportive formulations in an urbanizing and pollution-sensitive environment. Brightening and UV protection functions also gain traction, but hydration is central to mass adoption.

China’s leadership in digital-first retail is accelerating this momentum. Platforms like Tmall and JD.com actively highlight carbon-neutral categories, treating them as premium offerings and embedding sustainability scores in product recommendations. Domestic ingredient suppliers are increasingly offering affordable fermentation-derived actives and upcycled extracts, making sustainable formulations accessible to middle-income consumers. Government policies promoting low-carbon product innovation further reinforce this growth trajectory.
  • Market size in China in 2025: USD 238.8 million
  • Hydration leads with 51.3% share
  • Growth driven by e-commerce visibility, biotech innovation, and policy-backed sustainability

Competitive Landscape of the Carbon-Neutral Skincare Ingredients Market

Carbon Neutral Skincare Ingredients Market By Company

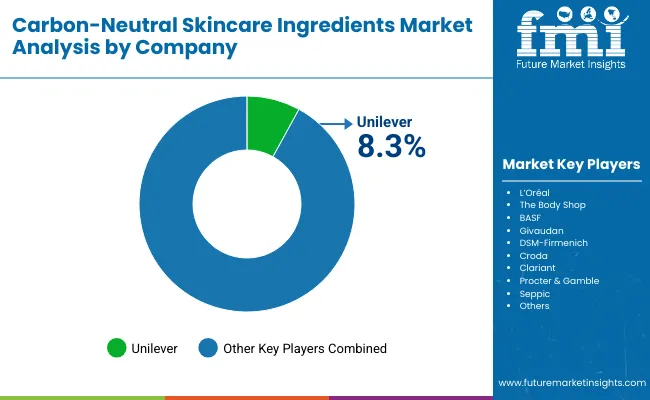
The Carbon-Neutral Skincare Ingredients Market is moderately fragmented, with multinational consumer goods leaders, ingredient suppliers, and niche-focused eco-innovators competing across diverse functions and regions. Unilever holds 8.3% of global market value in 2025, making it the single largest player, while the remaining 91.7% is distributed among other leading corporations and emerging challengers.

Consumer goods giants such as Unilever, L’Oréal, Procter & Gamble, and The Body Shop dominate mass adoption through large-scale certified product lines, strong e-commerce penetration, and visible sustainability pledges. Ingredient innovators like BASF, DSM-Firmenich, Croda, Givaudan, Clariant, and Seppic hold competitive strength by embedding biotech fermentation, upcycled actives, and carbon-neutral production at the supply chain level. Their role is increasingly critical as brands demand certified, low-carbon inputs to differentiate product portfolios.

Smaller eco-conscious brands and start-ups are carving space with specialized innovations in upcycled byproduct extracts, localized ingredient sourcing, and subscription-based distribution models. These players excel at storytelling and consumer engagement, particularly in Asia-Pacific and Europe. Competitive differentiation is moving away from price and formulation alone toward a complete ecosystem approach: carbon-neutral certification, traceable supply chains, and digital-first retail partnerships. By 2035, players with robust carbon reporting and integration of AI-driven life-cycle analysis will likely lead global market share growth.

Key Developments in Carbon-Neutral Skincare Ingredients Market

  • On March 14, 2024, Unilever launched its first fully carbon-neutral skincare ingredient portfolio under its Dove brand, integrating certified plant oils and fermentation-derived actives. The company committed to scaling these formulations across North America and Europe by 2026.
  • On May 22, 2024, L’Oréal announced a partnership with LanzaTech to commercialize fermentation-derived skincare actives using captured carbon emissions, positioning it as a breakthrough in upcycled carbon-to-beauty technology.

Scope of the Report

Item Value
Quantitative Units USD 2,050.4 Million
Ingredient Type Plant oils & butters, Fermentation-derived actives, Mineral-based UV protectants, Upcycled byproduct extracts
Function Anti-aging, Hydration, Brightening, UV protection
Certification Carbon-neutral certified, Net-zero pledge brands, Eco-conscious initiatives
Product Type Serums, Creams/lotions, Masks, Sun care
Channel E-commerce, Natural/organic beauty retail, Pharmacies, Premium retail
Regions Covered North America, Europe, Asia-Pacific, Latin America, Middle East & Africa
Country Covered United States, Canada, Germany, France, United Kingdom, China, Japan, India, Brazil, South Africa
Key Companies Profiled Unilever, L’Oréal, The Body Shop, BASF, Givaudan, DSM- Firmenich, Croda, Clariant, Procter & Gamble, Seppic
Additional Attributes Dollar sales by certification, function, and channel; rapid adoption of hydration-focused formulations; growing use of fermentation-derived actives and upcycled byproduct extracts; increasing role of carbon-neutral certification in premium and mass-market skincare; expansion of e-commerce sustainability labeling; regional leadership from Asia-Pacific (China, India, Japan) alongside steady North American and European demand; and ongoing innovations in mineral-based UV protectants a nd biotechnology-driven actives.

Key Segments

By Ingredient Type:

  • Plant oils & butters
  • Fermentation-derived actives
  • Mineral-based UV protectants
  • Upcycled byproduct extracts

By Function:

  • Anti-aging
  • Hydration
  • Brightening
  • UV protection

By Certification:

  • Carbon-neutral certified
  • Net-zero pledge brands
  • Eco-conscious initiatives

By Product Type:

  • Serums
  • Creams/lotions
  • Masks
  • Sun care

By Channel:

  • E-commerce
  • Natural/organic beauty retail
  • Pharmacies
  • Premium retail

By Region:

  • North America
  • Latin America
  • Europe
  • East Asia
  • South Asia & Pacific
  • Middle East and Africa

Table of Content

  1. Executive Summary
    • Global Market Outlook
    • Demand-side Trends
    • Supply-side Trends
    • Technology Roadmap Analysis
    • Analysis and Recommendations
  2. Market Overview
    • Market Coverage / Taxonomy
    • Market Definition / Scope / Limitations
  3. Market Background
    • Market Dynamics
      • Drivers
      • Restraints
      • Opportunity
      • Trends
    • Scenario Forecast
      • Demand in Optimistic Scenario
      • Demand in Likely Scenario
      • Demand in Conservative Scenario
    • Opportunity Map Analysis
    • Product Life Cycle Analysis
    • Supply Chain Analysis
    • Investment Feasibility Matrix
    • Value Chain Analysis
    • PESTLE and Porter’s Analysis
    • Regulatory Landscape
    • Regional Parent Market Outlook
    • Production and Consumption Statistics
    • Import and Export Statistics
  4. Global Market Analysis 2020 to 2024 and Forecast, 2025 to 2035
    • Historical Market Size Value (USD Million) Analysis, 2020 to 2024
    • Current and Future Market Size Value (USD Million) Projections, 2025 to 2035
      • Y-o-Y Growth Trend Analysis
      • Absolute $ Opportunity Analysis
  5. Global Market Pricing Analysis 2020 to 2024 and Forecast 2025 to 2035
  6. Global Market Analysis 2020 to 2024 and Forecast 2025 to 2035, By Ingredient Type
    • Introduction / Key Findings
    • Historical Market Size Value (USD Million) Analysis By Ingredient Type, 2020 to 2024
    • Current and Future Market Size Value (USD Million) Analysis and Forecast By Ingredient Type, 2025 to 2035
      • Plant oils & butters
      • Fermentation-derived actives
      • Mineral-based UV protectants
      • Upcycled byproduct extracts
    • Y-o-Y Growth Trend Analysis By Ingredient Type, 2020 to 2024
    • Absolute $ Opportunity Analysis By Ingredient Type, 2025 to 2035
  7. Global Market Analysis 2020 to 2024 and Forecast 2025 to 2035, By Function
    • Introduction / Key Findings
    • Historical Market Size Value (USD Million) Analysis By Function, 2020 to 2024
    • Current and Future Market Size Value (USD Million) Analysis and Forecast By Function, 2025 to 2035
      • Anti-aging
      • Hydration
      • Brightening
      • UV protection
    • Y-o-Y Growth Trend Analysis By Function, 2020 to 2024
    • Absolute $ Opportunity Analysis By Function, 2025 to 2035
  8. Global Market Analysis 2020 to 2024 and Forecast 2025 to 2035, By Certification
    • Introduction / Key Findings
    • Historical Market Size Value (USD Million) Analysis By Certification, 2020 to 2024
    • Current and Future Market Size Value (USD Million) Analysis and Forecast By Certification, 2025 to 2035
      • Carbon-neutral certified
      • Net-zero pledge brands
      • Eco-conscious initiatives
    • Y-o-Y Growth Trend Analysis By Certification, 2020 to 2024
    • Absolute $ Opportunity Analysis By Certification, 2025 to 2035
  9. Global Market Analysis 2020 to 2024 and Forecast 2025 to 2035, By Product Type
    • Introduction / Key Findings
    • Historical Market Size Value (USD Million) Analysis By Product Type, 2020 to 2024
    • Current and Future Market Size Value (USD Million) Analysis and Forecast By Product Type, 2025 to 2035
      • Serums
      • Creams/lotions
      • Masks
      • Sun care
    • Y-o-Y Growth Trend Analysis By Product Type, 2020 to 2024
    • Absolute $ Opportunity Analysis By Product Type, 2025 to 2035
  10. Global Market Analysis 2020 to 2024 and Forecast 2025 to 2035, By Channel
    • Introduction / Key Findings
    • Historical Market Size Value (USD Million) Analysis By Channel, 2020 to 2024
    • Current and Future Market Size Value (USD Million) Analysis and Forecast By Channel, 2025 to 2035
      • E-commerce
      • Natural/organic beauty retail
      • Pharmacies
      • Premium retail
    • Y-o-Y Growth Trend Analysis By Channel, 2020 to 2024
    • Absolute $ Opportunity Analysis By Channel, 2025 to 2035
  11. Global Market Analysis 2020 to 2024 and Forecast 2025 to 2035, By Region
    • Introduction
    • Historical Market Size Value (USD Million) Analysis By Region, 2020 to 2024
    • Current Market Size Value (USD Million) Analysis and Forecast By Region, 2025 to 2035
      • North America
      • Latin America
      • Europe
      • East Asia
      • South Asia & Pacific
      • Middle East and Africa
    • Market Attractiveness Analysis By Region
  12. North America Market Analysis 2020 to 2024 and Forecast 2025 to 2035, By Country
    • Historical Market Size Value (USD Million) Trend Analysis By Market Taxonomy, 2020 to 2024
    • Market Size Value (USD Million) Forecast By Market Taxonomy, 2025 to 2035
      • By Country
        • USA
        • Canada
      • By Ingredient Type
      • By Function
      • By Certification
      • By Product Type
      • By Channel
    • Market Attractiveness Analysis
      • By Country
      • By Ingredient Type
      • By Function
      • By Certification
      • By Product Type
      • By Channel
    • Key Takeaways
  13. Latin America Market Analysis 2020 to 2024 and Forecast 2025 to 2035, By Country
    • Historical Market Size Value (USD Million) Trend Analysis By Market Taxonomy, 2020 to 2024
    • Market Size Value (USD Million) Forecast By Market Taxonomy, 2025 to 2035
      • By Country
        • Brazil
        • Mexico
        • Colombia
        • Rest of Latin America
      • By Ingredient Type
      • By Function
      • By Certification
      • By Product Type
      • By Channel
    • Market Attractiveness Analysis
      • By Country
      • By Ingredient Type
      • By Function
      • By Certification
      • By Product Type
      • By Channel
    • Key Takeaways
  14. Europe Market Analysis 2020 to 2024 and Forecast 2025 to 2035, By Country
    • Historical Market Size Value (USD Million) Trend Analysis By Market Taxonomy, 2020 to 2024
    • Market Size Value (USD Million) Forecast By Market Taxonomy, 2025 to 2035
      • By Country
        • Germany
        • UK
        • France
        • Italy
        • Spain
        • Belgium
        • Netherlands
        • Nordic
        • Switzerland
        • Russia
        • Poland
        • Rest of Europe
      • By Ingredient Type
      • By Function
      • By Certification
      • By Product Type
      • By Channel
    • Market Attractiveness Analysis
      • By Country
      • By Ingredient Type
      • By Function
      • By Certification
      • By Product Type
      • By Channel
    • Key Takeaways
  15. East Asia Market Analysis 2020 to 2024 and Forecast 2025 to 2035, By Country
    • Historical Market Size Value (USD Million) Trend Analysis By Market Taxonomy, 2020 to 2024
    • Market Size Value (USD Million) Forecast By Market Taxonomy, 2025 to 2035
      • By Country
        • China
        • Japan
        • South Korea
      • By Ingredient Type
      • By Function
      • By Certification
      • By Product Type
      • By Channel
    • Market Attractiveness Analysis
      • By Country
      • By Ingredient Type
      • By Function
      • By Certification
      • By Product Type
      • By Channel
    • Key Takeaways
  16. South Asia & Pacific Market Analysis 2020 to 2024 and Forecast 2025 to 2035, By Country
    • Historical Market Size Value (USD Million) Trend Analysis By Market Taxonomy, 2020 to 2024
    • Market Size Value (USD Million) Forecast By Market Taxonomy, 2025 to 2035
      • By Country
        • India
        • Thailand
        • Malaysia
        • Indonesia
        • Singapore
        • Vietnam
        • Australia
        • New Zealand
        • Rest of South Asia
      • By Ingredient Type
      • By Function
      • By Certification
      • By Product Type
      • By Channel
    • Market Attractiveness Analysis
      • By Country
      • By Ingredient Type
      • By Function
      • By Certification
      • By Product Type
      • By Channel
    • Key Takeaways
  17. Middle East and Africa Market Analysis 2020 to 2024 and Forecast 2025 to 2035, By Country
    • Historical Market Size Value (USD Million) Trend Analysis By Market Taxonomy, 2020 to 2024
    • Market Size Value (USD Million) Forecast By Market Taxonomy, 2025 to 2035
      • By Country
        • Turkey
        • UAE
        • Saudi Arabia
        • Israel
        • Other GCC Countries
        • North Africa
        • South Africa
      • By Ingredient Type
      • By Function
      • By Certification
      • By Product Type
      • By Channel
    • Market Attractiveness Analysis
      • By Country
      • By Ingredient Type
      • By Function
      • By Certification
      • By Product Type
      • By Channel
    • Key Takeaways
  18. Key Countries Market Analysis
    • USA
      • Pricing Analysis
      • Market Share Analysis, 2024
        • By Ingredient Type
        • By Function
        • By Certification
        • By Product Type
        • By Channel
    • Canada
      • Pricing Analysis
      • Market Share Analysis, 2024
        • By Ingredient Type
        • By Function
        • By Certification
        • By Product Type
        • By Channel
    • Mexico
      • Pricing Analysis
      • Market Share Analysis, 2024
        • By Ingredient Type
        • By Function
        • By Certification
        • By Product Type
        • By Channel
    • Brazil
      • Pricing Analysis
      • Market Share Analysis, 2024
        • By Ingredient Type
        • By Function
        • By Certification
        • By Product Type
        • By Channel
    • Chile
      • Pricing Analysis
      • Market Share Analysis, 2024
        • By Ingredient Type
        • By Function
        • By Certification
        • By Product Type
        • By Channel
    • Germany
      • Pricing Analysis
      • Market Share Analysis, 2024
        • By Ingredient Type
        • By Function
        • By Certification
        • By Product Type
        • By Channel
    • UK
      • Pricing Analysis
      • Market Share Analysis, 2024
        • By Ingredient Type
        • By Function
        • By Certification
        • By Product Type
        • By Channel
    • Italy
      • Pricing Analysis
      • Market Share Analysis, 2024
        • By Ingredient Type
        • By Function
        • By Certification
        • By Product Type
        • By Channel
    • Spain
      • Pricing Analysis
      • Market Share Analysis, 2024
        • By Ingredient Type
        • By Function
        • By Certification
        • By Product Type
        • By Channel
    • France
      • Pricing Analysis
      • Market Share Analysis, 2024
        • By Ingredient Type
        • By Function
        • By Certification
        • By Product Type
        • By Channel
    • India
      • Pricing Analysis
      • Market Share Analysis, 2024
        • By Ingredient Type
        • By Function
        • By Certification
        • By Product Type
        • By Channel
    • ASEAN
      • Pricing Analysis
      • Market Share Analysis, 2024
        • By Ingredient Type
        • By Function
        • By Certification
        • By Product Type
        • By Channel
    • Australia & New Zealand
      • Pricing Analysis
      • Market Share Analysis, 2024
        • By Ingredient Type
        • By Function
        • By Certification
        • By Product Type
        • By Channel
    • China
      • Pricing Analysis
      • Market Share Analysis, 2024
        • By Ingredient Type
        • By Function
        • By Certification
        • By Product Type
        • By Channel
    • Japan
      • Pricing Analysis
      • Market Share Analysis, 2024
        • By Ingredient Type
        • By Function
        • By Certification
        • By Product Type
        • By Channel
    • South Korea
      • Pricing Analysis
      • Market Share Analysis, 2024
        • By Ingredient Type
        • By Function
        • By Certification
        • By Product Type
        • By Channel
    • Russia
      • Pricing Analysis
      • Market Share Analysis, 2024
        • By Ingredient Type
        • By Function
        • By Certification
        • By Product Type
        • By Channel
    • Poland
      • Pricing Analysis
      • Market Share Analysis, 2024
        • By Ingredient Type
        • By Function
        • By Certification
        • By Product Type
        • By Channel
    • Hungary
      • Pricing Analysis
      • Market Share Analysis, 2024
        • By Ingredient Type
        • By Function
        • By Certification
        • By Product Type
        • By Channel
    • Kingdom of Saudi Arabia
      • Pricing Analysis
      • Market Share Analysis, 2024
        • By Ingredient Type
        • By Function
        • By Certification
        • By Product Type
        • By Channel
    • Turkiye
      • Pricing Analysis
      • Market Share Analysis, 2024
        • By Ingredient Type
        • By Function
        • By Certification
        • By Product Type
        • By Channel
    • South Africa
      • Pricing Analysis
      • Market Share Analysis, 2024
        • By Ingredient Type
        • By Function
        • By Certification
        • By Product Type
        • By Channel
  19. Market Structure Analysis
    • Competition Dashboard
    • Competition Benchmarking
    • Market Share Analysis of Top Players
      • By Regional
      • By Ingredient Type
      • By Function
      • By Certification
      • By Product Type
      • By Channel
  20. Competition Analysis
    • Competition Deep Dive
      • Unilever
        • Overview
        • Product Portfolio
        • Profitability by Market Segments (Product/Age /Sales Channel/Region)
        • Sales Footprint
        • Strategy Overview
        • L’Oréal
        • The Body Shop
        • BASF
        • Givaudan
        • DSM-Firmenich
        • Croda
        • Clariant
        • Procter & Gamble
        • Seppic
    • Assumptions & Acronyms Used
    • Research Methodology

List of Tables

  • Table 1: Global Market Value (USD Million) Forecast by Region, 2020-2035
  • Table 2: Global Market Value (USD Million) Forecast by Ingredient Type, 2020-2035
  • Table 3: Global Market Value (USD Million) Forecast by Function, 2020-2035
  • Table 4: Global Market Value (USD Million) Forecast by Certification, 2020-2035
  • Table 5: Global Market Value (USD Million) Forecast by Product Type, 2020-2035
  • Table 6: Global Market Value (USD Million) Forecast by Channel, 2020-2035
  • Table 7: North America Market Value (USD Million) Forecast by Country, 2020-2035
  • Table 8: North America Market Value (USD Million) Forecast by Ingredient Type, 2020-2035
  • Table 9: North America Market Value (USD Million) Forecast by Function, 2020-2035
  • Table 10: North America Market Value (USD Million) Forecast by Certification, 2020-2035
  • Table 11: North America Market Value (USD Million) Forecast by Product Type, 2020-2035
  • Table 12: North America Market Value (USD Million) Forecast by Channel, 2020-2035
  • Table 13: Latin America Market Value (USD Million) Forecast by Country, 2020-2035
  • Table 14: Latin America Market Value (USD Million) Forecast by Ingredient Type, 2020-2035
  • Table 15: Latin America Market Value (USD Million) Forecast by Function, 2020-2035
  • Table 16: Latin America Market Value (USD Million) Forecast by Certification, 2020-2035
  • Table 17: Latin America Market Value (USD Million) Forecast by Product Type, 2020-2035
  • Table 18: Latin America Market Value (USD Million) Forecast by Channel, 2020-2035
  • Table 19: Europe Market Value (USD Million) Forecast by Country, 2020-2035
  • Table 20: Europe Market Value (USD Million) Forecast by Ingredient Type, 2020-2035
  • Table 21: Europe Market Value (USD Million) Forecast by Function, 2020-2035
  • Table 22: Europe Market Value (USD Million) Forecast by Certification, 2020-2035
  • Table 23: Europe Market Value (USD Million) Forecast by Product Type, 2020-2035
  • Table 24: Europe Market Value (USD Million) Forecast by Channel, 2020-2035
  • Table 25: East Asia Market Value (USD Million) Forecast by Country, 2020-2035
  • Table 26: East Asia Market Value (USD Million) Forecast by Ingredient Type, 2020-2035
  • Table 27: East Asia Market Value (USD Million) Forecast by Function, 2020-2035
  • Table 28: East Asia Market Value (USD Million) Forecast by Certification, 2020-2035
  • Table 29: East Asia Market Value (USD Million) Forecast by Product Type, 2020-2035
  • Table 30: East Asia Market Value (USD Million) Forecast by Channel, 2020-2035
  • Table 31: South Asia & Pacific Market Value (USD Million) Forecast by Country, 2020-2035
  • Table 32: South Asia & Pacific Market Value (USD Million) Forecast by Ingredient Type, 2020-2035
  • Table 33: South Asia & Pacific Market Value (USD Million) Forecast by Function, 2020-2035
  • Table 34: South Asia & Pacific Market Value (USD Million) Forecast by Certification, 2020-2035
  • Table 35: South Asia & Pacific Market Value (USD Million) Forecast by Product Type, 2020-2035
  • Table 36: South Asia & Pacific Market Value (USD Million) Forecast by Channel, 2020-2035
  • Table 37: Middle East and Africa Market Value (USD Million) Forecast by Country, 2020-2035
  • Table 38: Middle East and Africa Market Value (USD Million) Forecast by Ingredient Type, 2020-2035
  • Table 39: Middle East and Africa Market Value (USD Million) Forecast by Function, 2020-2035
  • Table 40: Middle East and Africa Market Value (USD Million) Forecast by Certification, 2020-2035
  • Table 41: Middle East and Africa Market Value (USD Million) Forecast by Product Type, 2020-2035
  • Table 42: Middle East and Africa Market Value (USD Million) Forecast by Channel, 2020-2035

List of Figures

  • Figure 1: Global Market Pricing Analysis
  • Figure 2: Global Market Value (USD Million) Forecast 2020-2035
  • Figure 3: Global Market Value Share and BPS Analysis by Ingredient Type, 2025 and 2035
  • Figure 4: Global Market Y-o-Y Growth Comparison by Ingredient Type, 2025-2035
  • Figure 5: Global Market Attractiveness Analysis by Ingredient Type
  • Figure 6: Global Market Value Share and BPS Analysis by Function, 2025 and 2035
  • Figure 7: Global Market Y-o-Y Growth Comparison by Function, 2025-2035
  • Figure 8: Global Market Attractiveness Analysis by Function
  • Figure 9: Global Market Value Share and BPS Analysis by Certification, 2025 and 2035
  • Figure 10: Global Market Y-o-Y Growth Comparison by Certification, 2025-2035
  • Figure 11: Global Market Attractiveness Analysis by Certification
  • Figure 12: Global Market Value Share and BPS Analysis by Product Type, 2025 and 2035
  • Figure 13: Global Market Y-o-Y Growth Comparison by Product Type, 2025-2035
  • Figure 14: Global Market Attractiveness Analysis by Product Type
  • Figure 15: Global Market Value Share and BPS Analysis by Channel, 2025 and 2035
  • Figure 16: Global Market Y-o-Y Growth Comparison by Channel, 2025-2035
  • Figure 17: Global Market Attractiveness Analysis by Channel
  • Figure 18: Global Market Value (USD Million) Share and BPS Analysis by Region, 2025 and 2035
  • Figure 19: Global Market Y-o-Y Growth Comparison by Region, 2025-2035
  • Figure 20: Global Market Attractiveness Analysis by Region
  • Figure 21: North America Market Incremental $ Opportunity, 2025-2035
  • Figure 22: Latin America Market Incremental $ Opportunity, 2025-2035
  • Figure 23: Europe Market Incremental $ Opportunity, 2025-2035
  • Figure 24: East Asia Market Incremental $ Opportunity, 2025-2035
  • Figure 25: South Asia & Pacific Market Incremental $ Opportunity, 2025-2035
  • Figure 26: Middle East and Africa Market Incremental $ Opportunity, 2025-2035
  • Figure 27: North America Market Value Share and BPS Analysis by Country, 2025 and 2035
  • Figure 28: North America Market Value Share and BPS Analysis by Ingredient Type, 2025 and 2035
  • Figure 29: North America Market Y-o-Y Growth Comparison by Ingredient Type, 2025-2035
  • Figure 30: North America Market Attractiveness Analysis by Ingredient Type
  • Figure 31: North America Market Value Share and BPS Analysis by Function, 2025 and 2035
  • Figure 32: North America Market Y-o-Y Growth Comparison by Function, 2025-2035
  • Figure 33: North America Market Attractiveness Analysis by Function
  • Figure 34: North America Market Value Share and BPS Analysis by Certification, 2025 and 2035
  • Figure 35: North America Market Y-o-Y Growth Comparison by Certification, 2025-2035
  • Figure 36: North America Market Attractiveness Analysis by Certification
  • Figure 37: North America Market Value Share and BPS Analysis by Product Type, 2025 and 2035
  • Figure 38: North America Market Y-o-Y Growth Comparison by Product Type, 2025-2035
  • Figure 39: North America Market Attractiveness Analysis by Product Type
  • Figure 40: North America Market Value Share and BPS Analysis by Channel, 2025 and 2035
  • Figure 41: North America Market Y-o-Y Growth Comparison by Channel, 2025-2035
  • Figure 42: North America Market Attractiveness Analysis by Channel
  • Figure 43: Latin America Market Value Share and BPS Analysis by Country, 2025 and 2035
  • Figure 44: Latin America Market Value Share and BPS Analysis by Ingredient Type, 2025 and 2035
  • Figure 45: Latin America Market Y-o-Y Growth Comparison by Ingredient Type, 2025-2035
  • Figure 46: Latin America Market Attractiveness Analysis by Ingredient Type
  • Figure 47: Latin America Market Value Share and BPS Analysis by Function, 2025 and 2035
  • Figure 48: Latin America Market Y-o-Y Growth Comparison by Function, 2025-2035
  • Figure 49: Latin America Market Attractiveness Analysis by Function
  • Figure 50: Latin America Market Value Share and BPS Analysis by Certification, 2025 and 2035
  • Figure 51: Latin America Market Y-o-Y Growth Comparison by Certification, 2025-2035
  • Figure 52: Latin America Market Attractiveness Analysis by Certification
  • Figure 53: Latin America Market Value Share and BPS Analysis by Product Type, 2025 and 2035
  • Figure 54: Latin America Market Y-o-Y Growth Comparison by Product Type, 2025-2035
  • Figure 55: Latin America Market Attractiveness Analysis by Product Type
  • Figure 56: Latin America Market Value Share and BPS Analysis by Channel, 2025 and 2035
  • Figure 57: Latin America Market Y-o-Y Growth Comparison by Channel, 2025-2035
  • Figure 58: Latin America Market Attractiveness Analysis by Channel
  • Figure 59: Europe Market Value Share and BPS Analysis by Country, 2025 and 2035
  • Figure 60: Europe Market Value Share and BPS Analysis by Ingredient Type, 2025 and 2035
  • Figure 61: Europe Market Y-o-Y Growth Comparison by Ingredient Type, 2025-2035
  • Figure 62: Europe Market Attractiveness Analysis by Ingredient Type
  • Figure 63: Europe Market Value Share and BPS Analysis by Function, 2025 and 2035
  • Figure 64: Europe Market Y-o-Y Growth Comparison by Function, 2025-2035
  • Figure 65: Europe Market Attractiveness Analysis by Function
  • Figure 66: Europe Market Value Share and BPS Analysis by Certification, 2025 and 2035
  • Figure 67: Europe Market Y-o-Y Growth Comparison by Certification, 2025-2035
  • Figure 68: Europe Market Attractiveness Analysis by Certification
  • Figure 69: Europe Market Value Share and BPS Analysis by Product Type, 2025 and 2035
  • Figure 70: Europe Market Y-o-Y Growth Comparison by Product Type, 2025-2035
  • Figure 71: Europe Market Attractiveness Analysis by Product Type
  • Figure 72: Europe Market Value Share and BPS Analysis by Channel, 2025 and 2035
  • Figure 73: Europe Market Y-o-Y Growth Comparison by Channel, 2025-2035
  • Figure 74: Europe Market Attractiveness Analysis by Channel
  • Figure 75: East Asia Market Value Share and BPS Analysis by Country, 2025 and 2035
  • Figure 76: East Asia Market Value Share and BPS Analysis by Ingredient Type, 2025 and 2035
  • Figure 77: East Asia Market Y-o-Y Growth Comparison by Ingredient Type, 2025-2035
  • Figure 78: East Asia Market Attractiveness Analysis by Ingredient Type
  • Figure 79: East Asia Market Value Share and BPS Analysis by Function, 2025 and 2035
  • Figure 80: East Asia Market Y-o-Y Growth Comparison by Function, 2025-2035
  • Figure 81: East Asia Market Attractiveness Analysis by Function
  • Figure 82: East Asia Market Value Share and BPS Analysis by Certification, 2025 and 2035
  • Figure 83: East Asia Market Y-o-Y Growth Comparison by Certification, 2025-2035
  • Figure 84: East Asia Market Attractiveness Analysis by Certification
  • Figure 85: East Asia Market Value Share and BPS Analysis by Product Type, 2025 and 2035
  • Figure 86: East Asia Market Y-o-Y Growth Comparison by Product Type, 2025-2035
  • Figure 87: East Asia Market Attractiveness Analysis by Product Type
  • Figure 88: East Asia Market Value Share and BPS Analysis by Channel, 2025 and 2035
  • Figure 89: East Asia Market Y-o-Y Growth Comparison by Channel, 2025-2035
  • Figure 90: East Asia Market Attractiveness Analysis by Channel
  • Figure 91: South Asia & Pacific Market Value Share and BPS Analysis by Country, 2025 and 2035
  • Figure 92: South Asia & Pacific Market Value Share and BPS Analysis by Ingredient Type, 2025 and 2035
  • Figure 93: South Asia & Pacific Market Y-o-Y Growth Comparison by Ingredient Type, 2025-2035
  • Figure 94: South Asia & Pacific Market Attractiveness Analysis by Ingredient Type
  • Figure 95: South Asia & Pacific Market Value Share and BPS Analysis by Function, 2025 and 2035
  • Figure 96: South Asia & Pacific Market Y-o-Y Growth Comparison by Function, 2025-2035
  • Figure 97: South Asia & Pacific Market Attractiveness Analysis by Function
  • Figure 98: South Asia & Pacific Market Value Share and BPS Analysis by Certification, 2025 and 2035
  • Figure 99: South Asia & Pacific Market Y-o-Y Growth Comparison by Certification, 2025-2035
  • Figure 100: South Asia & Pacific Market Attractiveness Analysis by Certification
  • Figure 101: South Asia & Pacific Market Value Share and BPS Analysis by Product Type, 2025 and 2035
  • Figure 102: South Asia & Pacific Market Y-o-Y Growth Comparison by Product Type, 2025-2035
  • Figure 103: South Asia & Pacific Market Attractiveness Analysis by Product Type
  • Figure 104: South Asia & Pacific Market Value Share and BPS Analysis by Channel, 2025 and 2035
  • Figure 105: South Asia & Pacific Market Y-o-Y Growth Comparison by Channel, 2025-2035
  • Figure 106: South Asia & Pacific Market Attractiveness Analysis by Channel
  • Figure 107: Middle East and Africa Market Value Share and BPS Analysis by Country, 2025 and 2035
  • Figure 108: Middle East and Africa Market Value Share and BPS Analysis by Ingredient Type, 2025 and 2035
  • Figure 109: Middle East and Africa Market Y-o-Y Growth Comparison by Ingredient Type, 2025-2035
  • Figure 110: Middle East and Africa Market Attractiveness Analysis by Ingredient Type
  • Figure 111: Middle East and Africa Market Value Share and BPS Analysis by Function, 2025 and 2035
  • Figure 112: Middle East and Africa Market Y-o-Y Growth Comparison by Function, 2025-2035
  • Figure 113: Middle East and Africa Market Attractiveness Analysis by Function
  • Figure 114: Middle East and Africa Market Value Share and BPS Analysis by Certification, 2025 and 2035
  • Figure 115: Middle East and Africa Market Y-o-Y Growth Comparison by Certification, 2025-2035
  • Figure 116: Middle East and Africa Market Attractiveness Analysis by Certification
  • Figure 117: Middle East and Africa Market Value Share and BPS Analysis by Product Type, 2025 and 2035
  • Figure 118: Middle East and Africa Market Y-o-Y Growth Comparison by Product Type, 2025-2035
  • Figure 119: Middle East and Africa Market Attractiveness Analysis by Product Type
  • Figure 120: Middle East and Africa Market Value Share and BPS Analysis by Channel, 2025 and 2035
  • Figure 121: Middle East and Africa Market Y-o-Y Growth Comparison by Channel, 2025-2035
  • Figure 122: Middle East and Africa Market Attractiveness Analysis by Channel
  • Figure 123: Global Market - Tier Structure Analysis
  • Figure 124: Global Market - Company Share Analysis

Frequently Asked Questions

How big is the Carbon-Neutral Skincare Ingredients Market in 2025?

The Carbon-Neutral Skincare Ingredients Market is estimated to be valued at USD 2,050.4 million in 2025.

What will be the size of the Carbon-Neutral Skincare Ingredients Market in 2035?

The market size for the Carbon-Neutral Skincare Ingredients Market is projected to reach USD 6,902.3 million by 2035.

How much will be the Carbon-Neutral Skincare Ingredients Market growth between 2025 and 2035?

The Carbon-Neutral Skincare Ingredients Market is expected to grow at a 12.9% CAGR between 2025 and 2035.

What are the key product types in the Carbon-Neutral Skincare Ingredients Market?

The key product types in the Carbon-Neutral Skincare Ingredients Market are serums, creams/lotions, masks, and sun care.

Which function segment will contribute significant share in the Carbon-Neutral Skincare Ingredients Market in 2025?

In terms of function, the hydration segment is expected to command 48.8% share in the Carbon-Neutral Skincare Ingredients Market in 2025.

Explore Similar Insights

Future Market Insights

Carbon-Neutral Skincare Ingredients Market

Chat With

MaRIA

Hi There, I am MaRIA, Your Market Research Intelligence Assistant. How may I help you?