The cell culture waste aspirator market is valued at USD 877.0 million in 2025 and advances to USD 1,824.5 million by 2035, registering an absolute increase of USD 947.5 million. The acceleration phase is most prominent in the early years from 2025 to 2029, driven by increasing adoption of automated laboratory equipment and rising demand in pharmaceutical and biotechnology sectors. Enhanced focus on efficient waste management, regulatory compliance, and contamination control in cell culture processes fuels early growth. Manufacturers introducing advanced aspirators with higher precision, reliability, and ease of use capture significant market share during this period, contributing to rapid momentum.
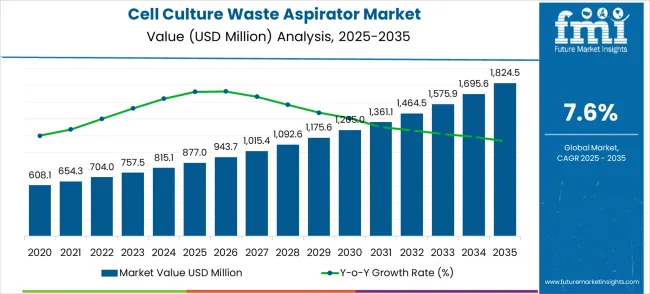
From 2030 to 2035, the growth curve transitions into a deceleration phase as adoption saturates in developed regions and competition intensifies. While demand continues to rise in emerging markets, the pace of expansion becomes more measured as the market matures.
Technological refinements, energy-efficient designs, and integration into larger automated lab systems support incremental growth. By 2035, the market will achieve an absolute increase of USD 947.5 million, reflecting sustained value creation. The acceleration and deceleration pattern highlights that early rapid adoption, driven by technological innovation, gradually gives way to a steady expansion phase, ensuring long-term stability and growth in the global cell culture waste aspirator market.
| Metric | Value |
|---|---|
| Estimated Value in (2025E) | USD 877.0 million |
| Forecast Value in (2035F) | USD 1,824.5 million |
| Forecast CAGR (2025 to 2035) | 7.6% |
The cell culture waste aspirator market is divided into biopharmaceutical laboratories at 38%, academic and research institutions at 26%, clinical diagnostics laboratories at 16%, industrial biotechnology facilities at 12%, and contract research organizations at 8%. Biopharmaceutical labs lead adoption as aspirators ensure efficient disposal of liquid waste from cell culture processes while maintaining sterile conditions. Academic and research institutions use aspirators for safe and precise removal of media and reagents during experiments. Clinical diagnostics labs rely on aspirators for sample processing and contamination control. Industrial biotech facilities integrate them into large-scale cell culture production. CROs adopt aspirators for preclinical and process development workflows requiring high precision and biosafety.
Current trends in the cell culture waste aspirator market include automation and integration with bioreactors and liquid handling systems for improved workflow efficiency. Manufacturers are developing compact, low-noise, and energy-efficient aspirators suitable for various laboratory scales. Expansion into high-throughput research labs, regenerative medicine, and stem cell facilities is increasing adoption. Focus on sterility, safety, and compliance with laboratory standards is driving design innovations. Collaborations between equipment manufacturers and biotech companies enable custom solutions tailored to specific applications. Rising awareness of laboratory safety, contamination prevention, and operational efficiency is boosting global market growth while maintaining regulatory compliance and traceable manufacturing practices. Opportunity Pathways - Cell Culture Waste Aspirator Market
The cell culture waste aspirator market is positioned for strong growth and transformation as biotechnology research, regenerative medicine, and personalized therapy development expand globally. Laboratories are prioritizing sterile handling, contamination prevention, and automation efficiency, making waste aspirators indispensable for research reproducibility and safety. Rising investment in life sciences infrastructure across Asia-Pacific, Europe, and North America is amplifying demand, while manufacturers focus on digital integration, IoT monitoring, and precision engineering. Pathways such as low-flow aspirators for delicate samples, advanced automation systems, and smart laboratory integration promise margin uplift and global adoption. Geographic expansion into fast-growing research hubs (China, India, Brazil) and alignment with biosafety regulations will capture volume.
Market expansion is being supported by the increasing global investment in biotechnology research and the corresponding need for sophisticated laboratory equipment that can ensure sterile working conditions, prevent contamination, and support precision cell culture applications across various life sciences and biomedical research fields. Modern research laboratories and biotechnology facilities are increasingly focused on implementing automation solutions that can enhance research productivity, eliminate contamination risks, and provide consistent performance in critical cell culture applications. Cell culture waste aspirators' proven ability to deliver sterile aspiration, support contamination prevention, and enhance laboratory efficiency makes them essential equipment for contemporary biotechnology research and cell culture laboratories.
The growing priority on research reproducibility and laboratory standardization is driving demand for cell culture waste aspirators that can support consistent protocols, ensure sterile conditions, and enable reliable research outcomes. Research facilities' preference for laboratory equipment that combines automation with precision control and contamination prevention capabilities is creating opportunities for innovative cell culture waste aspirator implementations. The rising influence of regenerative medicine and cell therapy development is also contributing to increased adoption of cell culture waste aspirators that can provide precise fluid handling without compromising sterility or research quality.
The cell culture waste aspirator market is growing steadily, fueled by increasing demand in biomedical research and laboratory environments. Low flow type aspirators (<10 L/min) dominate the flow rate segment with a 40% share, followed closely by medium flow type (10–20 L/min) at 35%. High flow type (>20 L/min) accounts for 25% of the market. In terms of applications, biomedical R&D leads with 45% of the market, followed by university laboratories at 25%. These segments reflect the most active areas for investment, driven by the expansion of research facilities and growing adoption in clinical and educational laboratories.
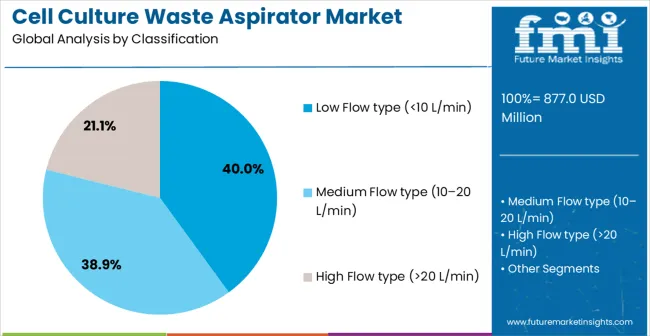
Low flow type aspirators, holding a 40% market share, are the most widely used due to their precision and suitability for small-scale laboratory operations. They are preferred in academic labs, biomedical research, and tissue culture studies where controlled aspiration is critical. Leading manufacturers include Sartorius, Thermo Fisher Scientific, and Eppendorf. Low flow aspirators offer reliable suction with minimal disruption to delicate samples, ensuring reproducibility in experimental workflows. Their compact design and ease of integration into laboratory setups contribute to their dominance, making them highly adopted in research-focused environments and university laboratories.
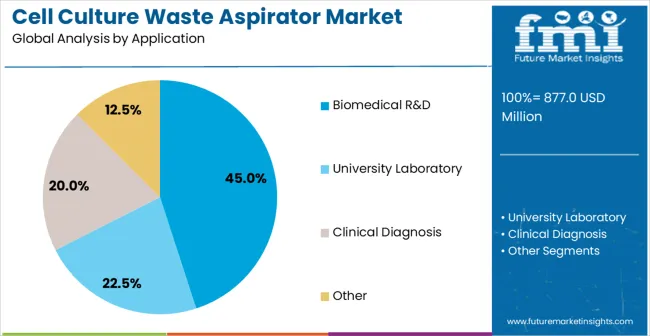
Biomedical R&D applications account for 45% of the market, making it the largest segment for cell culture waste aspirators. These aspirators are critical in research on cell biology, pharmacology, and biotechnology, where precise removal of culture waste is required. Key manufacturers such as Sartorius, Thermo Fisher Scientific, and Eppendorf provide equipment tailored for high reproducibility and contamination control. Expansion of research institutions, increasing cell-based studies, and adoption of automated lab workflows support the segment’s growth. Biomedical R&D continues to be the focal point for investments due to consistent demand and technological integration in modern laboratories.
The global cell culture waste aspirator market is expanding as laboratories increasingly adopt automated solutions for waste management. These devices enable safe and efficient removal of liquid culture waste while reducing contamination risk and improving workflow efficiency. Growth in biotechnology, clinical research, and pharmaceutical labs is fueling demand, driven by the need for high-throughput operations and consistent experimental outcomes. Advancements in aspirator design, ergonomics, and integration with lab systems are supporting adoption.
Adoption of automated workflows is a key factor driving demand for cell culture waste aspirators. Laboratories handling large volumes of samples require devices that minimize manual handling, enhance precision, and maintain sterile conditions. Research centers, biopharmaceutical labs, and academic institutions are increasingly implementing aspirators to improve efficiency and reduce human error. Modern aspirators offer adjustable suction, compatibility with multiple flask and plate sizes, and ergonomic designs to simplify operation. The trend toward automation ensures consistent results and faster processing times, highlighting the importance of these devices in contemporary laboratory settings and positioning them as essential tools in scientific research.
The proliferation of biotechnology, pharmaceutical, and clinical research laboratories is creating new opportunities for cell culture waste aspirators. Growing research in drug development, stem cell therapies, and regenerative medicine demands efficient liquid waste management solutions. Manufacturers are introducing compact, ergonomic aspirators with adjustable suction, enhanced capacity, and compatibility with high-throughput multiwell culture systems. Emerging regions investing in life sciences infrastructure are creating additional growth potential. Companies are also focusing on providing aspirators that integrate with automated laboratory platforms. The increase in laboratory scale and complexity ensures sustained demand for reliable and efficient waste management solutions worldwide.
Market trends show a strong focus on compact, efficient, and user-friendly aspirators for cell culture applications. Modern devices incorporate ergonomic designs, adjustable suction levels, and compatibility with a variety of flask and plate formats. Laboratories prioritize aspirators that reduce contamination risks, integrate seamlessly with automated workflows, and optimize workspace usage. Portable and modular designs are gaining traction as labs seek flexible solutions that maintain performance without occupying excess space. Continuous innovation in device functionality, usability, and safety is shaping market development and supporting laboratories in achieving precise, consistent, and efficient outcomes in research and clinical applications.
Despite growing adoption, the cell culture waste aspirator market faces challenges related to high equipment costs and operational complexity. Advanced aspirators can be expensive for small and mid-sized laboratories, and proper training is required to ensure safe and effective use. Maintenance, replacement of suction components, and integration with existing laboratory systems add to operational considerations. Limited awareness of automation benefits in certain regions also slows adoption. Manufacturers are addressing these challenges through modular designs, cost-efficient solutions, and training programs for laboratory personnel. Overcoming these barriers is crucial to expand market penetration and ensure long-term growth.
| Country | CAGR (2025-2035) |
|---|---|
| China | 10.3% |
| India | 9.5% |
| Germany | 8.7% |
| Brazil | 8.0% |
| USA | 7.2% |
| UK | 6.5% |
| Japan | 5.7% |
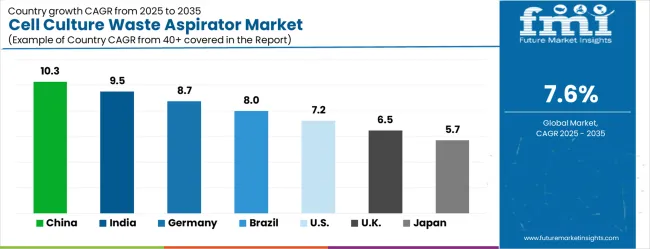
The global cell culture waste aspirator market is projected to grow at a CAGR of 7.6%, with a multiplication factor of 1.76 over the forecast period. China leads at 10.3% (1.84x), exceeding the global CAGR by 2.7 percentage points, supported by expanding biotechnology research and life sciences infrastructure. India follows at 9.5% (1.74x), 1.9 points above the global average, driven by growth in pharmaceutical and biotech sectors, both part of BRICS along with Brazil, which grows at 8% (1.63x), 0.4 points above the global rate due to laboratory modernization. Germany records 8.7% (1.67x), 1.1 points above the global average, reflecting steady demand from European research institutions. The USA grows at 7.2% (1.61x), slightly below global growth. The UK at 6.5% (1.57x) and Japan at 5.7% (1.53x) trail by 1.1 and 1.9 points. ASEAN and Oceania regions show emerging adoption at 6-8% (1.57-1.63x), driven by rising biomedical research and automation.
The report covers an in-depth analysis of 40+ countries,Top-performing countries are highlighted below.
China contributes 10.3% to the global market and is expected to grow at 10.3% CAGR between 2025 and 2035. Growth is driven by increasing biotechnology research, pharmaceutical manufacturing, and academic laboratories in eastern and northern provinces. Suppliers such as Thermo Fisher Scientific and Sartorius provide high-efficiency aspirators compatible with automated workflows for large-scale cell culture waste management. Rising adoption in vaccine production, biopharmaceutical manufacturing, and regenerative medicine laboratories supports consistent lab operations. Compact, multifunctional aspirators are preferred to optimize space and maintain biosafety. Government incentives for biotechnology innovation and growing investment in clinical research further enhance adoption. Efficient workflow management and reduced contamination risks are achieved through automated waste disposal systems.
India accounts for 9.5% of the global market with CAGR of 9.5%. Growth is concentrated in metropolitan research hubs such as Bangalore, Hyderabad, and Pune. High-throughput aspirators supplied by Sartorius and Eppendorf improve laboratory efficiency and biosafety. Academic research institutions and private R&D laboratories are increasing adoption to streamline waste disposal. Industrial vaccine manufacturing and regenerative medicine research are boosting demand. Compact, multifunctional aspirators help maximize space and reduce manual handling. Expansion is supported by government programs promoting biotechnology innovation and startup development. Demand for reliable, automated laboratory equipment is expected to rise steadily with increasing pharmaceutical production.
Germany holds 8.7% of the global market with 8.7% CAGR. Adoption is concentrated in pharmaceutical production, contract research, and university laboratories. Suppliers such as Thermo Fisher Scientific and Sartorius provide aspirators integrated with automated waste management systems. Bavaria and Baden-Württemberg account for 60% of installations due to dense pharmaceutical and biotech clusters. Aspirators are used in high-throughput R&D, regenerative medicine, and process development laboratories. EU regulations promoting biosafety and laboratory efficiency support adoption.
Brazil represents 8% of the global market with CAGR of 8%. Adoption is focused on pharmaceutical, biotechnology, and academic laboratories in São Paulo and Rio de Janeiro. Suppliers such as Sartorius and Eppendorf provide compact, multifunctional aspirators for high-density lab environments. Industrial applications include vaccine production, stem cell research, and bioprocessing. Government-backed biotechnology programs and investment in clinical research stimulate growth. Compact designs help optimize lab space while ensuring efficient waste management. Increased demand from clinical research and biotechnology projects supports steady adoption.
The United States holds 7.2% of the global market with 7.2% CAGR. Adoption is concentrated in California, Massachusetts, and North Carolina, where pharmaceutical and biotechnology hubs are present. Suppliers including Thermo Fisher Scientific and Eppendorf provide high-throughput aspirators integrated with automated lab workflows. Adoption is driven by vaccine production, regenerative medicine, and academic research laboratories. Multifunctional aspirators reduce manual labor, improve biosafety, and optimize workflow. Federal funding for biotechnology research and widespread integration with automated lab systems support adoption.
The United Kingdom represents 6.5% of the global market with CAGR of 6.5%. Adoption is focused on biotech startups, academic research labs, and pharmaceutical facilities. Suppliers such as Sartorius and Eppendorf provide compact, automated aspirators that manage waste efficiently. London, Cambridge, and Oxford account for 55% of installations. Rising demand in regenerative medicine, cell therapy, and high-throughput R&D drives adoption. Automated systems enhance workflow efficiency, reduce contamination risk, and optimize laboratory space. Government grants for biotechnology innovation support steady market growth.
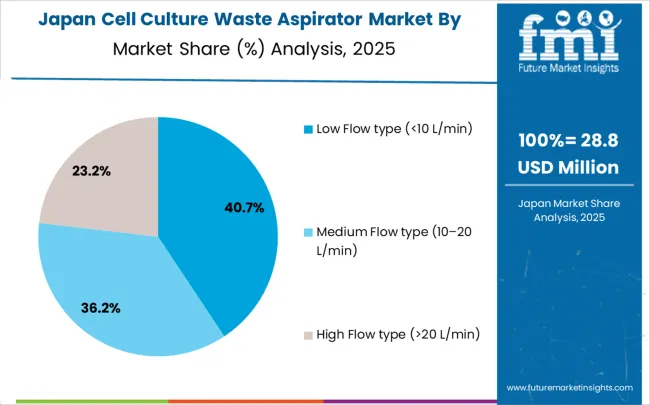
Japan holds 5.7% of the global market with CAGR of 5.7%. Adoption is concentrated in pharmaceutical and biotechnology research laboratories, regenerative medicine centers, and academic institutions. Suppliers including Thermo Fisher Scientific and Eppendorf provide automated, high-efficiency aspirators. Major adoption hubs are Tokyo, Osaka, and Nagoya, accounting for 50% of installations. Adoption is driven by the need for reliable high-throughput systems and compliance with strict laboratory safety protocols. Compact, multifunctional aspirators reduce space requirements and improve workflow efficiency. Replacement of older manual systems contributes to steady market expansion.
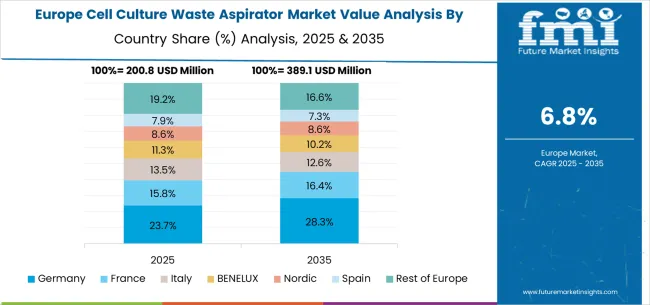
The cell culture waste aspirator market in Europe is projected to grow from USD 311.9 million in 2025 to USD 614.8 million by 2035, registering a CAGR of 7.0% over the forecast period. Germany is expected to maintain its leadership position with a 28.0% market share in 2025, moderating slightly to 27.8% by 2035, supported by its strong biotechnology sector, advanced laboratory equipment industry, and comprehensive research infrastructure serving major European markets.
The United Kingdom follows with 22.0% in 2025, projected to reach 21.8% by 2035, driven by established life sciences excellence, a comprehensive research framework, and advanced biotechnology development programs. France holds 18.0% in 2025, rising to 18.2% by 2035, supported by pharmaceutical research leadership and growing adoption of laboratory automation technologies. Italy commands 13.0% in 2025, projected to reach 13.1% by 2035, while Spain accounts for 8.5% in 2025, expected to reach 8.6% by 2035. The Netherlands maintains a 4.0% share in 2025, growing to 4.1% by 2035. The Rest of Europe region, including Nordic countries, Eastern Europe, and other markets, is anticipated to maintain its position, holding its collective share at 6.5% by 2035, attributed to increasing research infrastructure modernization and growing laboratory automation adoption across emerging biotechnology markets implementing advanced research standards.
The cell culture waste aspirator market is characterized by competition among key players such as Rocker, Integra Biosciences, Research Products International (RPI), Chemglass Life Sciences, and Accuris Instruments. These companies offer a range of aspirators designed for efficient liquid waste removal in laboratory settings.
Rocker provides various models, including the BENCHROCKER 3D and the CHEMcell® Rocker Bioreactor System, which are suitable for cell culture applications. Their products are designed to offer gentle and efficient mixing for cell culture bags. Integra Biosciences offers the VACUSIP® battery-powered aspirator, known for its portability and quiet operation, making it ideal for laboratory environments. Research Products International provides aspirators compatible with in-house vacuum systems, featuring mechanical regulators for efficient aspiration. Chemglass Life Sciences offers the BVC Basic Aspirator System, which includes a 2L glass bottle and is suitable for use with in-house vacuum systems. Accuris Instruments provides the Aspire Laboratory Aspirator, which features an adjustable vacuum pressure and a compact design for easy integration into laboratory workflows.
These companies differentiate themselves through product features such as portability, compatibility with existing systems, and ease of use. Product brochures highlight specifications like vacuum range, noise level, and included accessories to assist customers in selecting the appropriate aspirator for their needs. By focusing on these attributes, each company aims to meet the diverse requirements of laboratories engaged in cell culture and related research.
| Items | Values |
|---|---|
| Quantitative Units (2025) | USD 877.0 million |
| Flow Rate | Low Flow type (<10 L/min), Medium Flow type (10–20 L/min), High Flow type (>20 L/min), Others |
| Application | Biomedical R&D, University Laboratory, Clinical Diagnosis, Others |
| Regions Covered | Asia Pacific, North America, Europe, Latin America, Middle East & Africa |
| Countries Covered | China, India, Germany, Brazil, the United States, the United Kingdom, Japan, and 40+ countries |
| Key Companies Profiled | Rocker, Integra Biosciences, Research Products International, Chemglass Life Sciences, and Accuris Instruments |
| Additional Attributes | Dollar sales by flow rate and application category, regional demand trends, competitive landscape, technological advancements in laboratory automation systems, contamination control development, precision engineering innovation, and research efficiency optimization |
The global cell culture waste aspirator market is estimated to be valued at USD 877.0 million in 2025.
The market size for the cell culture waste aspirator market is projected to reach USD 1,824.5 million by 2035.
The cell culture waste aspirator market is expected to grow at a 7.6% CAGR between 2025 and 2035.
The key product types in cell culture waste aspirator market are low flow type (<10 l/min), medium flow type (10–20 l/min) and high flow type (>20 l/min).
In terms of application, biomedical r&d segment to command 45.0% share in the cell culture waste aspirator market in 2025.


Our Research Products

The "Full Research Suite" delivers actionable market intel, deep dives on markets or technologies, so clients act faster, cut risk, and unlock growth.

The Leaderboard benchmarks and ranks top vendors, classifying them as Established Leaders, Leading Challengers, or Disruptors & Challengers.

Locates where complements amplify value and substitutes erode it, forecasting net impact by horizon

We deliver granular, decision-grade intel: market sizing, 5-year forecasts, pricing, adoption, usage, revenue, and operational KPIs—plus competitor tracking, regulation, and value chains—across 60 countries broadly.

Spot the shifts before they hit your P&L. We track inflection points, adoption curves, pricing moves, and ecosystem plays to show where demand is heading, why it is changing, and what to do next across high-growth markets and disruptive tech

Real-time reads of user behavior. We track shifting priorities, perceptions of today’s and next-gen services, and provider experience, then pace how fast tech moves from trial to adoption, blending buyer, consumer, and channel inputs with social signals (#WhySwitch, #UX).

Partner with our analyst team to build a custom report designed around your business priorities. From analysing market trends to assessing competitors or crafting bespoke datasets, we tailor insights to your needs.
Supplier Intelligence
Discovery & Profiling
Capacity & Footprint
Performance & Risk
Compliance & Governance
Commercial Readiness
Who Supplies Whom
Scorecards & Shortlists
Playbooks & Docs
Category Intelligence
Definition & Scope
Demand & Use Cases
Cost Drivers
Market Structure
Supply Chain Map
Trade & Policy
Operating Norms
Deliverables
Buyer Intelligence
Account Basics
Spend & Scope
Procurement Model
Vendor Requirements
Terms & Policies
Entry Strategy
Pain Points & Triggers
Outputs
Pricing Analysis
Benchmarks
Trends
Should-Cost
Indexation
Landed Cost
Commercial Terms
Deliverables
Brand Analysis
Positioning & Value Prop
Share & Presence
Customer Evidence
Go-to-Market
Digital & Reputation
Compliance & Trust
KPIs & Gaps
Outputs
Full Research Suite comprises of:
Market outlook & trends analysis
Interviews & case studies
Strategic recommendations
Vendor profiles & capabilities analysis
5-year forecasts
8 regions and 60+ country-level data splits
Market segment data splits
12 months of continuous data updates
DELIVERED AS:
PDF EXCEL ONLINE
Cell Culture Media Market Size and Share Forecast Outlook 2025 to 2035
Cell Culture Supplements Market Size and Share Forecast Outlook 2025 to 2035
Cell Culture Media & Cell Lines Market Size and Share Forecast Outlook 2025 to 2035
Cell Culture Media Bags Market Analysis - Size, Share, and Forecast 2025 to 2035
Cell Culture Sampling Devices Market Growth – Trends & Forecast 2025 to 2035
Cell Culture Incubator Market Growth – Trends & Forecast 2025 to 2035
Cell Culture Market Analysis – Trends, Growth & Forecast 2024-2034
3D Cell Culture Market - Demand, Size & Industry Trends 2025 to 2035
China Cell Culture Media Bags Market Insights – Size, Trends & Growth 2025-2035
India Cell Culture Media Bags Market Growth – Demand, Trends & Forecast 2025-2035
France Cell Culture Media Bags Market Trends – Size, Share & Growth 2025-2035
Germany Cell Culture Media Bags Market Growth – Demand, Trends & Forecast 2025-2035
Automated Cell Culture Systems Market Analysis - Size, Share & Forecast 2025-2035
United States Cell Culture Media Bags Market Outlook – Trends, Demand & Forecast 2025-2035
Pure Suspension Cell Culture Medium Market Size and Share Forecast Outlook 2025 to 2035
Balanced Salt Solution For Cell Culture Market
Cellulose Diacetate Film Market Size and Share Forecast Outlook 2025 to 2035
Waste Heat Power Generation Boiler Market Size and Share Forecast Outlook 2025 to 2035
Waste Wood Recycling Market Size and Share Forecast Outlook 2025 to 2035
Cellulose Fiber Market Forecast and Outlook 2025 to 2035

Thank you!
You will receive an email from our Business Development Manager. Please be sure to check your SPAM/JUNK folder too.
Chat With
MaRIA