

- Market Size (2026)
- USD 820.6 Mn
- Forecast (2036)
- USD 3262.5 Mn
- CAGR (2026 to 2036)
- 14.8%
How big is the Ceramic Battery Insulation Sheets Market in 2026?
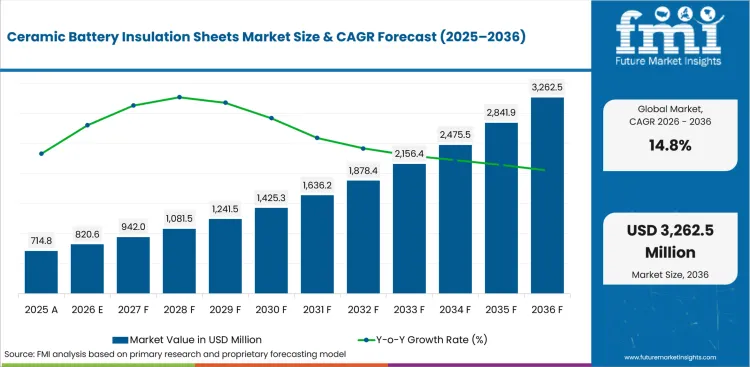
USD 820.6 million in 2026 and USD 3,262.5 million by 2036 at a 14.8% CAGR.
The ceramic battery insulation sheets market is moving from pack add-on protection into early battery architecture. Battery engineers select sheet materials while voltage layout and abuse-test files are prepared. Electric car sales exceeded 20 million in 2025 and reached one-quarter of all new car sales. Larger pack programs make heat spread control and dielectric separation part of design approval before final drawings are released.
EV pack programs need thin barriers delaying flame movement without reducing usable cell space. ESS integrators add a second buyer group as safety reviews examine passive layers beside detection and suppression systems. The USA Department of Energy identified thermal runaway as the primary Li-ion battery safety concern in May 2024. Material suppliers gain attention when test files explain sheet behavior during abuse events and venting sequences.
Buyers compare battery insulation sheets through thickness stability and repeat cutting quality. Qualification work also checks electrical insulation and supplier response during pack trials. EV battery deployment reached around 1.2 TWh in 2025 after rising almost 30% from 2024. Commercial decisions therefore rest on proof for a sheet being able to hold performance across repeated assembly lots.
| Metric | Value |
|---|---|
| 2025 Market Size | USD 714.8 million |
| 2026 Market Size | USD 820.6 million |
| 2036 Market Size | USD 3,262.5 million |
| Forecast CAGR (2026-2036) | 14.8% |
| Sales Channel Focus | Direct to Battery OEM |
| Direct to Battery OEM Share (2026) | 63.2% |
| Battery Type Focus | EV Battery Packs |
| EV Battery Packs Share (2026) | 61.8% |
| Function Focus | Thermal Runaway Barrier |
| Thermal Runaway Barrier Share (2026) | 52.6% |
| Fastest-growing Country | China |
| China CAGR by 2036 | 17.5% |
Summary of the Ceramic Battery Insulation Sheets Market
| Market Signal | Commercial Impact |
|---|---|
| Demand and Growth Drivers | Demand for ceramic battery insulation sheets is increasing as battery pack designers move passive safety materials into early pack architecture.
|
| Product and Segment View | Segment demand is led by direct battery OEM sourcing and EV pack programs requiring validated ceramic sheet performance.
|
| Geography and Growth Outlook | Regional demand is strongest across countries with battery production scale and export-grade EV platform programs.
|
| Competitive Landscape | Competition focuses on ceramic material depth and conversion support for battery pack approval.
|
| Analyst Perspective | Ceramic battery insulation sheets are developing into a safety-qualification market linked to EV pack architecture and stationary storage reviews.
- Nikhil Kaitwade, Principal Consultant for Automotive at Future Market Insights |
How is the ceramic battery insulation sheets market segmented?
The ceramic battery insulation sheets industry is segmented by ceramic type, battery type, function, thickness, sales channel and region.
The ceramic battery insulation sheets market is segmented by ceramic type, battery type, function, thickness, sales channel and region. By ceramic type, coverage includes alumina fiber sheets, silica / aerogel sheets, mica-based sheets and other ceramic composites. By battery type, coverage includes EV battery packs, ESS battery systems, consumer battery modules and industrial battery packs. By function, coverage includes thermal runaway barrier, electrical insulation, flame barrier and compression / gap fill. By thickness, coverage includes <0.5 mm, 0.5-1.5 mm and >1.5 mm sheets. By sales channel, coverage includes direct to battery OEM, tier suppliers and distributors, with regional coverage across North America, Latin America, Europe, East Asia, South Asia and Pacific and the Middle East and Africa.
Why do alumina fiber sheets lead within the ceramic type category?
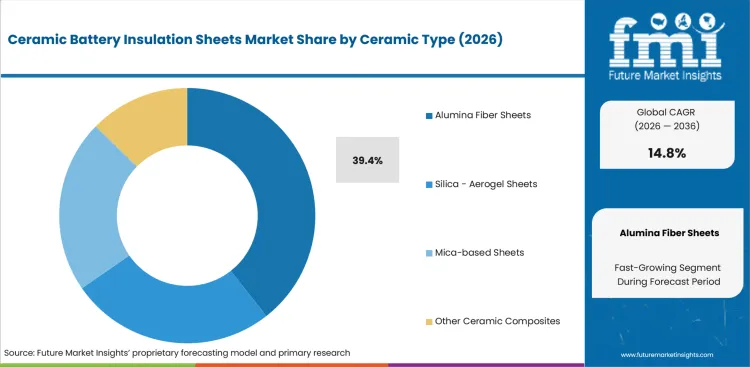
Alumina fiber sheets lead through heat stability and low-weight pack integration. Battery teams use them in cell spacers and covers since dense pack layouts leave limited room for bulky protection. EV battery deployment is expected to rise toward 4 TWh in the Announced Pledges Scenario by 2035, giving suppliers a larger cell-area base for sheet qualification.
- Alumina fiber sheets are expected to account for 39.4% share in 2026, backed by demand for heat-stable sheets able to be die-cut around cells and module walls. Buyers prefer materials adding protection without large weight penalties during pack design.
- Mica-based sheets remain important in high-dielectric zones. Alumina fiber gains selection attention once pack engineers compare thermal shock response and edge quality during repeated conversion trials.
What supports demand for EV battery pack applications?
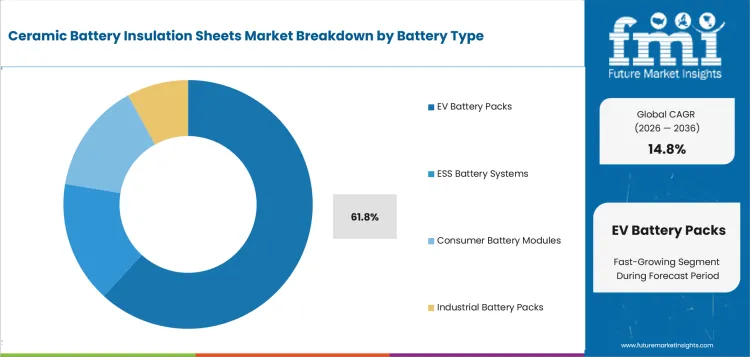
EV battery packs create the main demand pool for ceramic insulation sheets. Passenger and commercial platforms use repeated barriers between cells and near pack covers. IEA projects the global EV fleet could reach up to 510 million vehicles by 2035, which gives pack-level safety materials a longer platform runway.
- EV battery packs are anticipated to hold 61.8% share in 2026, led by high-volume platforms requiring repeated thermal and electrical protection layers. Sheet suppliers gain approval once their materials fit tight pack drawings and pass abuse-test review.
- Battery engineers compare ceramic sheet thickness against usable energy density. Products below 1.5 mm gain attention in dense designs once compression behavior and flame response are proven through controlled pack-level testing.
How do buyers evaluate thermal runaway barrier within function?
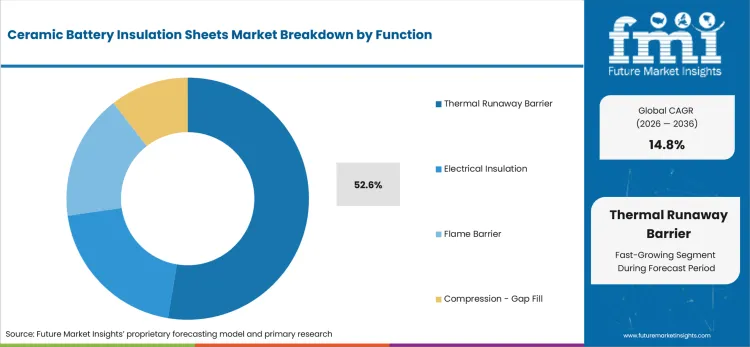
Thermal runaway barrier demand reflects a shift from simple insulation toward propagation delay. DOE safety planning in May 2024 identified thermal runaway as the primary safety concern for Li-ion batteries. Pack teams therefore assess how barriers behave after a cell failure and during venting events.
- Thermal runaway barrier is projected to represent 52.6% share in 2026, supported by buyers specifying materials slowing cell-to-cell heat transfer. Rogers’ 2025 flame-rating guidance references UL 94 V-0 for designs requiring higher flame-control assurance.
- Material choice is tested beside vent paths and pack covers. Saint-Gobain reported TRP insulation maintained more than 600 degrees Celsius temperature delta during a 5-minute exposure to an 800 degrees Celsius hot plate.
What market factors influence the 0.5-1.5 mm thickness range?
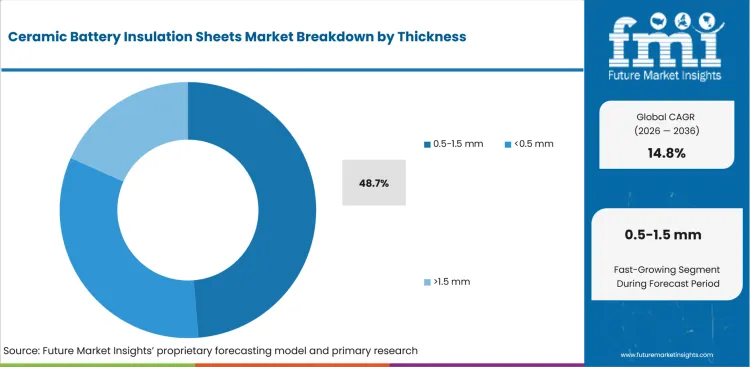
0.5-1.5 mm sheets give buyers a practical balance between protection and pack density. Thin formats help conserve cell volume, while mid-range sheets can add compression stability during abuse testing. Saint-Gobain reported TRP1000 compression property was kept over 10,000 compression cycles, showing why mechanical behavior influences thickness approval.
- 0.5-1.5 mm sheets are set to secure 48.7% share in 2026, driven by pack layouts requiring barrier strength without excess volume loss. Mid-range thickness supports module partitions and cover-adjacent protection.
- Consumer modules can accept thinner sheets in several layouts. EV packs often need mid-range formats since compression and cut tolerance become harder to manage after modules scale into vehicle platforms.
How is direct to battery OEM positioned within the sales-model category?
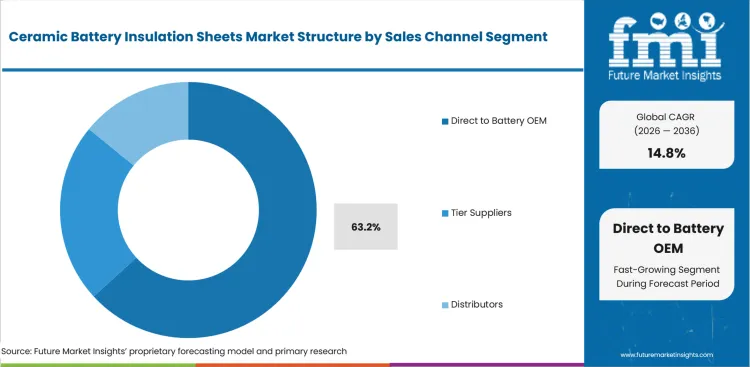
Direct to battery OEM sourcing is central to ceramic sheet buying as qualification files attach to platform drawings. Battery OEMs want supplier accountability for material consistency and engineering support before commercial production. Saint-Gobain states that common battery pack tests include 1000-1500 degrees Celsius torch testing or UL94 testing, giving buyers a clear reason to keep suppliers close to engineering teams.
- Direct to battery OEM is expected to capture 63.2% share in 2026, driven by material approval work completed before pack drawings and safety files close. Suppliers gain commercial strength on supporting engineering teams through the full qualification sequence.
- Distributors remain useful for samples and prototype builds. High-volume EV programs move toward direct supply once batch consistency and abuse-test documentation are accepted by battery platform teams.
What are the drivers, restraints, and opportunities in the Ceramic Battery Insulation Sheets Market?
Near-term purchases are shaped by thermal propagation control and pack qualification discipline outlined below.
- Driver: EV pack safety programs increase ceramic sheet demand once battery makers need thin barriers slowing heat transfer between cells. IEA reported EV battery deployment at 1.2 TWh in 2025, which raised the material area needing thermal and electrical protection.
- Restraint: Qualification time can slow adoption when suppliers lack pack-level test data and conversion proof. DOE safety planning in 2024 identified safety documentation as one of three challenge areas for energy storage safety work.
- Opportunity: ESS safety reviews create a second route for ceramic sheets beyond passenger vehicles. Global EV battery deployment is expected to reach almost 5 TWh by 2035 under the Stated Policies Scenario, raising supplier interest in scalable safety materials.
Ceramic sheet demand rises when battery makers treat safety layers as part of pack architecture. ACEA reported battery-electric cars captured 17.4% of EU market share in 2025, up from 13.6% one year earlier. Larger BEV programs raise the number of cell interfaces requiring thermal separation and dielectric protection. Suppliers proving repeatable insulation performance can support larger platform awards.
Qualification risk remains a practical constraint for new suppliers. Pack makers need evidence on flame delay and electrical insulation before a material enters drawings. Saint-Gobain reported TRP insulation-maintained material integrity with more than 600 degrees Celsius temperature delta during 6-minute exposure to a 1000 degrees Celsius direct torch. Suppliers without comparable proof face longer approval cycles.
ESS applications create an expansion path for ceramic insulation sheet suppliers. Battery rooms need passive layers helping contain incidents after a cell failure. DOE safety planning gives system owners a documented reason to examine thermal runaway behavior during design review. Suppliers with rack-level and module-level evidence can defend value beyond EV programs.
Which country CAGRs are profiled in the Ceramic Battery Insulation Sheets Market?
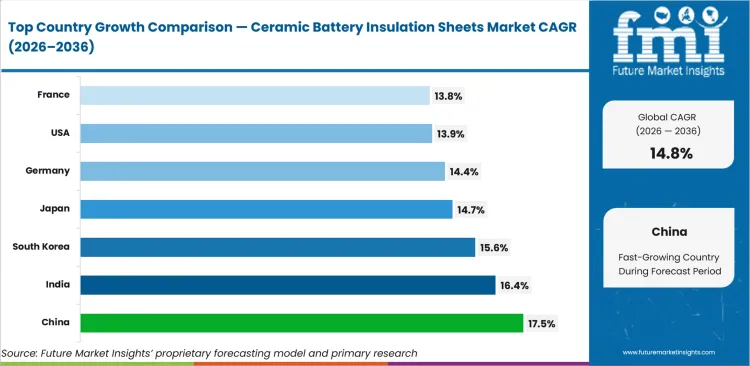
| Country | CAGR |
|---|---|
| China | 17.5% |
| India | 16.4% |
| South Korea | 15.6% |
| Japan | 14.7% |
| Germany | 14.4% |
| United States | 13.9% |
| France | 13.8% |
| United Kingdom | 13.6% |
Source: Future Market Insights analysis, 2026.
How do country-level CAGRs compare in the ceramic battery insulation sheets market?
Country growth in ceramic battery insulation sheets is expected to be led by EV pack scale and safety qualification intensity. China, India and South Korea connect sheet demand with battery production and export-grade cell programs. Japan, Germany, the United States, France and the United Kingdom connect adoption with vehicle programs and stricter pack safety reviews. For senior buyers, the commercial question is which market can connect approved materials with pack drawings and repeatable conversion support.
- China is estimated at 17.5% CAGR through 2036, supported by EV output depth and battery manufacturing scale being able to convert small material changes into large sheet volumes. Official data from the China Association of Automobile Manufacturers reported total auto output at 34.531 million vehicles in 2025, making ceramic insulation approval a production-scale decision for pack makers.
- India is projected at 16.4% CAGR by 2036, helped by local pack assembly and electric mobility programs requiring approved protection layers near cell groups. NITI Aayog reported Indian EV sales rising from 50,000 in 2016 to 2.08 million in 2024, giving suppliers a post-2024 volume base for localized insulation sourcing.
- South Korea is estimated to record 15.6% CAGR through 2036, reinforced by cell-export programs needing thin barriers with repeatable propagation and dielectric performance. IEA data show Korean battery electric car sales at about 200,000 units in 2025, strengthening domestic module safety and export qualification needs.
- Japan is set to post 14.7% CAGR by 2036, aided by compact module design needs and high-quality battery system requirements. Japan increased the FY2024 clean energy vehicle subsidy budget to 129.1 billion yen, giving battery material suppliers a policy-supported path for EV platform discussions.
- Germany is forecast to grow at 14.4% CAGR by 2036, underpinned by vehicle platform work and battery assembly programs requiring documented thermal protection. Federal energy transition reporting cited BEVs at 19.1% of all new car registrations in 2025, strengthening the pack-safety material base.
- United States is expected to expand at 13.9% CAGR through 2036, backed by EV pack safety needs and grid-storage projects requiring passive protection. Argonne reported plug-in electric vehicles at 9.1% of annual passenger vehicle sales in 2025, giving suppliers a measurable base for pack material qualification.
- France is projected to rise at 13.8% CAGR through 2036, reinforced by BEV programs requiring flame barrier and electrical insulation layers. European Alternative Fuels Observatory reported 363,130 BEV registrations in France during 2025, supporting a clearer pathway for pack safety material approval.
- United Kingdom is projected to rise at 13.6% CAGR through 2036, shaped by zero-emission vehicle rules and model programs requiring battery safety materials. SMMT reported new car registrations at 2.02 million in 2025 and almost half a million new BEVs joining UK roads.
Who are the notable companies in the Ceramic Battery Insulation Sheets Market?
3M, Saint-Gobain, Rogers Corporation, Alkegen, Morgan Advanced Materials, Elmelin, ZIRCAR Ceramics, ZIRCAR Refractories, Isolite Insulating Products and JBC Technologies are the notable companies shaping ceramic battery insulation sheets and battery safety material pathways.
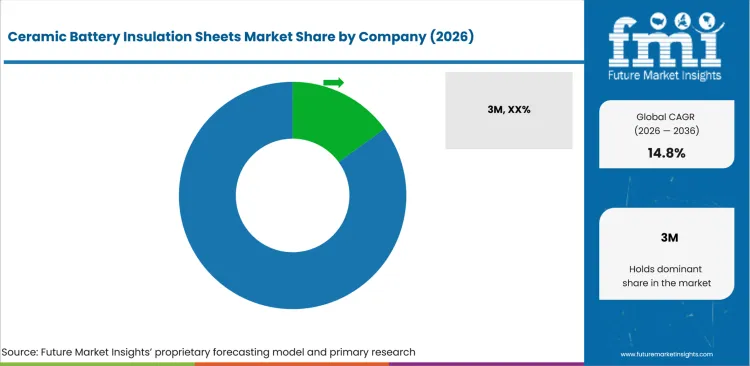
Competition in the ceramic battery insulation sheets market is grouped by how buyers want safety proof to work. Saint-Gobain and Rogers Corporation are stronger when thermal propagation evidence guides buyer confidence. 3M and JBC Technologies are important for converted insulation formats and adhesive-backed components. Alkegen and Morgan Advanced Materials add ceramic fiber and thermal barrier depth. Elmelin, ZIRCAR Ceramics, ZIRCAR Refractories and Isolite Insulating Products support mica-based and refractory sheet needs.
- Saint-Gobain has an advantage led by battery pack thermal runaway propagation solutions. Buyers can connect supplier materials with intercell pads and thermal insulation levels during EV pack safety planning.
- Rogers Corporation supports buyer review based on flame-rating and thermal propagation material references. Its 2025 guidance around UL 94 V-0 gives engineers a useful frame for compact high-power designs.
- 3M and JBC Technologies strengthen competition depending on adhesive-backed formats and electrical insulation support. Pack programs use such capabilities when cut quality and repeatability affect assembly speed.
- Alkegen, Morgan Advanced Materials, Elmelin and ZIRCAR suppliers compete due to high-temperature material depth. Buyers compare these companies through ceramic fiber capability and regional support.
Competitive Benchmarking: Ceramic Battery Insulation Sheets Market
| Company | Thermal Barrier Depth | Battery Pack Workflow Alignment | Feedstock Control Support | Geographic Reach |
|---|---|---|---|---|
| 3M | High | Strong | Strong | Global |
| Saint-Gobain | High | Strong | Strong | Global |
| Rogers Corporation | High | Strong | Medium | Global |
| Alkegen | Strong | Medium | Medium | Global |
| Morgan Advanced Materials | Strong | Medium | Medium | Global |
| Elmelin | Medium | Medium | Strong | Europe |
| ZIRCAR Ceramics | Medium | Medium | Medium | North America and export markets |
| ZIRCAR Refractories | Medium | Medium | Medium | Asia and export markets |
| Isolite Insulating Products | Medium | Medium | Medium | Japan and export markets |
| JBC Technologies | Medium | Medium | High | North America |
Source: Future Market Insights competitive analysis, 2026.
Key Developments in the Ceramic Battery Insulation Sheets Market
- In June 2025, Saint-Gobain Tape Solutions published material solutions for battery pack thermal runaway propagation mitigation. The update is important for insulation sheet buyers since TRP1000 at 1.6 mm prevented neighboring-cell thermal runaway during a module test and supported pack safety planning before abuse-test approval.
- In October 2025, Alkegen listed Battery Show India participation with FyreWrap LiB and AlkeGel Prism among battery technology offerings. The product positioning gives local pack teams a supplier route for thermal runaway mitigation and lightweight insulation materials during India’s battery expansion cycle.
- In November 2025, Elmelin published automotive mica insulation guidance covering battery pack insulation, passive fire protection and compression pads. The update strengthens mica-based sheet positioning for EV programs needing thermal stability across every cell and electrical insulation for high-voltage components.
Key Players in the Ceramic Battery Insulation Sheets Market
Thermal Barrier and Pack Safety Leaders
- 3M
- Saint-Gobain
- Rogers Corporation
- Alkegen
- Morgan Advanced Materials
Mica and Ceramic Sheet Specialists
- Elmelin
- ZIRCAR Ceramics
- ZIRCAR Refractories
- Isolite Insulating Products
Precision Conversion Specialists
- JBC Technologies
Ceramic Battery Insulation Sheets Market - Report Scope
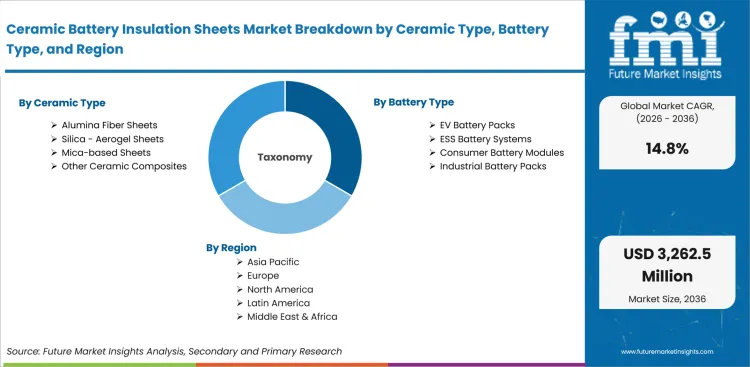
| Coverage field | Report scope |
|---|---|
| Market breakdown | Ceramic Battery Insulation Sheets Market Breakdown By Ceramic Type, Battery Type, Function, Thickness, Sales Channel, and Region |
| Market Definition | Thin inorganic sheets used inside battery packs and modules to slow heat transfer, block flame spread, and maintain electrical separation |
| Regions Covered | North America, Latin America, Europe, East Asia, South Asia and Pacific, Middle East and Africa |
| Countries Covered | United States, United Kingdom, Germany, France, Japan, China, South Korea, India and 30+ countries |
| Key Companies Profiled | 3M, Saint-Gobain, Rogers Corporation, Alkegen, Morgan Advanced Materials, Elmelin, ZIRCAR Ceramics, ZIRCAR Refractories, Isolite Insulating Products, JBC Technologies |
| Forecast Period | 2026 to 2036 |
| Approach | Hybrid bottom-up and top-down methodology using sheet area, pack output, thickness mix, application intensity and country-level adoption signals |
Source: Future Market Insights analysis, 2026.
Ceramic Battery Insulation Sheets Market - Research Methodology
| Method | Approach |
|---|---|
| Primary Research | FMI analysts reviewed inputs from battery pack engineers, insulation converters, ceramic material suppliers, EV platform teams, ESS integrators and safety testing service providers. Discussions focused on material qualification, thickness trade-offs, pack placement and buyer acceptance. |
| Desk Research | Desk research covered battery safety plans, EV battery deployment data, company product information, thermal barrier references, mica insulation guidance and public technical literature. Product coverage was checked against ceramic type, function, thickness route and commercial application. |
| Market Sizing and Forecasting | The model combined sheet area per pack with material price bands, pack output, thickness mix, sales channel structure and country-level EV or ESS demand signals. Forecast assumptions were adjusted for direct OEM approval, pack safety content and battery manufacturing scale. |
| Data Validation | Forecasts were checked against battery deployment signals, pack safety requirements, company product activity and supplier qualification patterns. Company portfolios were reviewed to avoid counting adjacent insulation products without battery pack sheet use. |
Ceramic Battery Insulation Sheets Market by Segments
Ceramic Battery Insulation Sheets Market segmented by Ceramic Type:
- Alumina Fiber Sheets
- Silica / Aerogel Sheets
- Mica-based Sheets
- Other Ceramic Composites
Ceramic Battery Insulation Sheets Market segmented by Battery Type:
- EV Battery Packs
- ESS Battery Systems
- Consumer Battery Modules
- Industrial Battery Packs
Ceramic Battery Insulation Sheets Market segmented by Function:
- Thermal Runaway Barrier
- Electrical Insulation
- Flame Barrier
- Compression / Gap Fill
Ceramic Battery Insulation Sheets Market segmented by Thickness:
- <0.5 mm
- 0.5-1.5 mm
- >1.5 mm
Ceramic Battery Insulation Sheets Market segmented by Sales Channel:
- Direct to Battery OEM
- Tier Suppliers
- Distributors
Ceramic Battery Insulation Sheets Market by Region:
- North America
- United States
- Canada
- Mexico
- Latin America
- Brazil
- Chile
- Rest of Latin America
- Western Europe
- Germany
- UK
- Italy
- Spain
- France
- Nordic
- BENELUX
- Rest of Western Europe
- Eastern Europe
- Russia
- Poland
- Hungary
- Balkan & Baltic
- Rest of Eastern Europe
- East Asia
- China
- Japan
- South Korea
- South Asia and Pacific
- India
- ASEAN
- Australia & New Zealand
- Rest of South Asia and Pacific
- Middle East & Africa
- Kingdom of Saudi Arabia
- Other GCC Countries
- Turkiye
- South Africa
- Other African Union
- Rest of Middle East & Africa
Research Sources and Bibliography
- Agency for Natural Resources and Energy. (2024, June 24). Subsidies upgraded for the purchase of clean energy vehicles toward the realization of GX in the automobile sector. Ministry of Economy, Trade and Industry.
- Alkegen. (2025, October 30). The Battery Show India, Booth #B362. Alkegen.
- Argonne National Laboratory. (2026). Light duty electric drive vehicles monthly sales updates. Argonne National Laboratory.
- Elmelin. (2025, November 3). How mica insulation powers the automotive and aerospace industries. Elmelin.
- European Alternative Fuels Observatory. (2026, January 21). France’s EV market in 2025: Renewed momentum and a growing fleet. European Commission.
- European Automobile Manufacturers’ Association. (2026, January 27). New car registrations: +1.8% in 2025; battery-electric 17.4% market share. European Automobile Manufacturers’ Association.
- Federal Ministry for Economic Affairs and Energy. (2026, January 27). Great prospects for electric mobility. Federal Ministry for Economic Affairs and Energy.
- International Energy Agency. (2026a, May 20). Electric vehicle batteries. In Global EV Outlook 2026. International Energy Agency.
- International Energy Agency. (2026b, May 20). Executive summary. In Global EV Outlook 2026. International Energy Agency.
- International Energy Agency. (2026c, May 20). Trends in electric cars. In Global EV Outlook 2026. International Energy Agency.
- International Energy Agency. (2026d, May). Global EV Outlook 2026 data. International Energy Agency.
- Press Information Bureau. (2025, August 4). NITI Aayog launches the report on Unlocking a $200 billion opportunity: Electric vehicles in India. Government of India.
- Rogers Corporation. (2025, October 16). Where UL 94 V-0 matters most: How to prioritize flame ratings in real-world designs. Rogers Corporation.
- Saint-Gobain Tape Solutions. (2025, June 17). Material solutions for battery pack thermal runaway propagation mitigation. Saint-Gobain.
- Society of Motor Manufacturers and Traders. (2026, January 6). UK new car market breaches two million as almost one in four buyers go electric. Society of Motor Manufacturers and Traders.
- State Council of the People’s Republic of China. (2026, January 14). China’s auto output, sales reach new highs in 2025. State Council of the People’s Republic of China.
- USA Department of Energy. (2024, May 14). Energy storage safety strategic plan. USA Department of Energy.
This bibliography is provided for reader reference and is not exhaustive. The full report contains the complete reference list and detailed citations.
This Report Answers
- What is the expected global value of the ceramic battery insulation sheets market in 2026 and 2036?
- What CAGR is forecast for ceramic battery insulation sheets during the 2026 to 2036 period?
- Which ceramic type category is used to assess alumina fiber sheets demand in 2026?
- Why do battery makers and ESS integrators buy controlled ceramic insulation sheet systems?
- How do alumina fiber and mica-based sheets shape battery thermal protection choices?
- Which countries are compared in the ceramic battery insulation sheets forecast?
- Which companies compete across thermal barrier and ceramic sheet pathways?
- What ceramic sheet systems and applications are included within the ceramic battery insulation sheets definition?
- How does FMI size and forecast ceramic battery insulation sheet demand across segments and countries?
- What implementation and supplier-selection factors should executives assess?
Frequently Asked Questions
What is driving growth in the ceramic battery insulation sheets market?
Growth is driven by thermal runaway barrier demand and the need to maintain electrical separation inside compact battery packs.
Why should executives track the ceramic battery insulation sheets market?
Executives should track this market since insulation sheet approval affects pack safety files and platform sourcing costs.
What business problem does the ceramic battery insulation sheets market address?
It helps battery makers slow heat transfer and maintain dielectric protection after a cell failure or thermal event.
What should sourcing leaders evaluate before selecting suppliers?
Sourcing leaders should compare thermal barrier proof and die-cut consistency before supplier approval.
What can limit return on investment for buyers?
Return on investment can be delayed when materials fail compression testing or need repeated validation after pack drawing changes. Buyers can reduce this risk by phasing qualification trials.
How can suppliers build executive confidence?
Suppliers build confidence through verified abuse-test records and accountable engineering support during scale-up.
Preview the report firsthand - request a free sample
Get SampleGet the brochure for pricing and purchase details.
Get PDFTable of Content
- Key Takeaways
- Market Size and CAGR
- Top Growth Driver
- Fastest Growing Segment
- Leading Region
- Key Companies
- Emerging Opportunities
- Executive Summary
- Global Market Outlook
- Demand-side Trends
- Supply-side Trends
- Technology Roadmap Analysis
- Analysis and Recommendations
- Analyst Perspective (What is happening? Why now? What should investors know?)
- Key Questions Answered
- How large is the market?
- What is the CAGR?
- What are key trends?
- Which region dominates?
- Who are the leaders?
- Market Overview
- Market Coverage / Taxonomy
- Market Definition / Scope / Limitations
- Research Methodology
- Chapter Orientation
- Analytical Lens and Working Hypotheses
- Market Structure, Signals, and Trend Drivers
- Benchmarking and Cross-market Comparability
- Market Sizing, Forecasting, and Opportunity Mapping
- Research Design and Evidence Framework
- Desk Research Programme (Secondary Evidence)
- Expert Input and Fieldwork (Primary Evidence)
- Tooling, Models, and Reference Databases
- Data Engineering and Model Build
- Quality Assurance and Audit Trail
- Market Background
- Market Dynamics (Drivers, Restraints, Opportunity, Trends)
- Scenario Forecast (Optimistic, Likely, Conservative)
- Impact Analysis
- AI Impact
- Sustainability Impact
- Regulatory Impact
- Technology Impact
- Consumer / Buyer Analysis
- Purchase Drivers
- Adoption Barriers
- Buyer Journey
- Opportunity Map Analysis
- Product Life Cycle Analysis
- Supply Chain Analysis
- Investment Feasibility Matrix
- Value Chain Analysis
- PESTLE and Porter's Analysis
- Regulatory Landscape
- Regional Parent Market Outlook
- Production and Consumption Statistics
- Import and Export Statistics
- Global Market Analysis and Forecast, 2021 to 2036
- Historical Market Size Value (USD Million) & Volume (Unit) Analysis, 2021 to 2025
- Current and Future Market Size Value (USD Million) & Volume (Unit) Projections, 2026 to 2036
- Y-o-Y Growth Trend Analysis
- Absolute $ Opportunity Analysis
- Global Market Pricing Analysis, 2021 to 2036
- Global Market Analysis and Forecast, By Ceramic Type, 2021 to 2036
- Introduction / Key Findings
- Historical Market Size Value (USD Million) & Volume (Unit) Analysis By Ceramic Type, 2021 to 2025
- Current and Future Market Size Value (USD Million) & Volume (Unit) Analysis and Forecast By Ceramic Type, 2026 to 2036
- Alumina Fiber Sheets
- Silica - Aerogel Sheets
- Mica-based Sheets
- Other Ceramic Composites
- Alumina Fiber Sheets
- Y-o-Y Growth Trend Analysis By Ceramic Type, 2021 to 2025
- Absolute $ Opportunity Analysis By Ceramic Type, 2026 to 2036
- Global Market Analysis and Forecast, By Battery Type, 2021 to 2036
- Introduction / Key Findings
- Historical Market Size Value (USD Million) & Volume (Unit) Analysis By Battery Type, 2021 to 2025
- Current and Future Market Size Value (USD Million) & Volume (Unit) Analysis and Forecast By Battery Type, 2026 to 2036
- EV Battery Packs
- ESS Battery Systems
- Consumer Battery Modules
- Industrial Battery Packs
- EV Battery Packs
- Y-o-Y Growth Trend Analysis By Battery Type, 2021 to 2025
- Absolute $ Opportunity Analysis By Battery Type, 2026 to 2036
- Global Market Analysis and Forecast, By Function, 2021 to 2036
- Introduction / Key Findings
- Historical Market Size Value (USD Million) & Volume (Unit) Analysis By Function, 2021 to 2025
- Current and Future Market Size Value (USD Million) & Volume (Unit) Analysis and Forecast By Function, 2026 to 2036
- Thermal Runaway Barrier
- Electrical Insulation
- Flame Barrier
- Compression - Gap Fill
- Thermal Runaway Barrier
- Y-o-Y Growth Trend Analysis By Function, 2021 to 2025
- Absolute $ Opportunity Analysis By Function, 2026 to 2036
- Global Market Analysis and Forecast, By Thickness, 2021 to 2036
- Introduction / Key Findings
- Historical Market Size Value (USD Million) & Volume (Unit) Analysis By Thickness, 2021 to 2025
- Current and Future Market Size Value (USD Million) & Volume (Unit) Analysis and Forecast By Thickness, 2026 to 2036
- 0.5-1.5 mm
- <0.5 mm
- >1.5 mm
- 0.5-1.5 mm
- Y-o-Y Growth Trend Analysis By Thickness, 2021 to 2025
- Absolute $ Opportunity Analysis By Thickness, 2026 to 2036
- Global Market Analysis and Forecast, By Sales Channel, 2021 to 2036
- Introduction / Key Findings
- Historical Market Size Value (USD Million) & Volume (Unit) Analysis By Sales Channel, 2021 to 2025
- Current and Future Market Size Value (USD Million) & Volume (Unit) Analysis and Forecast By Sales Channel, 2026 to 2036
- Direct to Battery OEM
- Tier Suppliers
- Distributors
- Direct to Battery OEM
- Y-o-Y Growth Trend Analysis By Sales Channel, 2021 to 2025
- Absolute $ Opportunity Analysis By Sales Channel, 2026 to 2036
- Global Market Analysis and Forecast, By Region, 2021 to 2036
- Introduction
- Historical Market Size Value (USD Million) & Volume (Unit) Analysis By Region, 2021 to 2025
- Current Market Size Value (USD Million) & Volume (Unit) Analysis and Forecast By Region, 2026 to 2036
- North America
- Latin America
- Western Europe
- Eastern Europe
- East Asia
- South Asia and Pacific
- Middle East & Africa
- Market Attractiveness Analysis By Region
- North America Market Analysis and Forecast, By Country, 2021 to 2036
- Historical Market Size Value (USD Million) & Volume (Unit) Trend Analysis By Market Taxonomy, 2021 to 2025
- Market Size Value (USD Million) & Volume (Unit) Forecast By Market Taxonomy, 2026 to 2036
- By Country
- USA
- Canada
- Mexico
- By Ceramic Type
- By Battery Type
- By Function
- By Thickness
- By Sales Channel
- By Country
- Market Attractiveness Analysis
- By Country
- By Ceramic Type
- By Battery Type
- By Function
- By Thickness
- By Sales Channel
- Key Takeaways
- Latin America Market Analysis and Forecast, By Country
- Historical Market Size Value (USD Million) & Volume (Unit) Trend Analysis By Market Taxonomy, 2021 to 2025
- Market Size Value (USD Million) & Volume (Unit) Forecast By Market Taxonomy, 2026 to 2036
- By Country
- Brazil
- Chile
- Rest of Latin America
- By Ceramic Type
- By Battery Type
- By Function
- By Thickness
- By Sales Channel
- By Country
- Market Attractiveness Analysis
- By Country
- By Ceramic Type
- By Battery Type
- By Function
- By Thickness
- By Sales Channel
- Key Takeaways
- Western Europe Market Analysis and Forecast, By Country
- Historical Market Size Value (USD Million) & Volume (Unit) Trend Analysis By Market Taxonomy, 2021 to 2025
- Market Size Value (USD Million) & Volume (Unit) Forecast By Market Taxonomy, 2026 to 2036
- By Country
- Germany
- UK
- Italy
- Spain
- France
- Nordic
- BENELUX
- Rest of Western Europe
- By Ceramic Type
- By Battery Type
- By Function
- By Thickness
- By Sales Channel
- By Country
- Market Attractiveness Analysis
- By Country
- By Ceramic Type
- By Battery Type
- By Function
- By Thickness
- By Sales Channel
- Key Takeaways
- Eastern Europe Market Analysis and Forecast, By Country
- Historical Market Size Value (USD Million) & Volume (Unit) Trend Analysis By Market Taxonomy, 2021 to 2025
- Market Size Value (USD Million) & Volume (Unit) Forecast By Market Taxonomy, 2026 to 2036
- By Country
- Russia
- Poland
- Hungary
- Balkan & Baltic
- Rest of Eastern Europe
- By Ceramic Type
- By Battery Type
- By Function
- By Thickness
- By Sales Channel
- By Country
- Market Attractiveness Analysis
- By Country
- By Ceramic Type
- By Battery Type
- By Function
- By Thickness
- By Sales Channel
- Key Takeaways
- East Asia Market Analysis and Forecast, By Country
- Historical Market Size Value (USD Million) & Volume (Unit) Trend Analysis By Market Taxonomy, 2021 to 2025
- Market Size Value (USD Million) & Volume (Unit) Forecast By Market Taxonomy, 2026 to 2036
- By Country
- China
- Japan
- South Korea
- By Ceramic Type
- By Battery Type
- By Function
- By Thickness
- By Sales Channel
- By Country
- Market Attractiveness Analysis
- By Country
- By Ceramic Type
- By Battery Type
- By Function
- By Thickness
- By Sales Channel
- Key Takeaways
- South Asia and Pacific Market Analysis and Forecast, By Country
- Historical Market Size Value (USD Million) & Volume (Unit) Trend Analysis By Market Taxonomy, 2021 to 2025
- Market Size Value (USD Million) & Volume (Unit) Forecast By Market Taxonomy, 2026 to 2036
- By Country
- India
- ASEAN
- Australia & New Zealand
- Rest of South Asia and Pacific
- By Ceramic Type
- By Battery Type
- By Function
- By Thickness
- By Sales Channel
- By Country
- Market Attractiveness Analysis
- By Country
- By Ceramic Type
- By Battery Type
- By Function
- By Thickness
- By Sales Channel
- Key Takeaways
- Middle East & Africa Market Analysis and Forecast, By Country
- Historical Market Size Value (USD Million) & Volume (Unit) Trend Analysis By Market Taxonomy, 2021 to 2025
- Market Size Value (USD Million) & Volume (Unit) Forecast By Market Taxonomy, 2026 to 2036
- By Country
- Kingdom of Saudi Arabia
- Other GCC Countries
- Türkiye
- South Africa
- Other African Union
- Rest of Middle East & Africa
- By Ceramic Type
- By Battery Type
- By Function
- By Thickness
- By Sales Channel
- By Country
- Market Attractiveness Analysis
- By Country
- By Ceramic Type
- By Battery Type
- By Function
- By Thickness
- By Sales Channel
- Key Takeaways
- Key Countries Market Analysis
- USA
- Pricing Analysis
- Market Share Analysis, 2025
- By Ceramic Type
- By Battery Type
- By Function
- By Thickness
- By Sales Channel
- Canada
- Pricing Analysis
- Market Share Analysis, 2025
- By Ceramic Type
- By Battery Type
- By Function
- By Thickness
- By Sales Channel
- Mexico
- Pricing Analysis
- Market Share Analysis, 2025
- By Ceramic Type
- By Battery Type
- By Function
- By Thickness
- By Sales Channel
- Brazil
- Pricing Analysis
- Market Share Analysis, 2025
- By Ceramic Type
- By Battery Type
- By Function
- By Thickness
- By Sales Channel
- Chile
- Pricing Analysis
- Market Share Analysis, 2025
- By Ceramic Type
- By Battery Type
- By Function
- By Thickness
- By Sales Channel
- Germany
- Pricing Analysis
- Market Share Analysis, 2025
- By Ceramic Type
- By Battery Type
- By Function
- By Thickness
- By Sales Channel
- UK
- Pricing Analysis
- Market Share Analysis, 2025
- By Ceramic Type
- By Battery Type
- By Function
- By Thickness
- By Sales Channel
- Italy
- Pricing Analysis
- Market Share Analysis, 2025
- By Ceramic Type
- By Battery Type
- By Function
- By Thickness
- By Sales Channel
- Spain
- Pricing Analysis
- Market Share Analysis, 2025
- By Ceramic Type
- By Battery Type
- By Function
- By Thickness
- By Sales Channel
- France
- Pricing Analysis
- Market Share Analysis, 2025
- By Ceramic Type
- By Battery Type
- By Function
- By Thickness
- By Sales Channel
- India
- Pricing Analysis
- Market Share Analysis, 2025
- By Ceramic Type
- By Battery Type
- By Function
- By Thickness
- By Sales Channel
- ASEAN
- Pricing Analysis
- Market Share Analysis, 2025
- By Ceramic Type
- By Battery Type
- By Function
- By Thickness
- By Sales Channel
- Australia & New Zealand
- Pricing Analysis
- Market Share Analysis, 2025
- By Ceramic Type
- By Battery Type
- By Function
- By Thickness
- By Sales Channel
- China
- Pricing Analysis
- Market Share Analysis, 2025
- By Ceramic Type
- By Battery Type
- By Function
- By Thickness
- By Sales Channel
- Japan
- Pricing Analysis
- Market Share Analysis, 2025
- By Ceramic Type
- By Battery Type
- By Function
- By Thickness
- By Sales Channel
- South Korea
- Pricing Analysis
- Market Share Analysis, 2025
- By Ceramic Type
- By Battery Type
- By Function
- By Thickness
- By Sales Channel
- Russia
- Pricing Analysis
- Market Share Analysis, 2025
- By Ceramic Type
- By Battery Type
- By Function
- By Thickness
- By Sales Channel
- Poland
- Pricing Analysis
- Market Share Analysis, 2025
- By Ceramic Type
- By Battery Type
- By Function
- By Thickness
- By Sales Channel
- Hungary
- Pricing Analysis
- Market Share Analysis, 2025
- By Ceramic Type
- By Battery Type
- By Function
- By Thickness
- By Sales Channel
- Kingdom of Saudi Arabia
- Pricing Analysis
- Market Share Analysis, 2025
- By Ceramic Type
- By Battery Type
- By Function
- By Thickness
- By Sales Channel
- Türkiye
- Pricing Analysis
- Market Share Analysis, 2025
- By Ceramic Type
- By Battery Type
- By Function
- By Thickness
- By Sales Channel
- South Africa
- Pricing Analysis
- Market Share Analysis, 2025
- By Ceramic Type
- By Battery Type
- By Function
- By Thickness
- By Sales Channel
- USA
- Market Structure Analysis
- Competition Dashboard
- Competition Benchmarking
- Market Share Analysis of Top Players
- By Regional
- By Ceramic Type
- By Battery Type
- By Function
- By Thickness
- By Sales Channel
- Emerging Startups
- Innovation Benchmarking
- Competition Analysis
- Competition Deep Dive
- 3M
- Overview
- Product Portfolio
- Profitability by Market Segments (Product/Region/Sales Channel)
- Sales Footprint
- Strategy Overview
- Marketing Strategy
- Product Strategy
- Channel Strategy
- Saint-Gobain
- Rogers Corporation
- Alkegen
- Morgan Advanced Materials
- Elmelin
- ZIRCAR Ceramics
- ZIRCAR Refractories
- Isolite Insulating Products
- 3M
- Case Studies
- Success Stories
- Recent Developments
- Competition Deep Dive
- Assumptions & Acronyms Used


