Reports

- Global Locations -

Headquarters

Future Market Insights, Inc.

Christiana Corporate, 200
Continental Drive, Suite 401,
Newark, Delaware - 19713,
United States

T: +1-845-579-5705

Americas

Future Market Insights, Inc.

616 Corporate Way, Suite 2-9018,
Valley Cottage, NY 10989, United States

T: +1-347-918-3531

MEA

Future Market Insights

1602-6 Jumeirah Bay X2 Tower, Plot No: JLT-PH2-X2A,
Jumeirah Lakes Towers, Dubai,
United Arab Emirates

Europe

Future Market Insights

3rd Floor, 207 Regent Street,
W1B 3HH London
United Kingdom

T: + 44 (0) 20 8123 9659
D: +44 (0) 20 3287 4268

Asia Pacific

Future Market Insights

IndiaLand Global Tech Park, Unit UG-1, Behind Grand HighStreet, Phase 1, Hinjawadi, MH, Pune – 411057, India

Mica Market Outlook from 2023 to 2033

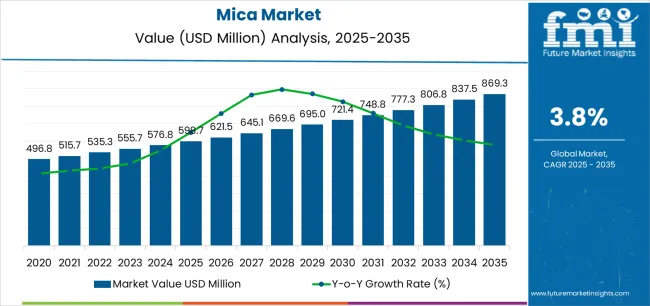
The global mica market size reached US$ 526.4 million in 2022. Over the forecast period 2023 to 2033, the global mica demand is anticipated to rise at a 4.8% CAGR. Total market value is predicted to increase from US$ 546.3 million in 2023 to US$ 874.8 million in 2033.

The demand for mica is projected to remain high in the cosmetics segment. The latest mica market analysis shows that the target segment is projected to thrive at a 5.2% CAGR during the assessment period.

Attributes Key Insights
Anticipated Mica Market Size in 2022 US$ 526.4 million
Estimated Value (2023) US$ 546.3 million
Projected Revenue (2033) US$ 874.8 million
Value-based CAGR (2023 to 2033) 4.8%
Collective Value Share: Top 5 Countries (2023E) 47.7%

Don't pay for what you don't need

Customize your report by selecting specific countries or regions and save 30%!

Key Mica Market Highlights

Market to Expand Around 1.6X through 2033

The global mica market is predicted to expand around 1.6x through 2033, amid a 3.2% increase in expected CAGR compared to the historical one. This is due to the growing demand for natural mica in different sectors such as electronics, paints & coatings, and construction.

Global sales of mica are also expected to rise due to rapid population growth, increasing usage due to thermal & heat-resistant properties, and growing demand for enhanced texture & durability in paints and coatings. By 2033, the total market revenue is set to reach US$ 874.8 million.

East Asia to Remain the Hotbed for Mica Manufacturers

As per the latest analysis, East Asia is expected to retain its dominance in the global mica market during the forecast period. It is set to hold around 26.3% of the global market share in 2033. This is attributed to the following factors:

  • Dominance in Global Mica Production: China had the most prominent production capacity in 2022. In the forecast period, it is expected to remain the leading natural and synthetic mica production hub. The nation's substantial rise is due to its commitment to innovation and a strategic focus on meeting the burgeoning demand across diverse industries.
  • Significant Global Demand: China, Japan, and South Korea stand out as the foremost contributors in the mica production landscape across East Asia, wielding substantial influence in both production and export. China is a significant player in mica product exports, boasting a leading import value worldwide. The surging mica demand in China is multifaceted, driven by its crucial role in insulating electrical devices and automotive components. Its ability to impart shimmer and shine to cosmetics, fortify paint’s durability, introduce a pearlescent effect, and elevate overall texture would aid demand.
  • Investments in Developing Infrastructure: Investments in mica infrastructure are surging, particularly in China, Japan, and South Korea. China, equipped with advanced production facilities, dominates mica output. It is driving substantial product creation. China has the most crucial production capacity of natural mica minerals, such as mica scrap, flakes, and blocks. Countries in East Asia are investing to develop and expand the production and processing of mica infrastructure to meet the growing demand. As infrastructure flourishes in this region, the mica market anticipates robust growth through 2033.

A Positive Natural Mica Industry Outlook is on the Way

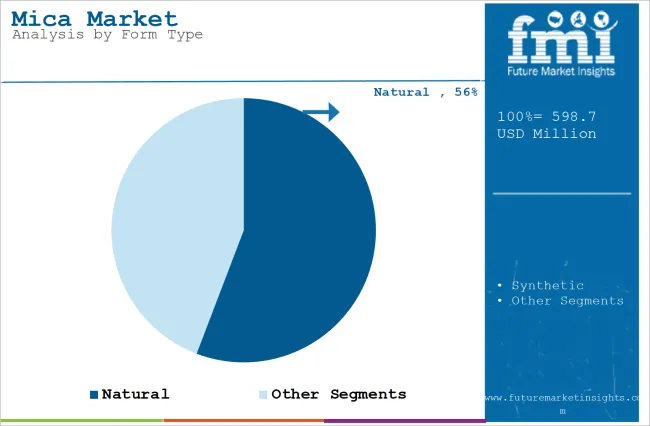
As per the report, by form type, natural mica is expected to dominate the global mica market with a volume share of about 75.7% in 2023. This is attributable to the rising usage of natural mica such as ground mica, sheet mica, and built-up mica due to their thermal insulation, heat resistance, and high durability.

The demand for natural mica is increasing as a result of its wide availability across the globe. It is renowned for its high purity and diverse applications in several industries globally.

Natural mica is also considered the most demanding form of mica in the global mica industry. Natural mica's increasing demand stems from its versatility and eco-friendly nature.

Widely sought after for its unique properties, it caters to several industries, including cosmetics, electronics, and construction, fostering sustained growth. Synthetic mica market growth, on the other hand, is anticipated to rise at a decent 4.6% CAGR during the forecast period.

Mica Market Trends

  • The global mica market is gaining traction due to the unique properties of the mineral, such as heat resistance, thermal insulation, shimmer, and texture. These properties are set to help in enhancing the visual appeal of makeup products.
  • Natural and synthetic mica is set to be used across diverse industries, including paints & coatings, electronics, construction, cosmetics, and others, thereby driving the growth of the mica market.
  • Significant growth in demand from a wide spectrum of applications is the key factor propelling the sales and revenue of the global mica market.
  • Companies in the mica processing industry are strategically pursuing acquisitions and making new investments to fortify their positions in response to evolving market dynamics.
  • Initiatives of leading players aim to enhance production capabilities, broaden product portfolios, and explore potential markets.
  • Through strategic acquisitions, companies seek synergies, improved operational efficiencies, and increased market share.
  • New investments are directed toward research & development, technology upgrades, and sustainable practices to meet the rising demand for responsibly sourced mica products. These strategic moves reflect a proactive approach to navigating industry challenges and capitalizing on emerging opportunities in the dynamic mica market.
  • The production of mica is steadily on the rise, mirroring the escalating demand across several industries.
  • China takes the lead as the primary producer of mica-based products, encompassing scraps, flakes, blocks, and more.
  • Countries in East Asia, with China and Japan at the forefront, followed by Europe-based counterparts such as Germany and Italy, emerged as the world's most prominent importers of mica-based products.
  • In the global export landscape, China and India prominently dominate, underscoring their substantial import value. This underscores that these countries hold significant growth potential for the thriving global market.
  • Companies in the mica industry are making substantial investments in research & development. This strategic emphasis on research is geared toward advancing processing technologies, developing new mica-based products, and ensuring sustainable mining practices.
  • The investments aim to stay ahead of market trends, enhance product quality, and address environmental concerns.
  • By fostering a culture of innovation, key companies strive to not only meet current industry demands but also anticipate future needs, positioning themselves as leaders in the dynamic and evolving market.
  • Manufacturers are investing in supply chain transparency, aligning with responsible sourcing practices to meet evolving consumer expectations.
  • Technology adoption in processing and extraction methods remains a priority, emphasizing efficiency, quality, and environmental considerations.
Nikhil Kaitwade
Nikhil Kaitwade

Principal Consultant

Talk to Analyst

Find your sweet spots for generating winning opportunities in this market.

2018 to 2022 Mica Market Outlook Vs. 2023 to 2033 Demand Forecast

Global sales of mica grew at a CAGR of 1.6% between 2018 and 2022. Total market revenue reached about US$ 526.4 million in 2022. In the forecast period, the worldwide mica industry is set to thrive at a CAGR of 4.8%.

Historical CAGR (2018 to 2022) 1.6%
Forecast CAGR (2023 to 2033) 4.8%

The global market for mica witnessed steady growth between 2018 and 2022. This was due to the substantial demand for mica products in the electronics, construction, cosmetics, and paint industries.

Over the forecast period, the international mica market is poised to exhibit healthy growth, totaling a valuation of US$ 874.8 million by 2033. The market will be driven by the rising demand from diverse industries such as electronics, cosmetics, and construction. Innovations in synthetic mica and advanced applications across end-use sectors are also poised to reshape the market dynamics, ensuring sustained expansion.

Key Mica Sheet Dynamics

  • Use in Construction Materials Propels Growth Amid Infrastructure Development

In construction, mica finds diverse applications due to its heat resistance, insulation, and durability properties. Sheet mica is set to be commonly utilized as a reinforcing agent in construction materials such as cement.

The ability of mica to withstand high temperatures and provide electrical insulation makes it valuable in insulation products and electrical components. The mineral is projected to enhance the performance and longevity of construction materials & structures. Mica is expected to be used in construction for reinforcing cement, asphalt shingles, insulation products, and electrical components, enhancing durability and performance.

The rising demand for public, commercial, and residential buildings, coupled with the increasing urban population, is driving a simultaneous surge in mica demand. The construction material market is expected to experience robust growth during the forecast period.

Emerging countries are investing significantly in the development of buildings, roads, bridges, tunnels, dams, and more. These changes are contributing to the increased demand for mica-based products in the construction industry.

  • A Wide Range of Potential Applications in Different Industries

Mica's versatility spans diverse sectors, including paints, electronics, construction, cosmetics, rubber, plastics, and more. The uses of mica range from insulating electrical devices and adding shimmer to cosmetics to enhancing paint durability and contributing to the weather resistance of roofing materials.

Mica is indispensable. Its varied applications extend to coatings, lubricants, capacitors, and decorative uses, making it a vital component across industries.

The wide applications of mica position it as a key driver for market growth. The industry is evolving with the surging demand for mica-based products.

Innovation, owing to its versatility in this industry, plays a key role in the growth and development of mica mining. Manufacturers leveraging these properties can anticipate a promising future, tapping into emerging opportunities across diverse sectors.

  • Rising Demand for Mica in the Electronics Sector

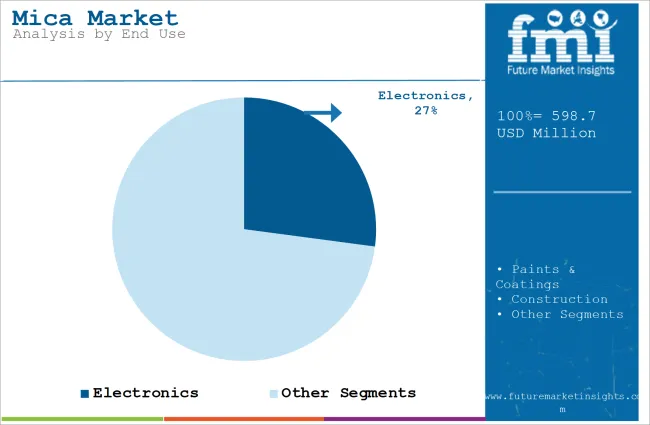
A significant driver in the mica industry is the rising demand for mica in the electronics sector, propelled by the increasing use of electronic devices worldwide. Mica, particularly in its natural or synthetic form, possesses exceptional electrical insulating properties, heat resistance, and thermal stability. These would make it a crucial component in several electronic applications.

With the proliferation of electronic devices such as smartphones, tablets, and wearable technology, the demand for mica as an insulating material in electrical & electronic products has surged. Mica is set to be utilized in the production of capacitors, insulators, and other electronic components, contributing to the efficient functioning and longevity of these devices.

The automotive industry, another leading consumer of mica, also relies on the mineral for its heat-resistant properties in brake linings and clutch plates. As the global electronics and automotive sectors continue to expand, the demand for mica is expected to rise steadily.

Ongoing advancements in electronic technologies, such as the development of electric vehicles and the implementation of a 5G network, are anticipated to further drive the demand for mica. Manufacturers in the mica industry are strategically positioned to capitalize on this driver by ensuring a stable and sustainable supply of mica for the evolving needs of the electronics and automotive sectors.

Get the data you need at a Fraction of the cost

Personalize your report by choosing insights you need
and save 40%!

Key Factors Restraining Global Mica Industry Innovations

  • The Adverse Impact of Mica Dust Exposure in the Production Process

Mica production involves mining, grinding, and processing crude mica. Extracted initially, raw mica is unsuitable for industries until further processing.

The production process generates mica dust, a byproduct that poses occupational health risks. Prolonged inhalation of this dust can lead to severe health issues, particularly lung scarring.

The adverse effects of mica dust inhalation can manifest in symptoms such as persistent coughing, shortness of breath, fatigue, and unintended weight loss. Workers across diverse industries are particularly vulnerable to these health risks. The sectors most affected by mica dust exposure include cosmetics factories, mining operations, milling facilities, agriculture-related activities, and construction sites.

Key companies need to implement better safety measures during the production of mica. The safety measures include the provision of protective equipment for workers, proper ventilation systems, and adherence to occupational health & safety guidelines. Regular health screenings and awareness programs are crucial to monitor and mitigate the impact of mica dust exposure on the well-being of workers in these industries.

  • Easy Availability of Substitute Products Can Hinder Growth

Mica, a versatile material crucial in electronics, construction, and cosmetics, confronts a potential growth impediment. The market’s anticipated slow growth stems from the widespread availability and cost-effectiveness of mica substitutes such as acrylate polymers, polyester, phenolic, nylon, fiberglass, and cellulose acetate, among others. These versatile alternatives find applications in insulation, electronics, and electrical functions, contributing to the market's challenging landscape.

The mica market faces a potential slowdown with the escalating adoption of these alternative materials. As industries opt for substitutes, the market undergoes a transformative shift. The usage of alternative products can impact the demand and growth trajectory of the market, signaling a need for strategic adaptations.

Manufacturers can diversify the changing market dynamics by strategically expanding into construction, cosmetics, and rubber applications. They can effectively counterbalance the advantages presented by mica's alternatives. This diversified approach not only ensures resilience against the market's constraints but also positions manufacturers to seize opportunities in sectors experiencing sustained demand, fostering long-term competitiveness.

Comparative View of Adjacent Mica Markets

The global mica market is set to be impacted by the peer or tangential markets in the chemicals and materials division. These include other types of markets, such as the electrical insulation material market and the thermal insulation market. Analysis of these related industries can provide deeper insights that would be helpful for developing unique differentiating strategies to pursue growth and opportunity in the market.

The global market for mica is anticipated to witness a CAGR of 4.8% in the evaluation period. This is attributed to the growing demand for sustainable and natural ingredients from the cosmetics & personal care industry.

The electrical insulation material market is anticipated to showcase a CAGR of 6.6% in the estimated period. This is mainly because of the rising electrification in several sectors, including electronics and automotive.

The thermal insulation material market will likely expand at a CAGR of 5.6% from 2023 to 2033. The increasing need for environmental sustainability & energy efficiency in several industrial and construction applications would aid demand.

Mica Market:

Attributes Mica Market
CAGR (2023 to 2033) 4.8%
Market Value (2023) US$ 546.3 million
Growth Factor Mica's use in construction materials propels growth amid increasing infrastructure development globally.
Key Trend The growing use of mica in cosmetics, driven by consumer preference for natural and shimmering products, is a leading trend.

Electrical Insulation Material Market:

Attributes Electrical Insulation Material Market
CAGR (2023 to 2033) 6.6%
Market Value (2023) US$ 10.70 billion
Growth Factor Rising demand for thermosets, such as epoxy resins, which are used in power generation to protect machines and equipment, is driving the electrical insulating material market.
Key Trend Compact electric motors are widely employed in micro gadgets with a wide range of power supplies.

Thermal Insulation Material Market:

Attributes Thermal Insulation Material Market
CAGR (2023 to 2033) 5.6%
Market Value (2023) US$ 70.74 billion
Growth Factor Residential and commercial demand for solar panels is set to rise as energy conservation and greenhouse gas emissions are becoming more of a focus.
Key Trend With increasing environmental concerns, passenger comfort, and fuel efficiency, thermal insulation will become more relevant.

Country-wise Insights

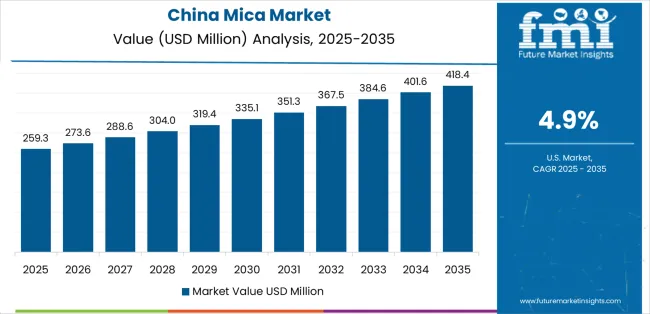
The table below highlights key countries’ mica market revenues. China, the United States, and India are expected to remain the top three consumers of mica, with expected valuations of US$ 158.9 million, US$ 96.4 million, and US$ 79.7 million, respectively, in 2033.

Countries Estimated Revenue (2033)
China US$ 158.9 million
United States US$ 96.4 million
India US$ 79.7 million
Japan US$ 51.5 million
Germany US$ 42.1 million
Brazil US$ 35.2 million

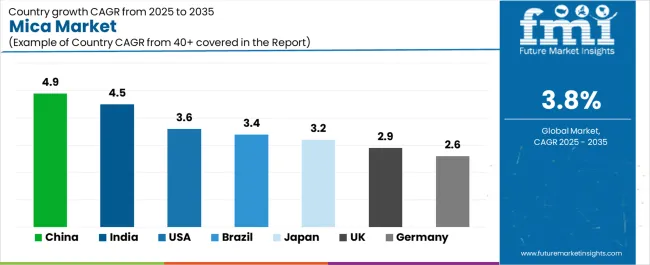
The table below shows the estimated growth rates of the top five countries. India, the Kingdom of Saudi Arabia, and China are set to record high CAGRs of 5.9%, 5.5%, and 5.4%, respectively, through 2033.

Countries Projected CAGR (2023 to 2033)
India 5.9%
Kingdom of Saudi Arabia 5.5%
China 5.4%
Brazil 5.4%
Australia and New Zealand 5.3%

China to Remain at the Epicenter of Mica Product Manufacturing

Sales of mica in China are projected to soar at a CAGR of around 5.4% during the assessment period. The total valuation in the country is anticipated to reach US$ 158.9 million by 2033.

China stands out in the global mica market, being the most prominent producer of natural mica. Abundant and most-produced natural mica, especially ground mica in several forms, such as flakes, scraps, and blocks, fuels China's leading position, ensuring a robust market presence.

China's burgeoning construction and electronics industries are key catalysts propelling mica sales. As these sectors grow, the need for mica in paints, coatings, and electronic applications intensifies, positioning China at the forefront of future market expansion.

China has also solidified its status as a manufacturing hub, leveraging technological advancements and innovation. Its growing population and urban development would contribute to a skyrocketing demand for mica. China’s prowess in processing mica, both natural and synthetic, cements its role as a key player, influencing global trends and setting new standards in mica-based product development.

As the world's most important exporter of mica products, China's influence extends globally. The country's strategic position in international trade, coupled with its diverse mica offerings and manufacturing capabilities, further solidifies its role as a prominent player in shaping the trajectory of the global market.

Booming Paints and Electronics Sectors Fueling Demand in the United States

The United States’ mica market size is projected to reach US$ 96.4 million by 2033. Over the assessment period, demand for mica in the United States is set to rise at a 4.7% CAGR.

Several factors are expected to drive growth in the United States. These include the country’s strong electronics and paint industries.

The United States stands as a prominent player in the global mica industry, wielding influence through robust consumption and active participation in international trade. As a leading player, the United States would create an impact on shaping mica insulation trends.

The booming electronics sector in the United States presents a new opportunity for mica production. Mica's vital role in insulating components and ensuring optimal performance positions the country for significant growth. This is mainly driven by increasing demand in this technology-driven landscape with the proliferation of electronic devices.

The United States is further fueled by the thriving paints and coatings industry. As the construction sector flourishes, the demand for high-quality paints and coatings rises, propelling the use of mica for its unique properties that enhance durability and aesthetics. This surge in demand further establishes the United States as a key player in the global market.

India to Create Ample Opportunities for Mica Manufacturers

The mica market value in India is anticipated to total US$ 79.7 million by 2033. Over the forecast period, mica demand in the country is set to increase at a robust CAGR of 5.9%.

India presents a promising mica industry due to several factors. The country is experiencing substantial industrial growth and urbanization, leading to the expansion of the electronics, construction, and paints & coating industries. With the rise of these industries, India will likely experience a robust growth rate during the forecast period.

The expanding paints & coatings industry in India is a prominent driver for the growth of the market. The demand for high-quality paints & coatings is on the rise with a burgeoning population and increasing infrastructure requirements. Mica, especially ground and sheet forms, is witnessing heightened demand, driven by the need for durable and aesthetically pleasing construction materials.

As per India's mica market trends and analysis, growth is propelled by the booming electronics sector. As the country embraces technological advancements, the demand for mica in electronic components and devices is escalating. This surge aligns with India's push toward digitalization, making the electronics industry a leading driver for the future expansion of the market.

India's expansive market size plays a pivotal role in shaping the mica industry. As the country positions itself as the next manufacturing hub, international companies are establishing strong economic ties.

India's increasing influence on the global stage is expected to amplify the demand for mica, making it a key player in steering the overall growth and dynamics of the market. The strategic alliances and economic collaborations would further position India as a significant force in shaping the future of the mica industry.

Growing Demand for Clean Water to Boost Sales of Mica Products in Japan

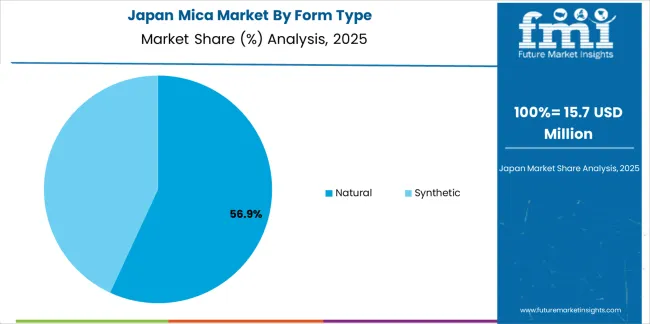
Japan’s mica market is poised to exhibit a CAGR of 4.6% during the evaluation period. It is expected to attain a market valuation of US$ 51.5 million by 2033.

Japan emerges as a significant player in the global market, poised for substantial future growth. Renowned for technological innovation, Japan leverages both natural and synthetic mica, enhancing its prominence on the international stage. It also contributes to global market dynamics with a commitment to quality and advanced production methods.

The burgeoning construction industry is a pivotal driver for Japan's market growth. As population growth fuels the demand for housing and infrastructure, mica, especially in ground and sheet forms, gains prominence. With an increasing need for durable and water-resistant materials, mica addresses challenges in coastal areas, amplifying its significance in construction applications and fostering demand in Japan.

Japan's market is also propelled by the robust electronics sector. Renowned for technological advancements, the country's demand for mica in electronic components and devices continues to rise. The sophisticated electronic manufacturing landscape positions Japan as a key contributor to the global mica market.

Category-wise Insights

The below section shows the natural mica form type to remain dominant in the forecast period. It is projected to thrive at a 4.8% CAGR between 2023 and 2033.

Natural Mica to Exhibit Exponential Demand Worldwide

Top Segment (Form Type) Natural Mica
Predicted CAGR (2023 to 2033) 4.8%

Based on form type, the global market for mica is segmented into natural mica and synthetic mica. Among these, end-users mainly prefer natural mica for a wide range of applications.

The demand for natural mica is increasing since it is mined from the earth's crust and stands out for its purity and geological origins. Natural mica is characterized by diverse mineral compositions.

It offers a wide range of physical and chemical properties. Hence, it is expected to be widely utilized across industries such as paints, coatings, electronics, construction, cosmetics, rubber, plastics, and more. Its natural brilliance and resilience would make it a sought-after material, contributing to growth.

It is anticipated to hold a significant volume share of 74.7% in 2023. Over the forecast period, demand for natural mica is predicted to rise at a CAGR of 4.8%. The target segment is estimated to reach US$ 744.1 million by 2033.

Demand for Ground Mica to Remain High under the Grade Segment

Top Segment (Grade) Ground Mica
Projected CAGR (2023 to 2033) 5.1%

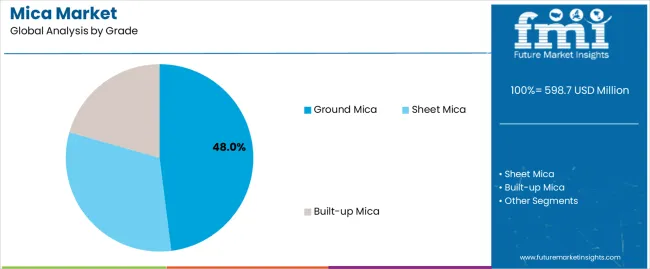
The ground mica segment is anticipated to hold a dominant share through 2033. It is set to exhibit a CAGR of 5.1% in the forecast period.

The finely processed mineral particles of ground mica are expected to serve as a versatile component across industries. It is projected to enhance several properties in paints, plastics, cosmetics, and other applications.

The micronized nature of ground mica imparts unique textural and reflective attributes, making it a preferred choice for achieving desired effects in several formulations. Its adaptability and ease of incorporation would position ground mica as a fundamental grade in industries seeking improved performance and visual appeal. The target segment is estimated to reach US$ 422.7 million by 2033.

Demand for Mica in the Cosmetics Industry to Remain High

Top Segment (End-use) Cosmetics
Projected CAGR (2023 to 2033) 5.2%

Based on end-use, the cosmetics segment is anticipated to hold a significant share through 2033. It is set to exhibit a CAGR of 5.2% during the forecast period.

The cosmetics industry is anticipated to expand due to several factors. The ability of mica to enhance the visual appeal of makeup is expected to aid demand. As mica is capable of imparting shimmer and texture to a myriad of products, its demand would rise.

Its versatility would help develop formulations that balance aesthetics with skin-friendly attributes. As a key ingredient, mica contributes to the creation of makeup products that not only elevate beauty standards but also prioritize the well-being of the skin. This is projected to help in reflecting the evolving demands of the cosmetics industry.

Competitive Landscape

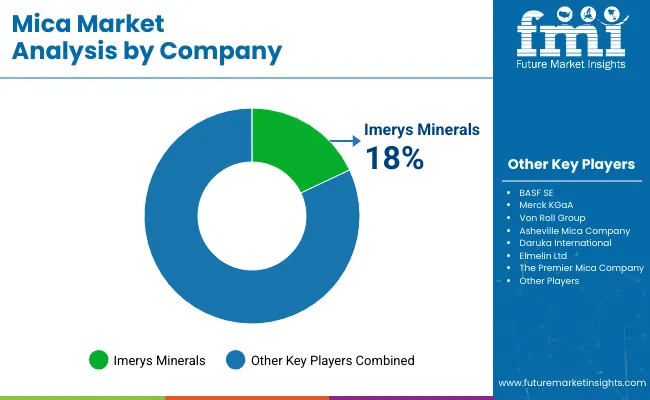
The global mica market is fragmented, with leading players accounting for about 20% to 25% of the share. Merck KGaA, Imerys S.A., BASF SE, Von Roll Group, Asheville Mica Company, Elmelin Ltd, Daruka Minerals, The Premier Mica Company, Shanghai Green Tech Co., Ltd., Micafab India Private Limited, Spruce Pine Mica Co., Mica Manufacturing Co. Pvt. Ltd, Ruby Mica Co. Ltd., and Vasundhara Mica International are the leading manufacturers and suppliers of mica listed in the report.

Key mica manufacturers are investing in continuous research for producing new products and increasing their production capacity to meet end-user demand. They are also showing an inclination toward adopting strategies, including acquisitions, partnerships, mergers, and facility expansions, to strengthen their footprint.

Recent Developments in the Mica Market

  • In January 2023, Global New Material International Holdings Limited announced that it will subscribe for around 1.18 million CQV Treasury Shares and buy about 3.13 million shares of CQV Co. Ltd. The company will own 42.45% of the outstanding shares of CQV both directly and indirectly, making it the firm’s single largest stakeholder.
  • In January 20223, Hemant Soren, the Chief Minister of Jharkhand, signaled off cars to resume the mica waste dumping yard in Koderma district. It is a smart move that will help revitalize the mica mining business.

Mica Industry Research Scope

Attribute Details
Estimated Market Size (2023) US$ 546.3 million
Projected Market Size (2033) US$ 874.8 million
Anticipated Growth Rate (2023 to 2033) 4.8%
Historical Data 2018 to 2022
Forecast Period 2023 to 2033
Quantitative Units Value (US$ million) and Volume (metric tons)
Report Coverage Revenue Forecast, Volume Forecast, Company Ranking, Competitive Landscape, Growth Factors, Trends, and Pricing Analysis
Market Segments Covered
  • Form Type
  • Grade
  • End-use
  • Region
Regions Covered
  • North America
  • Latin America
  • Western Europe
  • Eastern Europe
  • East Asia
  • South Asia Pacific
  • Middle East & Africa
Key Countries Covered
  • United States
  • Canada
  • Mexico
  • Brazil
  • Germany
  • Italy
  • France
  • United Kingdom
  • Spain
  • BENELUX
  • NORDICS
  • Poland
  • Hungary
  • Balkan and Baltics
  • Russia
  • India
  • Association of Southeast Asian Nations
  • Australia and New Zealand
  • China
  • Japan
  • South Korea
  • Kingdom of Saudi Arabia
  • Other GCC Countries
  • Turkiye
  • Other African Union
  • South Africa
Key Companies Profiled
  • Merck KGaA
  • Imerys S. A.
  • BASF SE
  • Von Roll Group
  • Asheville Mica Company
  • Elmelin Ltd
  • Daruka Minerals
  • The Premier Mica Company
  • Shanghai Green Tech Co., Ltd.
  • Micafab India Private Limited
  • Spruce Pine Mica Co.
  • Mica Manufacturing Co. Pvt. Ltd
  • Ruby Mica Co. Ltd.
  • Vasundhara Mica International

Mica Market Outlook by Category

By Form Type:

  • Natural
  • Synthetic

By Grade:

  • Ground Mica
  • Sheet Mica
  • Built-up Micaa

By End-use:

  • Paints & Coatings
  • Electronics
  • Construction
  • Cosmetics
  • Others

By Region:

  • North America
  • Latin America
  • Western Europe
  • Eastern Europe
  • East Asia
  • South Asia & Pacific
  • Middle East & Africa

Frequently Asked Questions

What was the value of the global market in 2022?

The global market was valued at US$ 526.4 million in 2022.

How big is the mica market?

The global market value is set to reach US$ 546.3 million in 2023.

At what rate will the global demand rise through 2033?

Global mica demand is anticipated to rise at a 4.8% CAGR.

What is the expected market size in 2033?

The global mica market size is set to reach US$ 874.8 million by 2033.

Which end-use segment is expected to lead the market?

Cosmetics is expected to lead the market during the forecast period.

What is the ideal form type of mica?

The natural form type is the most used mica.

Which grade segment is expected to lead the market?

Ground mica is expected to lead the market during the forecast period.

What is mica used for?

Mica is set to be used in shingles, roofing, paints, and automotive components.

Why is mica in demand?

Mica demand is pushed by its increasing use in the cosmetics industry.

What is the demand for mica in India?

India’s mica market is anticipated to reach US$ 79.7 million by 2033.

Where is mica mostly found in India?

The northern edge of the Chota Nagpur plateau has reserves of mica.

Table of Content

1. Executive Summary

    1.1. Global Market Outlook

    1.2. Demand Side Trends

    1.3. Supply Side Trends

    1.4. Technology Roadmap

    1.5. Analysis and Recommendations

2. Market Overview

    2.1. Market Coverage / Taxonomy

    2.2. Market Definition / Scope / Limitations

3. Key Market Trends

    3.1. Key Trends Impacting the Market

    3.2. Product Innovation / Development Trends

4. Key Success Factors

    4.1. Product Adoption / Usage Analysis

    4.2. Product USP’s / Features

    4.3. Strategic Promotional Strategies

5. Global Market Demand Analysis 2018 to 2022 and Forecast, 2023 to 2033

    5.1. Historical Market Volume (tons) Analysis, 2018 to 2022

    5.2. Current and Future Market Volume (tons) Projections, 2023 to 2033

    5.3. Y-o-Y Growth Trend Analysis

6. Global Market - Pricing Analysis

        6.1.1. Regional Pricing Analysis By Form Type

        6.1.2. Global Average Pricing Analysis Benchmark

7. Global Market Demand (in Value or Size in US$ million) Analysis 2018 to 2022 and Forecast, 2023 to 2033

    7.1. Historical Market Value (US$ million) Analysis, 2018 to 2022

    7.2. Current and Future Market Value (US$ million) Projections, 2023 to 2033

        7.2.1. Y-o-Y Growth Trend Analysis

        7.2.2. Absolute $ Opportunity Analysis

8. Market Background

    8.1. Macro-Economic Factors

        8.1.1. Global GDP Growth Outlook

        8.1.2. Global Chemical Industry Overview

        8.1.3. Global Electronics Industry Outlook

    8.2. Forecast Factors - Relevance and Impact

        8.2.1. Top Companies Historical Growth

        8.2.2. Urban Population Growth Outlook

        8.2.3. Manufacturing Industry Outlook

        8.2.4. Per Capita Spending Outlook

        8.2.5. Business Climate

        8.2.6. Value Chain

            8.2.6.1. Raw Material Suppliers

            8.2.6.2. Product Manufacturers

            8.2.6.3. End-uses

        8.2.7. COVID-19 Crisis – Impact Assessment

            8.2.7.1. Current Statistics

            8.2.7.2. Short-Mid-Long Term Outlook

            8.2.7.3. Likely Rebound

        8.2.8. Market Dynamics

            8.2.8.1. Drivers

            8.2.8.2. Restraints

            8.2.8.3. Opportunity Analysis

        8.2.9. Global Supply-Demand Analysis

        8.2.10. Patent Analysis

        8.2.11. Key Regulation Overview

9. Global Market Analysis 2018 to 2022 and Forecast 2023 to 2033, by Form Type

    9.1. Introduction / Key Findings

    9.2. Historical Market Size (US$ million) and Volume Analysis by Form Type, 2018 to 2022

    9.3. Current and Future Market Size (US$ million) and Volume Analysis and Forecast by Form type, 2023 to 2033

        9.3.1. Natural

        9.3.2. Synthetic

    9.4. Market Attractiveness Analysis By Form Type

10. Global Market Analysis 2018 to 2022 and Forecast 2023 to 2033, by Grade

    10.1. Introduction / Key Findings

    10.2. Historical Market Size (US$ million) and Volume Analysis by Grade, 2018 to 2022

    10.3. Current and Future Market Size (US$ million) and Volume Analysis and Forecast By Grade, 2023 to 2033

        10.3.1. Ground Mica

        10.3.2. Sheet Mica

        10.3.3. Built-up Mica

    10.4. Market Attractiveness Analysis By Grade

11. Global Market Analysis 2018 to 2022 and Forecast 2023 to 2033, by End-use

    11.1. Introduction / Key Findings

    11.2. Historical Market Size (US$ million) and Volume Analysis by End-use, 2018 to 2022

    11.3. Current and Future Market Size (US$ million) and Volume Analysis and Forecast by End-use, 2023 to 2033

        11.3.1. Paints & Coatings

        11.3.2. Electronics

        11.3.3. Construction

        11.3.4. Cosmetics

        11.3.5. Others

    11.4. Market Attractiveness Analysis By End-use

12. Global Market Analysis 2018 to 2022 and Forecast 2023 to 2033, by Region

    12.1. Introduction

    12.2. Historical Market Size (US$ million) and Volume Analysis by Region, 2018 to 2022

    12.3. Current Market Size (US$ million) and Volume Analysis and Forecast By Region, 2023 to 2033

        12.3.1. North America

        12.3.2. Latin America

        12.3.3. Western Europe

        12.3.4. Eastern Europe

        12.3.5. East Asia

        12.3.6. South Asia Pacific

        12.3.7. Middle East and Africa

    12.4. Market Attractiveness Analysis By Region

13. North America Market Analysis 2018 to 2022 and Forecast 2023 to 2033

    13.1. Introduction

    13.2. Pricing Analysis

    13.3. Historical Market Size (US$ million) and Volume Trend Analysis By Market Taxonomy, 2018 to 2022

    13.4. Market Size (US$ million) and Volume Forecast By Market Taxonomy, 2023 to 2033

        13.4.1. By Country

            13.4.1.1. United States

            13.4.1.2. Canada

            13.4.1.3. Mexico

        13.4.2. By Form Type

        13.4.3. By Grade

        13.4.4. By End-use

    13.5. Market Attractiveness Analysis

        13.5.1. By Country

        13.5.2. By Form Type

        13.5.3. By Grade

        13.5.4. By End-use

    13.6. Key Market Participants - Intensity Mapping

    13.7. Drivers and Restraints - Impact Analysis

14. Latin America Market Analysis 2018 to 2022 and Forecast 2023 to 2033

    14.1. Introduction

    14.2. Pricing Analysis

    14.3. Historical Market Size (US$ million) and Volume Trend Analysis By Market Taxonomy, 2018 to 2022

    14.4. Market Size (US$ million) and Volume Forecast By Market Taxonomy, 2023 to 2033

        14.4.1. By Country

            14.4.1.1. Brazil

            14.4.1.2. Chile

            14.4.1.3. Rest of Latin America

        14.4.2. By Form Type

        14.4.3. By Grade

        14.4.4. By End-use

    14.5. Market Attractiveness Analysis

        14.5.1. By Country

        14.5.2. By Form Type

        14.5.3. By Grade

        14.5.4. By End-use

    14.6. Key Market Participants - Intensity Mapping

    14.7. Drivers and Restraints - Impact Analysis

15. Western Europe Market Analysis 2018 to 2022 and Forecast 2023 to 2033

    15.1. Introduction

    15.2. Pricing Analysis

    15.3. Historical Market Size (US$ million) and Volume Trend Analysis By Market Taxonomy, 2018 to 2022

    15.4. Market Size (US$ million) and Volume Forecast By Market Taxonomy, 2023 to 2033

        15.4.1. By Country

            15.4.1.1. Germany

            15.4.1.2. Italy

            15.4.1.3. France

            15.4.1.4. United Kingdom

            15.4.1.5. Spain

            15.4.1.6. BENELUX

            15.4.1.7. NORDICS

            15.4.1.8. Rest of Western Europe

        15.4.2. By Form Type

        15.4.3. By Grade

        15.4.4. By End-use

    15.5. Market Attractiveness Analysis

        15.5.1. By Country

        15.5.2. By Form Type

        15.5.3. By Grade

        15.5.4. By End-use

    15.6. Key Market Participants - Intensity Mapping

    15.7. Drivers and Restraints - Impact Analysis

16. Eastern Europe Market Analysis 2018 to 2022 and Forecast 2023 to 2033

    16.1. Introduction

    16.2. Pricing Analysis

    16.3. Historical Market Size (US$ million) and Volume Trend Analysis By Market Taxonomy, 2018 to 2022

    16.4. Market Size (US$ million) and Volume Forecast By Market Taxonomy, 2023 to 2033

        16.4.1. By Country

            16.4.1.1. Poland

            16.4.1.2. Hungary

            16.4.1.3. Balkan and Baltics

            16.4.1.4. Russia

            16.4.1.5. Rest of Eastern Europe

        16.4.2. By Form Type

        16.4.3. By Grade

        16.4.4. By End-use

    16.5. Market Attractiveness Analysis

        16.5.1. By Country

        16.5.2. By Form Type

        16.5.3. By Grade

        16.5.4. By End-use

    16.6. Key Market Participants - Intensity Mapping

    16.7. Drivers and Restraints - Impact Analysis

17. South Asia Pacific Market Analysis 2018 to 2022 and Forecast 2023 to 2033

    17.1. Introduction

    17.2. Pricing Analysis

    17.3. Historical Market Size (US$ million) and Volume Trend Analysis By Market Taxonomy, 2018 to 2022

    17.4. Market Size (US$ million) and Volume Forecast By Market Taxonomy, 2023 to 2033

        17.4.1. By Country

            17.4.1.1. India

            17.4.1.2. Association of Southeast Asian Nations

            17.4.1.3. Australia & New Zealand

            17.4.1.4. Rest of South Asia Pacific

        17.4.2. By Form Type

        17.4.3. By Grade

        17.4.4. By End-use

    17.5. Market Attractiveness Analysis

        17.5.1. By Country

        17.5.2. By Form Type

        17.5.3. By Grade

        17.5.4. By End-use

        17.5.5. Key Market Participants - Intensity Mapping

        17.5.6. Drivers and Restraints - Impact Analysis

18. East Asia Market Analysis 2018 to 2022 and Forecast 2023 to 2033

    18.1. Introduction

    18.2. Pricing Analysis

    18.3. Historical Market Size (US$ million) and Volume Trend Analysis By Market Taxonomy, 2018 to 2022

    18.4. Market Size (US$ million) and Volume Forecast By Market Taxonomy, 2023 to 2033

        18.4.1. By Country

            18.4.1.1. China

            18.4.1.2. Japan

            18.4.1.3. South Korea

        18.4.2. By Form Type

        18.4.3. By Grade

        18.4.4. By End-use

    18.5. Market Attractiveness Analysis

        18.5.1. By Country

        18.5.2. By Form Type

        18.5.3. By Grade

        18.5.4. By End-use

    18.6. Key Market Participants - Intensity Mapping

    18.7. Drivers and Restraints - Impact Analysis

19. Middle East and Africa Market Analysis 2018 to 2022 and Forecast 2023 to 2033

    19.1. Introduction

    19.2. Pricing Analysis

    19.3. Historical Market Size (US$ million) and Volume Trend Analysis By Market Taxonomy, 2018 to 2022

    19.4. Market Size (US$ million) and Volume Forecast By Market Taxonomy, 2023 to 2033

        19.4.1. By Country

            19.4.1.1. Kingdom of Saudi Arabia

            19.4.1.2. Other GCC

            19.4.1.3. Türkiye

            19.4.1.4. Other African Union

            19.4.1.5. South Africa

            19.4.1.6. Rest of Middle East and Africa

        19.4.2. By Form Type

        19.4.3. By Grade

        19.4.4. By End-use

    19.5. Market Attractiveness Analysis

        19.5.1. By Country

        19.5.2. By Form Type

        19.5.3. By Grade

        19.5.4. By End-use

    19.6. Key Market Participants - Intensity Mapping

    19.7. Drivers and Restraints - Impact Analysis

20. Country-wise Market Analysis

    20.1. Introduction

    20.2. United States Market Analysis

        20.2.1. By Form Type

        20.2.2. By Grade

        20.2.3. By End-use

    20.3. Canada Market Analysis

        20.3.1. By Form Type

        20.3.2. By Grade

        20.3.3. By End-use

    20.4. Mexico Market Analysis

        20.4.1. By Form Type

        20.4.2. By Grade

        20.4.3. By End-use

    20.5. Brazil Market Analysis

        20.5.1. By Form Type

        20.5.2. By Grade

        20.5.3. By End-use

    20.6. Germany Market Analysis

        20.6.1. By Form Type

        20.6.2. By Grade

        20.6.3. By End-use

    20.7. Italy Market Analysis

        20.7.1. By Form Type

        20.7.2. By Grade

        20.7.3. By End-use

    20.8. France Market Analysis

        20.8.1. By Form Type

        20.8.2. By Grade

        20.8.3. By End-use

    20.9. United Kingdom Market Analysis

        20.9.1. By Form Type

        20.9.2. By Grade

        20.9.3. By End-use

    20.10. Spain Market Analysis

        20.10.1. By Form Type

        20.10.2. By Grade

        20.10.3. By End-use

    20.11. NORDICS Market Analysis

        20.11.1. By Form Type

        20.11.2. By Grade

        20.11.3. By End-use

    20.12. Russia Market Analysis

        20.12.1. By Form Type

        20.12.2. By Grade

        20.12.3. By End-use

    20.13. Poland Market Analysis

        20.13.1. By Form Type

        20.13.2. By Grade

        20.13.3. By End-use

    20.14. Hungary Market Analysis

        20.14.1. By Form Type

        20.14.2. By Grade

        20.14.3. By End-use

    20.15. Balkan and Baltics Market Analysis

        20.15.1. By Form Type

        20.15.2. By Grade

        20.15.3. By End-use

    20.16. China Market Analysis

        20.16.1. By Form Type

        20.16.2. By Grade

        20.16.3. By End-use

    20.17. Japan Market Analysis

        20.17.1. By Form Type

        20.17.2. By Grade

        20.17.3. By End-use

    20.18. S. Korea Market Analysis

        20.18.1. By Form Type

        20.18.2. By Grade

        20.18.3. By End-use

    20.19. India Market Analysis

        20.19.1. By Form Type

        20.19.2. By Grade

        20.19.3. By End-use

    20.20. Association of Southeast Asian Nations Market Analysis

        20.20.1. By Form Type

        20.20.2. By Grade

        20.20.3. By End-use

    20.21. Australia and New Zealand Market Analysis

        20.21.1. By Form Type

        20.21.2. By Grade

        20.21.3. By End-use

    20.22. Kingdom of Saudi Arabia Market Analysis

        20.22.1. By Form Type

        20.22.2. By Grade

        20.22.3. By End-use

    20.23. Other GCC Market Analysis

        20.23.1. By Form Type

        20.23.2. By Grade

        20.23.3. By End-use

    20.24. Other African Union Market Analysis

        20.24.1. By Form Type

        20.24.2. By Grade

        20.24.3. By End-use

    20.25. Türkiye Market Analysis

        20.25.1. By Form Type

        20.25.2. By Grade

        20.25.3. By End-use

    20.26. South Africa Market Analysis

        20.26.1. By Form Type

        20.26.2. By Grade

        20.26.3. By End-use

21. Market Structure Analysis

    21.1. Market Analysis by Tier of Companies

    21.2. Market Positioning

    21.3. Market Share Analysis of Top Players

    21.4. Production Capacity of Top Players

    21.5. Market Presence Analysis

22. Competition Analysis

    22.1. Competition Dashboard

    22.2. Competition Deep Dive

        22.2.1. Merck KGaA

            22.2.1.1. Overview

            22.2.1.2. Product Portfolio

            22.2.1.3. Profitability by Market Segments (Form Type/Form/End-use/Region)

            22.2.1.4. Sales Footprint

            22.2.1.5. Strategy Overview

        22.2.2. Imerys S. A.

        22.2.3. BASF SE

        22.2.4. Von Roll Group

        22.2.5. Asheville Company

        22.2.6. Elmelin Ltd

        22.2.7. Daruka Minerals

        22.2.8. The Premier Company (PMC)

        22.2.9. Shanghai Green Tech Co., Ltd.

        22.2.10. Micafab India Private Limited

        22.2.11. Spruce Pine Co.

        22.2.12. Manufacturing Co. Pvt. Ltd

        22.2.13. Ruby Co. Ltd.

        22.2.14. Vasundhara International

        22.2.15. Mineracao Vale do Juquia

        22.2.16. Sri Ramamaruti Vermiculite Mines

23. Assumptions and Acronyms Used

24. Research Methodology

List of Tables

Table 1: Global Market Size Volume (tons) Analysis and Forecast by Form Type, 2018 to 2033

Table 2: Global Market Size (US$ million) Analysis and Forecast by Form Type, 2018 to 2033

Table 3: Global Market Size Volume (tons) Analysis and Forecast by Grade, 2018 to 2033

Table 4: Global Market Size (US$ million) Analysis and Forecast by Grade, 2018 to 2033

Table 5: Global Market Size Volume (tons) Analysis and Forecast by End-use, 2018 to 2033

Table 6: Global Market Size (US$ million) Analysis and Forecast by End-use, 2018 to 2033

Table 7: Global Market Size Volume (tons) Analysis and Forecast by Region, 2018 to 2033

Table 8: Global Market Size (US$ million) Analysis and Forecast by Region, 2018 to 2033

Table 9: North America Market Size (US$ million) and Volume (tons) Analysis and Forecast by Country, 2018 to 2033

Table 10: North America Market Size Volume (tons) Analysis and Forecast by Form Type, 2018 to 2033

Table 11: North America Market Size (US$ million) Analysis and Forecast by Form Type, 2018 to 2033

Table 12: North America Market Size Volume (tons) Analysis and Forecast by Grade, 2018 to 2033

Table 13: North America Market Size (US$ million) Analysis and Forecast by Grade, 2018 to 2033

Table 14: North America Market Size Volume (tons) Analysis and Forecast by End-use, 2018 to 2033

Table 15: North America Market Size (US$ million) Analysis and Forecast by End-use, 2018 to 2033

Table 16: Latin America Market Size (US$ million) and Volume (tons) Analysis and Forecast by Country, 2018 to 2033

Table 17: Latin America Market Size Volume (tons) Analysis and Forecast by Form Type, 2018 to 2033

Table 18: Latin America Market Size (US$ million) Analysis and Forecast by Form Type, 2018 to 2033

Table 19: Latin America Market Size Volume (tons) Analysis and Forecast by Grade, 2018 to 2033

Table 20: Latin America Market Size (US$ million) Analysis and Forecast by Grade, 2018 to 2033

Table 21: Latin America Market Size Volume (tons) Analysis and Forecast by End-use, 2018 to 2033

Table 22: Latin America Market Size (US$ million) Analysis and Forecast by End-use, 2018 to 2033

Table 23: Western Europe Market Size (US$ million) and Volume (tons) Analysis and Forecast by Country, 2018 to 2033

Table 24: Western Europe Market Size Volume (tons) Analysis and Forecast by Form Type, 2018 to 2033

Table 25: Western Europe Market Size (US$ million) Analysis and Forecast by Form Type, 2018 to 2033

Table 26: Western Europe Market Size Volume (tons) Analysis and Forecast by Grade, 2018 to 2033

Table 27: Western Europe Market Size (US$ million) Analysis and Forecast by Grade, 2018 to 2033

Table 28: Western Europe Market Size Volume (tons) Analysis and Forecast by End-use, 2018 to 2033

Table 29: Western Europe Market Size (US$ million) Analysis and Forecast by End-use, 2018 to 2033

Table 30: Eastern Europe Market Size (US$ million) and Volume (tons) Analysis and Forecast by Country, 2018 to 2033

Table 31: Eastern Europe Market Size Volume (tons) Analysis and Forecast by Form Type, 2018 to 2033

Table 32: Eastern Europe Market Size (US$ million) Analysis and Forecast by Form Type, 2018 to 2033

Table 33: Eastern Europe Market Size Volume (tons) Analysis and Forecast by Grade, 2018 to 2033

Table 34: Eastern Europe Market Size (US$ million) Analysis and Forecast by Grade, 2018 to 2033

Table 35: Eastern Europe Market Size Volume (tons) Analysis and Forecast by End-use, 2018 to 2033

Table 36: Eastern Europe Market Size (US$ million) Analysis and Forecast by End-use, 2018 to 2033

Table 37: East Asia Market Size (US$ million) and Volume (tons) Analysis and Forecast by Country, 2018 to 2033

Table 38: East Asia Market Size Volume (tons) Analysis and Forecast by Form Type, 2018 to 2033

Table 39: East Asia Market Size (US$ million) Analysis and Forecast by Form Type, 2018 to 2033

Table 40: East Asia Market Size Volume (tons) Analysis and Forecast by Grade, 2018 to 2033

Table 41: East Asia Market Size (US$ million) Analysis and Forecast by Grade, 2018 to 2033

Table 42: East Asia Market Size Volume (tons) Analysis and Forecast by End-use, 2018 to 2033

Table 43: East Asia Market Size (US$ million) Analysis and Forecast by End-use, 2018 to 2033

Table 44: South Asia & Pacific Market Size (US$ million) and Volume (tons) Analysis and Forecast by Country, 2018 to 2033

Table 45: South Asia Pacific Market Size Volume (tons) Analysis and Forecast by Form Type, 2018 to 2033

Table 46: South Asia Pacific Market Size (US$ million) Analysis and Forecast by Form Type, 2018 to 2033

Table 47: South Asia Pacific Market Size Volume (tons) Analysis and Forecast by Grade, 2018 to 2033

Table 48: South Asia Pacific Market Size (US$ million) Analysis and Forecast by Grade, 2018 to 2033

Table 49: South Asia Pacific Market Size Volume (tons) Analysis and Forecast by End-use, 2018 to 2033

Table 50: South Asia Pacific Market Size (US$ million) Analysis and Forecast by End-use, 2018 to 2033

Table 51: Middle East & Africa Market Size (US$ million) and Volume (tons) Analysis and Forecast by Country, 2018 to 2033

Table 52: Middle East & Africa Market Size Volume (tons) Analysis and Forecast by Form Type, 2018 to 2033

Table 53: Middle East & Africa Market Size (US$ million) Analysis and Forecast by Form Type, 2018 to 2033

Table 54: Middle East & Africa Market Size Volume (tons) Analysis and Forecast by Grade, 2018 to 2033

Table 55: Middle East & Africa Market Size (US$ million) Analysis and Forecast by Grade, 2018 to 2033

Table 56: Middle East & Africa Market Size Volume (tons) Analysis and Forecast by End-use, 2018 to 2033

Table 57: Middle East & Africa Market Size (US$ million) Analysis and Forecast by End-use, 2018 to 2033

List of Charts

Figure 01: Global Market Historical Demand, 2018 to 2022

Figure 02: Global Market Demand Forecast, 2023 to 2033

Figure 03: Global Market Historical Value (US$ million), 2018 to 2022

Figure 04: Global Market Value (US$ million) Forecast, 2023 to 2033

Figure 05: Global Market Absolute $ Opportunity, 2023 to 2033

Figure 6: Global Market Share and BPS Analysis by Form Type, 2023 to 2033

Figure 7: Global Market Y-o-Y Growth Projections by Form Type, 2023 to 2033

Figure 8: Global Market Attractiveness Analysis by Form Type, 2023 to 2033

Figure 9: Global Market Absolute $ Opportunity by Natural Segment, 2018 to 2033

Figure 10: Global Market Absolute $ Opportunity by Synthetic Segment, 2018 to 2033

Figure 12: Global Market Share and BPS Analysis by Grade, 2023 to 2033

Figure 13: Global Market Y-o-Y Growth Projections by Grade, 2023 to 2033

Figure 14: Global Market Attractiveness Analysis by Grade, 2023 to 2033

Figure 15: Global Market Absolute $ Opportunity by Ground Mica, 2018 to 2033

Figure 16: Global Market Absolute $ Opportunity by Sheet Mica, 2018 to 2033

Figure 16: Global Market Absolute $ Opportunity by Built-up Mica, 2018 to 2033

Figure 17: Global Market Share and BPS Analysis by End-use, 2023 to 2033

Figure 18: Global Market Y-o-Y Growth Projections by End-use, 2023 to 2033

Figure 19: Global Market Attractiveness Analysis by End-use, 2023 to 2033

Figure 20: Global Market Absolute $ Opportunity by Paints & Coatings Segment, 2018 to 2033

Figure 21: Global Market Absolute $ Opportunity by Electronics Segment, 2018 to 2033

Figure 22: Global Market Absolute $ Opportunity by Construction Segment, 2018 to 2033

Figure 23: Global Market Absolute $ Opportunity by Cosmetics Segment, 2018 to 2033

Figure 24: Global Market Absolute $ Opportunity by Others Segment, 2018 to 2033

Figure 25: Global Market Share and BPS Analysis by Region, 2023 to 2033

Figure 26: Global Market Y-o-Y Growth Projections by Region, 2023 to 2033

Figure 27: Global Market Attractiveness Analysis by Region, 2023 to 2033

Figure 28: Global Market Absolute $ Opportunity by North America Segment, 2018 to 2033

Figure 29: Global Market Absolute $ Opportunity by Latin America Segment, 2018 to 2033

Figure 30: Global Market Absolute $ Opportunity by Western Europe Segment, 2018 to 2033

Figure 31: Global Market Absolute $ Opportunity by Eastern Europe Segment, 2018 to 2033

Figure 32: Global Market Absolute $ Opportunity by East Asia Segment, 2018 to 2033

Figure 33: Global Market Absolute $ Opportunity by South Asia Pacific Segment, 2018 to 2033

Figure 34: Global Market Absolute $ Opportunity by Middle East and Africa Segment, 2018 to 2033

Figure 35: North America Market Share and BPS Analysis by Form Type, 2023 to 2033

Figure 36: North America Market Y-o-Y Growth Projections by Form Type, 2023 to 2033

Figure 37: North America Market Attractiveness Analysis by Form Type, 2023 to 2033

Figure 38: North America Market Share and BPS Analysis by Form Type, 2023 to 2033

Figure 39: North America Market Y-o-Y Growth Projections by Form Type, 2023 to 2033

Figure 40: North America Market Attractiveness Analysis by Form Type, 2023 to 2033

Figure 41: North America Market Share and BPS Analysis by Grade, 2023 to 2033

Figure 42: North America Market Y-o-Y Growth Projections by Grade, 2023 to 2033

Figure 43: North America Market Attractiveness Analysis by Grade, 2023 to 2033

Figure 44: North America Market Share and BPS Analysis by Grade, 2023 to 2033

Figure 45: North America Market Y-o-Y Growth Projections by End-use, 2023 to 2033

Figure 46: North America Market Attractiveness Analysis by End-use, 2023 to 2033

Figure 47: Latin America Market Share and BPS Analysis by Country, 2023 to 2033

Figure 48: Latin America Market Y-o-Y Growth Projections by Country, 2023 to 2033

Figure 49: Latin America Market Attractiveness Analysis by Country, 2023 to 2033

Figure 50: Latin America Market Share and BPS Analysis by Form Type, 2023 to 2033

Figure 51: Latin America Market Y-o-Y Growth Projections by Form Type, 2023 to 2033

Figure 52: Latin America Market Attractiveness Analysis by Form Type, 2023 to 2033

Figure 53: Latin America Market Share and BPS Analysis by Grade, 2023 to 2033

Figure 54: Latin America Market Y-o-Y Growth Projections by Grade, 2023 to 2033

Figure 55: Latin America Market Attractiveness Analysis by Grade, 2023 to 2033

Figure 56: Latin America Market Share and BPS Analysis by End-use, 2023 to 2033

Figure 57: Latin America Market Y-o-Y Growth Projections by End-use, 2023 to 2033

Figure 58: Latin America Market Attractiveness Analysis by End-use, 2023 to 2033

Figure 59: Western Europe Market Share and BPS Analysis by Country, 2023 to 2033

Figure 60: Western Europe Market Y-o-Y Growth Projections by Country, 2023 to 2033

Figure 61: Western Europe Market Attractiveness Analysis by Country, 2023 to 2033

Figure 62: Western Europe Market Share and BPS Analysis by Form Type, 2023 to 2033

Figure 63: Western Europe Market Y-o-Y Growth Projections by Form Type, 2023 to 2033

Figure 64: Western Europe Market Attractiveness Analysis by Form Type, 2023 to 2033

Figure 65: Western Europe Market Share and BPS Analysis by Grade, 2023 to 2033

Figure 66: Western Europe Market Y-o-Y Growth Projections by Grade, 2023 to 2033

Figure 67: Western Europe Market Attractiveness Analysis by Grade, 2023 to 2033

Figure 68: Western Europe Market Share and BPS Analysis by End-use, 2023 to 2033

Figure 69: Western Europe Market Y-o-Y Growth Projections by End-use, 2023 to 2033

Figure 70: Western Europe Market Attractiveness Analysis by End-use, 2023 to 2033

Figure 71: Eastern Europe Market Share and BPS Analysis by Country, 2023 to 2033

Figure 72: Eastern Europe Market Y-o-Y Growth Projections by Country, 2023 to 2033

Figure 73: Eastern Europe Market Attractiveness Analysis by Country, 2023 to 2033

Figure 74: Eastern Europe Market Share and BPS Analysis by Form Type, 2023 to 2033

Figure 75: Eastern Europe Market Y-o-Y Growth Projections by Form Type, 2023 to 2033

Figure 76: Eastern Europe Market Attractiveness Analysis by Form Type, 2023 to 2033

Figure 77: Eastern Europe Market Share and BPS Analysis by Form Grade, 2023 to 2033

Figure 78: Eastern Europe Market Y-o-Y Growth Projections by Form, 2023 to 2033

Figure 79: Eastern Europe Market Attractiveness Analysis by Grade, 2023 to 2033

Figure 80: Eastern Europe Market Share and BPS Analysis by End-use, 2023 to 2033

Figure 81: Eastern Europe Market Y-o-Y Growth Projections by End-use, 2023 to 2033

Figure 81: Eastern Europe Market Attractiveness Analysis by End-use, 2023 to 2033

Figure 82: East Asia Market Share and BPS Analysis by Country, 2023 to 2033

Figure 83: East Asia Market Y-o-Y Growth Projections by Country, 2023 to 2033

Figure 84: East Asia Market Attractiveness Analysis by Country, 2023 to 2033

Figure 85: East Asia Market Share and BPS Analysis by Form type, 2023 to 2033

Figure 86: East Asia Market Y-o-Y Growth Projections by Form type, 2023 to 2033

Figure 87: East Asia Market Attractiveness Analysis by Form type, 2023 to 2033

Figure 88: East Asia Market Share and BPS Analysis by Grade, 2023 to 2033

Figure 89: East Asia Market Y-o-Y Growth Projections by Grade, 2023 to 2033

Figure 90: East Asia Market Attractiveness Analysis by Grade, 2023 to 2033

Figure 91: East Asia Market Share and BPS Analysis by End-use, 2023 to 2033

Figure 92: East Asia Market Y-o-Y Growth Projections by End-use, 2023 to 2033

Figure 93: East Asia Market Attractiveness Analysis by End-use, 2023 to 2033

Figure 94: South Asia Pacific Market Share and BPS Analysis by Country, 2023 to 2033

Figure 95: South Asia Pacific Market Y-o-Y Growth Projections by Country, 2023 to 2033

Figure 96: South Asia Pacific Market Attractiveness Analysis by Country, 2023 to 2033

Figure 97: South Asia Pacific Market Share and BPS Analysis by Form type, 2023 to 2033

Figure 98: South Asia Pacific Market Y-o-Y Growth Projections by Form type, 2023 to 2033

Figure 99: South Asia Pacific Market Attractiveness Analysis by Form type, 2023 to 2033

Figure 100: South Asia Pacific Market Share and BPS Analysis by Grade, 2023 to 2033

Figure 101: South Asia Pacific Market Y-o-Y Growth Projections by Grade, 2023 to 2033

Figure 102: South Asia Pacific Market Attractiveness Analysis by Grade, 2023 to 2033

Figure 103: South Asia Pacific Market Share and BPS Analysis by End-use, 2023 to 2033

Figure 104: South Asia Pacific Market Y-o-Y Growth Projections by End-use, 2023 to 2033

Figure 105: South Asia Pacific Market Attractiveness Analysis by End-use, 2023 to 2033

Figure 106: Middle East & Africa Market Share and BPS Analysis by Country, 2023 to 2033

Figure 107: Middle East & Africa Market Y-o-Y Growth Projections by Country, 2023 to 2033

Figure 108: Middle East & Africa Market Attractiveness Analysis by Country, 2023 to 2033

Figure 109: Middle East & Africa Market Share and BPS Analysis by Form type, 2023 to 2033

Figure 110: Middle East & Africa Market Y-o-Y Growth Projections by Form type, 2023 to 2033

Figure 111: Middle East & Africa Market Attractiveness Analysis by Form type, 2023 to 2033

Figure 112: Middle East & Africa Market Share and BPS Analysis by Grade, 2023 to 2033

Figure 113: Middle East & Africa Market Y-o-Y Growth Projections by Grade, 2023 to 2033

Figure 114: Middle East & Africa Market Attractiveness Analysis by Grade, 2023 to 2033

Figure 115: Middle East & Africa Market Share and BPS Analysis by End-use, 2023 to 2033

Figure 116: Middle East & Africa Market Y-o-Y Growth Projections by End-use, 2023 to 2033

Figure 117: Middle East & Africa Market Attractiveness Analysis by End-use, 2023 to 2033

Recommendations

Chemicals & Materials

Asia Pacific Waterproofing Chemicals Market

Published : July 2023

Chemicals & Materials

India Construction Chemicals Market

Published : January 2023

Chemicals & Materials

ASEAN Cosmetic Chemicals Market

Published : September 2022

Explore Chemicals & Materials Insights

View Reports