Reports

- Global Locations -

Headquarters

Future Market Insights, Inc.

Christiana Corporate, 200
Continental Drive, Suite 401,
Newark, Delaware - 19713,
United States

T: +1-845-579-5705

Americas

Future Market Insights, Inc.

616 Corporate Way, Suite 2-9018,
Valley Cottage, NY 10989, United States

T: +1-347-918-3531

MEA

Future Market Insights

1602-6 Jumeirah Bay X2 Tower, Plot No: JLT-PH2-X2A,
Jumeirah Lakes Towers, Dubai,
United Arab Emirates

Europe

Future Market Insights

3rd Floor, 207 Regent Street,
W1B 3HH London
United Kingdom

T: + 44 (0) 20 8123 9659
D: +44 (0) 20 3287 4268

Asia Pacific

Future Market Insights

IndiaLand Global Tech Park, Unit UG-1, Behind Grand HighStreet, Phase 1, Hinjawadi, MH, Pune – 411057, India

Coffee Filter Paper Market Outlook (2023 to 2033)

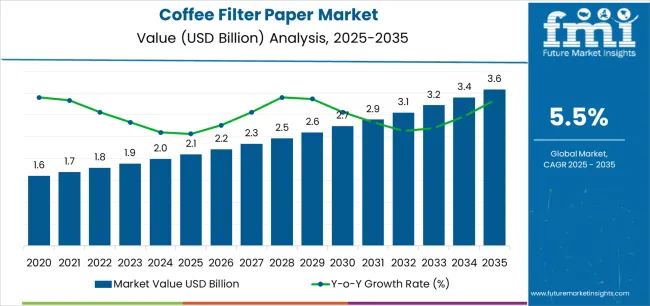
The global coffee filter paper market is bound to grow on a reverberating note between 2023 and 2033, reaching US$ 1,006.0 million by the year 2033, at a CAGR of 5.3%. The global coffee filter paper industry is valued at US$ 600.2 million in 2023.

Rising demand for coffee as a part of the routine has created a significant demand for coffee filter paper in the last couple of years. Coffee filter paper manufacturers are enjoying consistent demand for coffee filter papers. It is due to the rising consumption of coffee is not just seen in the matured markets of Europe and North America, but in significantly growing and developing markets in South and East Asia. The top factors influencing the market growth include:

  • Urbanization, rising disposable income, and the sharp increase in coffee consumption around the world are some of the key factors influencing market growth over the projection period.
  • One of the crucial factors that drive demand is the high air permeability of coffee filter paper, which gives the coffee a rich aroma and flavor.
  • Coffee filter paper is highly recyclable, which is expected to create a favorable picture for market expansion.
  • Regardless of the size of the coffee grind, the incredible wet strength of coffee filter paper assures stability under high temperatures and efficiency. These elements are anticipated to propel market expansion.
Attributes Details
Coffee Filter Market Size (2023) US$ 600.2 million
Projected Market Value (2033) US$ 1,006.0 million
Coffee Filter Market Size (2018) US$ 480.1 million
Coffee Filter Paper Market CAGR (2018 to 2022) 4.4%
Coffee Filter Paper Market CAGR (2023 to 2033) 5.3%
Collective Value Share: 3 Countries (2023E) 41%

Don't pay for what you don't need

Customize your report by selecting specific countries or regions and save 30%!

According to FMI’s analysis, Coffee Filter Paper Sales to Register a 5.3% CAGR Between 2023 and 2033

Coffee Filter Paper Demand Analysis (2018 to 2022) Vs. Market Outlook (2023 to 2033)

In the last couple of years, the consumption of coffee at the global level has witnessed a significant spike. A few prominent regions such as Europe and North America are leading the chart among the other regions.

A massive range of customers are using a variety of coffee filter papers for coffee making, which is amplifying coffee filter paper sales to a significant extent.

Rising investment in product innovation along with product maximization are among a few factors that bolster the coffee filter paper market growth. Additional key benefits of coffee filter paper such as high compatibility, biodegradability and recyclable outlook, and end-user-friendly usage attract a substantial portion of customers in the market.

The coffee filter paper demand experiences considerable boosts on the back of varying lifestyles coupled with changing drinking patterns.

Comparative View of the Adjacent Coffee Filter Paper Market

Coffee Filter Paper Industry:

Attributes Coffee Filter Paper Industry
CAGR (From 2023 to 2033) 5.3%
Market Value (2023) US$ 600.2 million
Growth Factor Specialty coffee's rising popularity drives the market.
Opportunity The expanding coffee culture around the world has created profitable prospects for makers.
Key Trends Growing consumer demand for environment-friendly and biodegradable coffee filter papers fuels market expansion.

Coffee Capsule Market:

Attributes Coffee Capsule Market
CAGR (From 2023 to 2033) 7.9%
Market Value (2023) US$13.3 billion
Growth Factor The increasing need for quick and practical coffee solutions.
Opportunity Growth is fueled by rising consumer demand and practical brewing solutions.
Key Trends The market is expanding and innovating steadily because of the rising demand for high-end coffee experiences.

Specialty Papers Market:

Attributes Specialty Papers Market
CAGR (From 2023 to 2033) 5.4%
Market Value (2023) US$ 10.95 billion
Growth Factor Demand expansion and increased knowledge of specialized products.
Opportunity The importance is increased by the expanding end-use applications and the adoption of a new lifestyle.
Key Trends In the coming years, it is anticipated that demand might rise due to increasing interest in environmental responsibility.
Ismail Sutaria
Ismail Sutaria

Principal Consultant

Talk to Analyst

Find your sweet spots for generating winning opportunities in this market.

Organized Retail to Dominate?

Organized Retail Sector to Penetrate the Sales of Coffee Filter Paper

A significant increase in the numerous modern retail formats such as supermarkets, hypermarkets, convenience stores, and specialty stores was witnessed lately. Changing lifestyles coupled with increasing per-capita disposable incomes of consumers have boosted the growth of the organized retail sector, especially in Asia and Middle East Asia regions.

Coffee filter paper is available for end-use customers through a variety of retail outlets such as hypermarkets, supermarkets, small retail stores, and others. This ease of availability through retail outlets ultimately uplifts coffee filter paper sales and raises its popularity among the end users. The future growth outlook for the global retail sector is progressive and induces a positive impact on coffee filter paper sales.

Low Calorie Drinks to Rule?

Growing Preference for Low Calorie Drinks to Bolster the Market Growth

Changing lifestyles and increasing preferences of consumers toward health-conscious beverages are the vibrant factors that propel the demand for coffee drinks. The demand for such health-conscious drinks is on the significant surge on the back of their several benefits such as appetite control, improved metabolism, etc.

Coffee filter paper is predominantly used for coffee preparation and filtration. Drinking coffee and low calorie coffee is one of the key drink categories and is projected to remain the same in the foreseeable future.

Get the data you need at a Fraction of the cost

Personalize your report by choosing insights you need
and save 40%!

What is with Alternating Filtering Media?

Alternating Filtering Media to Restrain the Coffee Filter Paper Market

The coffee filter paper manufacturers operating in the global food and beverage industry are ready to switch to advancement in filtering solutions. Though a significant portion of customers are using coffee filter paper for making and brewing coffee, there are alternative filtering solutions available in the market.

Filtering media such as permanent coffee filters made up of stainless-steel mesh is significantly used for commercial, institutional, and household use. Permanent coffee filters are suitable for all coffee machines and could be easily cleaned under running water or in the dishwasher.

Permanent coffee filters offer several benefits such as resistance against heat, being BPA-free, and being easy to handle. The availability of such alternative filtering solutions is considerably impacting coffee filter paper sales. Development and adoption of such alternative products are estimated to dent the coffee filter paper market growth in the upcoming period.

What is with Eco-Friendly Filtering Media?

Shifting Inclination toward Eco-friendly Filtering Media to Accelerate the Market

The rising demand for eco-friendly and highly sustainable filtering solutions has led to an increase in the demand for paper-based filter solutions. Leading as well as small-scale industry players operating in the global beverage industry are promoting paper-based packaging and filtering solutions owing to their highly sustainable and recyclable outlook.

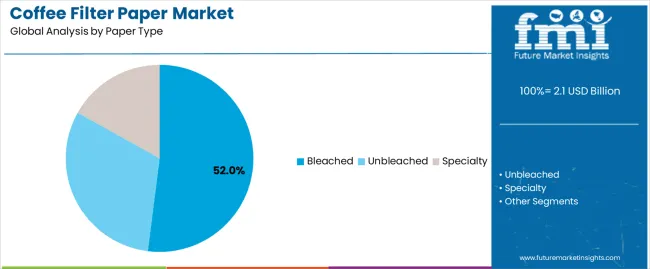
Coffee filter paper is made up of bleached and unbleached paper, is FSC-certified, and is highly biodegradable and recyclable in nature. These paper-based coffer filters are complying with food and beverage quality and safety standards.

Coffee filter paper is made without any glue or binding agent and is also convenient for everyone to use. Moreover, initiatives taken by coffee filter paper manufacturers operating in the coffee filter paper industry may encourage consumers to use sustainable filtering products. Rising demand and preference for such easy-to-use yet sustainable filtering solutions are projected to reinforce the global coffee filter paper market growth.

Country-wise Insights

2023 Value Share in Global Market:

Country Value
North America 20.6%
Europe 38%

2022 Value Share in Global Market:

Country Value
The United States 17.3%
Germany 6.1%
Japan 3.7%
Australia 2.7%

Value CAGR (latest period):

Country Value
China 6%
India 7.1%
The United Kingdom 3.4%

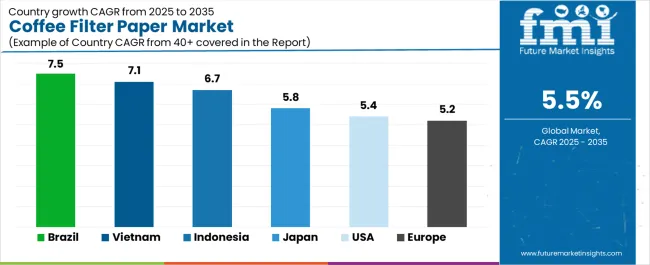
Brewing Success: Exploring India’s Landscape of Coffee Filter Paper Industry

India has largely been a tea-drinking nation for several decades. Coffee has become a popular choice and drink since the turn of the twentieth century. The rising preference for coffee drinks among the millennials in India has created a significant demand for filtering media including coffee filter paper.

  • As per the National Dairy Development Board, India is the leading milk producer and a sixth large producer of coffee.

The demand for coffee drinks is not only persistent in urban areas but also seen in the ruler parts of the country. The consumption rate of coffee has witnessed a significant spike in retail food service stores in India. All these factors are projected to offer revenue-generating opportunities for coffee filter paper manufacturers during the foreseeable period.

A Promising Outlook for the United States Coffee Filter Paper Business

As per FMI’s analysis, the United States is projected to generate substantial demand for coffee filter paper during the foreseeable future. This rising demand in the United States coffee filter paper market is mainly driven by the daily drinking habit of coffee drink among the youth as well as adults.

The rising consumption of coffee drinks in commercial as well as institutional places in the United States is another prime factor that boosts the coffee filter paper market. As per the International Coffee Organization, the United States has imported 1620 thousand tons of coffee on the back of massive demand.

Analyzing Europe Outlook for Coffee Filter Paper Industry

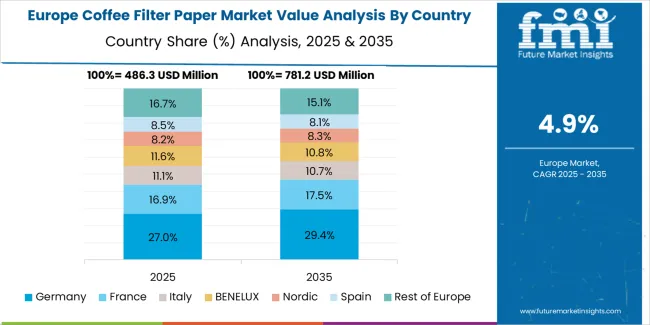
As per the International Coffee Organization, the European Union countries including Germany consumed 3,260 thousand tons of coffee in 2020, which was far from any other countries across the globe. This factor is estimated to create a substantial demand in Germany’s coffee filter paper market.

The significant presence of coffee filter paper manufacturers across Germany is propelling the coffee filter paper demand to a certain extent.

Steaming Up: A Promising Outlook for Canada's Coffee Filter Paper Business

Coffee is Canada’s most consumed beverage among adults. As per the Coffee Association of Canada, the country is witnessing significant growth regarding imports of coffee among the leading global markets with over 25 nations exporting coffee to Canada.

In Canada, the total sales of coffee in 2019 were US$ 4.8 billion. This sky-touching demand for coffee in Canada is also driving the massive demand for beverage filtering solutions including coffee filter paper.

  • As per FMI’s analysis, in 2020, the total coffee consumption per person per year in Canada was ~15 lbs, which is more than the countries in America and Asia.

As the demand for a coffee drinks in Canada is progressively rising, the manufacturers operating in the global coffee filter paper market can target the country to penetrate the market and reinforce the market position.

Exploring the Flourishing Brazil Coffee Filter Paper Industry

The coffee drink is an integral part of Brazil’s culture. As per FMI’s analysis, Brazil is one of the largest consumers of coffee and is also a leading producer of coffee beans. The total consumption of coffee per person per year in Brazil is much more than the other countries in Europe and America.

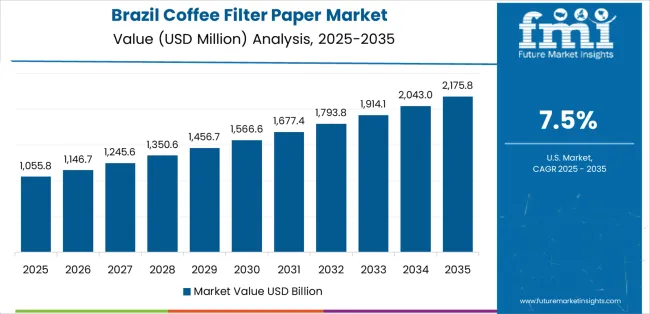
The consumption rate of coffee in workplaces and commercial places in Brazil is witnessing an upward graph, which catalyzes the coffee filter paper market in LATAM. Based on these factors, manufacturers, especially those who operate in North and Latin America coffee filter paper market can focus on Brazil as revenue generating hub during the coming years.

Category-wise Insights

Segment Product Type
Segment Name Cone Filter
Segment Share 28.7%

Product Type Spotlight

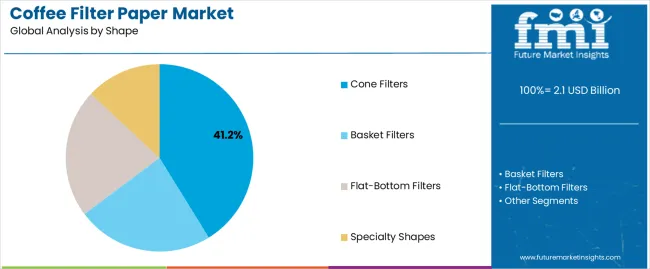
As per the FMI’s analysis by product type, basket and cone filters among others are the most preferred choices among the end users. Basket and cone filters are comparatively easy to use and offer convenient filtration of coffee. Consistent demand for these target segments is mainly driven due to its precise sizing and affordable pricing.

Unleashing the Power of Thickness Segment

Leading as well as small-scale coffee filter paper manufacturers across the continents are designing and manufacturing coffee filter paper that is best suited for a wide range of coffee types. 20 to 40 GSM coffee filter papers are conducive for both ground and powder forms of coffee.

The filtering characteristics of 20 to 40 GSM coffee filter paper fulfill the precise requirement of coffee filtration. Owing to these factors, the target segment is estimated to witness an astonishing demand during the upcoming period and is projected to expand by 1.7x times its value.

Powering the Future: End-use Outlook

Segment End Use
Segment Name Household Use
Segment Share 43.4%

As per FMI’s Analysis, the institutional segment is going to be the attractive end-use segment in the foreseeable future. The increasing frequency of consumption of coffee at institutional places such as corporate offices, colleges, schools, and others is one of the crucial factors for the astonishing growth of the target segment. The target segment is estimated to offer a total incremental opportunity of US$ 107 million during the forecast period.

Unveiling the Battleground: Mapping the Competitive Landscape

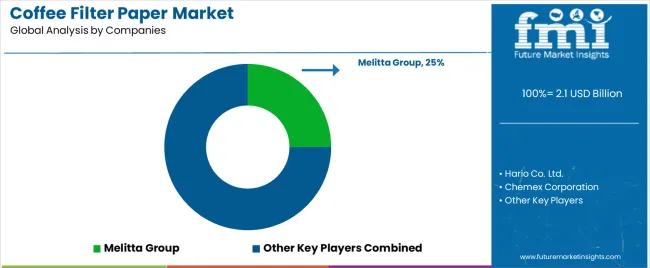
Leading coffee filter paper manufacturers across the continents are continuously emphasizing product innovation and putting customer convenience in the epicenter. This can be exemplified by Melitta’s coffee filter paper, which comes up with measure markings on filter paper, each equivalent to two tablespoons for easy, consistent filling. Similarly, BV Filtropa, another Europe-based coffee filter paper manufacturer, offers different sizes of coffee filter paper, which is compatible with all types of domestic coffee drip machines which ultimately facilitates the coffee brewing process.

Packaging manufacturers are trying to match up with green trends. These manufacturers are designing and manufacturing coffee filter paper with a less binding agent.

Key Players Operating in the Coffee Filter Paper Market

  • Ahlstrom-Munksjö Oyj
  • Riensch & Held GmbH & Co.KG
  • BV Filtropa
  • TERRANOVA PAPERS SA
  • Neu Kaliss Spezialpapier GmbH
  • Melitta
  • Glatfelter Corporation
  • Purico Group Limited
  • KONOS GmbH
  • Animo B.V
  • Rockline Industries
  • Thomas & Green
  • Twin Rivers Paper Company

Latest Advancement

  • Riensch & Held GmbH & Co.KG’s biodegradable coffee filter paper, which is designed for ground coffee and made without any glue or any other type of binding agent, is generating substantial revenue by offering a perfect blend of aesthetic coffee filter papers with exceptional filtering characteristics.

Key Segments

By Product Type:

  • Cone Filter
  • Basket Filter
  • V Cone Filter
  • Disc Filter
  • Drip Bag Coffee Filter
  • Others

By Material Type:

  • Bleached Paper
  • Unbleached Paper

By Thickness:

  • Up to 20 GSM
  • 20 to 40 GSM
  • Above 40 GSM

By End-Use:

  • Commercial Use
  • Institutional Use
  • Household Use

By Region:

  • North America
  • Latin America
  • Europe
  • South Asia
  • East Asia
  • Oceania
  • The Middle East and Africa (MEA)

Frequently Asked Questions

What is the Current Market Valuation?

The market is valued at US$ 600.2 million in 2023.

Who are the Key Coffee Filter Paper Industry Players?

Ahlstrom-Munksjö Oyj, Riensch & Held GmbH & Co.KG, and BV Filtropa are the key industry players.

What is the Expected Coffee Filter Paper Market Size by 2033?

The market is expected to be worth US$ 1,006.0 million by 2033.

What Factors Drive Coffee Filter Paper Sales?

Growing demand for specialty coffee creates lucrative prospects for coffee filter paper market growth.

Which is the Key Segment by Product Type in the Coffee Filter Paper Market?

The cone filter is likely to remain the key segment in the market through 2033.

Table of Content

1. Executive Summary

    1.1. Global Market Outlook

    1.2. Demand-side Trends

    1.3. Supply-side Trends

    1.4. Technology Roadmap Analysis

    1.5. Analysis and Recommendations

2. Market Overview

    2.1. Market Coverage / Taxonomy

    2.2. Market Definition / Scope / Limitations

3. Market Background

    3.1. Market Dynamics

        3.1.1. Drivers

        3.1.2. Restraints

        3.1.3. Opportunity

        3.1.4. Trends

    3.2. Scenario Forecast

        3.2.1. Demand in Optimistic Scenario

        3.2.2. Demand in Likely Scenario

        3.2.3. Demand in Conservative Scenario

    3.3. Opportunity Map Analysis

    3.4. Product Life Cycle Analysis

    3.5. Supply Chain Analysis

        3.5.1. Supply Side Participants and their Roles

            3.5.1.1. Producers

            3.5.1.2. Mid-Level Participants (Traders/ Agents/ Brokers)

            3.5.1.3. Wholesalers and Distributors

        3.5.2. Value Added and Value Created at Node in the Supply Chain

        3.5.3. List of Raw Material Suppliers

        3.5.4. List of Existing and Potential Buyer’s

    3.6. Investment Feasibility Matrix

    3.7. Value Chain Analysis

        3.7.1. Profit Margin Analysis

        3.7.2. Wholesalers and Distributors

        3.7.3. Retailers

    3.8. PESTLE and Porter’s Analysis

    3.9. Regulatory Landscape

        3.9.1. By Key Regions

        3.9.2. By Key Countries

    3.10. Regional Parent Market Outlook

    3.11. Production and Consumption Statistics

    3.12. Import and Export Statistics

4. Global Market Analysis 2018 to 2022 and Forecast, 2023 to 2033

    4.1. Historical Market Size Value (US$ Million) & Volume (Units) Analysis, 2018 to 2022

    4.2. Current and Future Market Size Value (US$ Million) & Volume (Units) Projections, 2023 to 2033

        4.2.1. Y-o-Y Growth Trend Analysis

        4.2.2. Absolute $ Opportunity Analysis

5. Global Market Analysis 2018 to 2022 and Forecast 2023 to 2033, By Product Type 

    5.1. Introduction / Key Findings

    5.2. Historical Market Size Value (US$ Million) & Volume (Units) Analysis By Product Type , 2018 to 2022

    5.3. Current and Future Market Size Value (US$ Million) & Volume (Units) Analysis and Forecast By Product Type , 2023 to 2033

        5.3.1. Cone Filter

        5.3.2. Basket Filter

        5.3.3. V Cone Filter

        5.3.4. Disc Filter

        5.3.5. Drip Bag Coffee Filter

        5.3.6. Others

    5.4. Y-o-Y Growth Trend Analysis By Product Type , 2018 to 2022

    5.5. Absolute $ Opportunity Analysis By Product Type , 2023 to 2033

6. Global Market Analysis 2018 to 2022 and Forecast 2023 to 2033, By Material Type

    6.1. Introduction / Key Findings

    6.2. Historical Market Size Value (US$ Million) & Volume (Units) Analysis By Material Type, 2018 to 2022

    6.3. Current and Future Market Size Value (US$ Million) & Volume (Units) Analysis and Forecast By Material Type, 2023 to 2033

        6.3.1. Bleached Paper

        6.3.2. Unbleached Paper

    6.4. Y-o-Y Growth Trend Analysis By Material Type, 2018 to 2022

    6.5. Absolute $ Opportunity Analysis By Material Type, 2023 to 2033

7. Global Market Analysis 2018 to 2022 and Forecast 2023 to 2033, By Thickness

    7.1. Introduction / Key Findings

    7.2. Historical Market Size Value (US$ Million) & Volume (Units) Analysis By Thickness, 2018 to 2022

    7.3. Current and Future Market Size Value (US$ Million) & Volume (Units) Analysis and Forecast By Thickness, 2023 to 2033

        7.3.1. Up to 20 GSM

        7.3.2. 20 to 40 GSM

        7.3.3. Above 40 GSM

    7.4. Y-o-Y Growth Trend Analysis By Thickness, 2018 to 2022

    7.5. Absolute $ Opportunity Analysis By Thickness, 2023 to 2033

8. Global Market Analysis 2018 to 2022 and Forecast 2023 to 2033, By End-Use

    8.1. Introduction / Key Findings

    8.2. Historical Market Size Value (US$ Million) & Volume (Units) Analysis By End-Use, 2018 to 2022

    8.3. Current and Future Market Size Value (US$ Million) & Volume (Units) Analysis and Forecast By End-Use, 2023 to 2033

        8.3.1. Commercial Use

        8.3.2. Institutional Use

        8.3.3. Household Use

    8.4. Y-o-Y Growth Trend Analysis By End-Use, 2018 to 2022

    8.5. Absolute $ Opportunity Analysis By End-Use, 2023 to 2033

9. Global Market Analysis 2018 to 2022 and Forecast 2023 to 2033, By Region

    9.1. Introduction

    9.2. Historical Market Size Value (US$ Million) & Volume (Units) Analysis By Region, 2018 to 2022

    9.3. Current Market Size Value (US$ Million) & Volume (Units) Analysis and Forecast By Region, 2023 to 2033

        9.3.1. North America

        9.3.2. Latin America

        9.3.3. Europe

        9.3.4. Asia Pacific

        9.3.5. MEA

    9.4. Market Attractiveness Analysis By Region

10. North America Market Analysis 2018 to 2022 and Forecast 2023 to 2033, By Country

    10.1. Historical Market Size Value (US$ Million) & Volume (Units) Trend Analysis By Market Taxonomy, 2018 to 2022

    10.2. Market Size Value (US$ Million) & Volume (Units) Forecast By Market Taxonomy, 2023 to 2033

        10.2.1. By Country

            10.2.1.1. U.S.

            10.2.1.2. Canada

        10.2.2. By Product Type

        10.2.3. By Material Type

        10.2.4. By Thickness

        10.2.5. By End-Use

    10.3. Market Attractiveness Analysis

        10.3.1. By Country

        10.3.2. By Product Type

        10.3.3. By Material Type

        10.3.4. By Thickness

        10.3.5. By End-Use

    10.4. Key Takeaways

11. Latin America Market Analysis 2018 to 2022 and Forecast 2023 to 2033, By Country

    11.1. Historical Market Size Value (US$ Million) & Volume (Units) Trend Analysis By Market Taxonomy, 2018 to 2022

    11.2. Market Size Value (US$ Million) & Volume (Units) Forecast By Market Taxonomy, 2023 to 2033

        11.2.1. By Country

            11.2.1.1. Brazil

            11.2.1.2. Mexico

            11.2.1.3. Rest of Latin America

        11.2.2. By Product Type

        11.2.3. By Material Type

        11.2.4. By Thickness

        11.2.5. By End-Use

    11.3. Market Attractiveness Analysis

        11.3.1. By Country

        11.3.2. By Product Type

        11.3.3. By Material Type

        11.3.4. By Thickness

        11.3.5. By End-Use

    11.4. Key Takeaways

12. Europe Market Analysis 2018 to 2022 and Forecast 2023 to 2033, By Country

    12.1. Historical Market Size Value (US$ Million) & Volume (Units) Trend Analysis By Market Taxonomy, 2018 to 2022

    12.2. Market Size Value (US$ Million) & Volume (Units) Forecast By Market Taxonomy, 2023 to 2033

        12.2.1. By Country

            12.2.1.1. Germany

            12.2.1.2. U.K.

            12.2.1.3. France

            12.2.1.4. Spain

            12.2.1.5. Italy

            12.2.1.6. Rest of Europe

        12.2.2. By Product Type

        12.2.3. By Material Type

        12.2.4. By Thickness

        12.2.5. By End-Use

    12.3. Market Attractiveness Analysis

        12.3.1. By Country

        12.3.2. By Product Type

        12.3.3. By Material Type

        12.3.4. By Thickness

        12.3.5. By End-Use

    12.4. Key Takeaways

13. Asia Pacific Market Analysis 2018 to 2022 and Forecast 2023 to 2033, By Country

    13.1. Historical Market Size Value (US$ Million) & Volume (Units) Trend Analysis By Market Taxonomy, 2018 to 2022

    13.2. Market Size Value (US$ Million) & Volume (Units) Forecast By Market Taxonomy, 2023 to 2033

        13.2.1. By Country

            13.2.1.1. China

            13.2.1.2. Japan

            13.2.1.3. South Korea

            13.2.1.4. Singapore

            13.2.1.5. Thailand

            13.2.1.6. Indonesia

            13.2.1.7. Australia

            13.2.1.8. New Zealand

            13.2.1.9. Rest of Asia Pacific

        13.2.2. By Product Type

        13.2.3. By Material Type

        13.2.4. By Thickness

        13.2.5. By End-Use

    13.3. Market Attractiveness Analysis

        13.3.1. By Country

        13.3.2. By Product Type

        13.3.3. By Material Type

        13.3.4. By Thickness

        13.3.5. By End-Use

    13.4. Key Takeaways

14. MEA Market Analysis 2018 to 2022 and Forecast 2023 to 2033, By Country

    14.1. Historical Market Size Value (US$ Million) & Volume (Units) Trend Analysis By Market Taxonomy, 2018 to 2022

    14.2. Market Size Value (US$ Million) & Volume (Units) Forecast By Market Taxonomy, 2023 to 2033

        14.2.1. By Country

            14.2.1.1. GCC Countries

            14.2.1.2. South Africa

            14.2.1.3. Israel

            14.2.1.4. Rest of MEA

        14.2.2. By Product Type

        14.2.3. By Material Type

        14.2.4. By Thickness

        14.2.5. By End-Use

    14.3. Market Attractiveness Analysis

        14.3.1. By Country

        14.3.2. By Product Type

        14.3.3. By Material Type

        14.3.4. By Thickness

        14.3.5. By End-Use

    14.4. Key Takeaways

15. Key Countries Market Analysis

    15.1. U.S.

        15.1.1. Pricing Analysis

        15.1.2. Market Share Analysis, 2022

            15.1.2.1. By Product Type

            15.1.2.2. By Material Type

            15.1.2.3. By Thickness

            15.1.2.4. By End-Use

    15.2. Canada

        15.2.1. Pricing Analysis

        15.2.2. Market Share Analysis, 2022

            15.2.2.1. By Product Type

            15.2.2.2. By Material Type

            15.2.2.3. By Thickness

            15.2.2.4. By End-Use

    15.3. Brazil

        15.3.1. Pricing Analysis

        15.3.2. Market Share Analysis, 2022

            15.3.2.1. By Product Type

            15.3.2.2. By Material Type

            15.3.2.3. By Thickness

            15.3.2.4. By End-Use

    15.4. Mexico

        15.4.1. Pricing Analysis

        15.4.2. Market Share Analysis, 2022

            15.4.2.1. By Product Type

            15.4.2.2. By Material Type

            15.4.2.3. By Thickness

            15.4.2.4. By End-Use

    15.5. Germany

        15.5.1. Pricing Analysis

        15.5.2. Market Share Analysis, 2022

            15.5.2.1. By Product Type

            15.5.2.2. By Material Type

            15.5.2.3. By Thickness

            15.5.2.4. By End-Use

    15.6. U.K.

        15.6.1. Pricing Analysis

        15.6.2. Market Share Analysis, 2022

            15.6.2.1. By Product Type

            15.6.2.2. By Material Type

            15.6.2.3. By Thickness

            15.6.2.4. By End-Use

    15.7. France

        15.7.1. Pricing Analysis

        15.7.2. Market Share Analysis, 2022

            15.7.2.1. By Product Type

            15.7.2.2. By Material Type

            15.7.2.3. By Thickness

            15.7.2.4. By End-Use

    15.8. Spain

        15.8.1. Pricing Analysis

        15.8.2. Market Share Analysis, 2022

            15.8.2.1. By Product Type

            15.8.2.2. By Material Type

            15.8.2.3. By Thickness

            15.8.2.4. By End-Use

    15.9. Italy

        15.9.1. Pricing Analysis

        15.9.2. Market Share Analysis, 2022

            15.9.2.1. By Product Type

            15.9.2.2. By Material Type

            15.9.2.3. By Thickness

            15.9.2.4. By End-Use

    15.10. China

        15.10.1. Pricing Analysis

        15.10.2. Market Share Analysis, 2022

            15.10.2.1. By Product Type

            15.10.2.2. By Material Type

            15.10.2.3. By Thickness

            15.10.2.4. By End-Use

    15.11. Japan

        15.11.1. Pricing Analysis

        15.11.2. Market Share Analysis, 2022

            15.11.2.1. By Product Type

            15.11.2.2. By Material Type

            15.11.2.3. By Thickness

            15.11.2.4. By End-Use

    15.12. South Korea

        15.12.1. Pricing Analysis

        15.12.2. Market Share Analysis, 2022

            15.12.2.1. By Product Type

            15.12.2.2. By Material Type

            15.12.2.3. By Thickness

            15.12.2.4. By End-Use

    15.13. Singapore

        15.13.1. Pricing Analysis

        15.13.2. Market Share Analysis, 2022

            15.13.2.1. By Product Type

            15.13.2.2. By Material Type

            15.13.2.3. By Thickness

            15.13.2.4. By End-Use

    15.14. Thailand

        15.14.1. Pricing Analysis

        15.14.2. Market Share Analysis, 2022

            15.14.2.1. By Product Type

            15.14.2.2. By Material Type

            15.14.2.3. By Thickness

            15.14.2.4. By End-Use

    15.15. Indonesia

        15.15.1. Pricing Analysis

        15.15.2. Market Share Analysis, 2022

            15.15.2.1. By Product Type

            15.15.2.2. By Material Type

            15.15.2.3. By Thickness

            15.15.2.4. By End-Use

    15.16. Australia

        15.16.1. Pricing Analysis

        15.16.2. Market Share Analysis, 2022

            15.16.2.1. By Product Type

            15.16.2.2. By Material Type

            15.16.2.3. By Thickness

            15.16.2.4. By End-Use

    15.17. New Zealand

        15.17.1. Pricing Analysis

        15.17.2. Market Share Analysis, 2022

            15.17.2.1. By Product Type

            15.17.2.2. By Material Type

            15.17.2.3. By Thickness

            15.17.2.4. By End-Use

    15.18. GCC Countries

        15.18.1. Pricing Analysis

        15.18.2. Market Share Analysis, 2022

            15.18.2.1. By Product Type

            15.18.2.2. By Material Type

            15.18.2.3. By Thickness

            15.18.2.4. By End-Use

    15.19. South Africa

        15.19.1. Pricing Analysis

        15.19.2. Market Share Analysis, 2022

            15.19.2.1. By Product Type

            15.19.2.2. By Material Type

            15.19.2.3. By Thickness

            15.19.2.4. By End-Use

    15.20. Israel

        15.20.1. Pricing Analysis

        15.20.2. Market Share Analysis, 2022

            15.20.2.1. By Product Type

            15.20.2.2. By Material Type

            15.20.2.3. By Thickness

            15.20.2.4. By End-Use

16. Market Structure Analysis

    16.1. Competition Dashboard

    16.2. Competition Benchmarking

    16.3. Market Share Analysis of Top Players

        16.3.1. By Regional

        16.3.2. By Product Type

        16.3.3. By Material Type

        16.3.4. By Thickness

        16.3.5. By End-Use

17. Competition Analysis

    17.1. Competition Deep Dive

        17.1.1. Ahlstrom-Munksjö Oyj

            17.1.1.1. Overview

            17.1.1.2. Product Portfolio

            17.1.1.3. Profitability by Market Segments

            17.1.1.4. Sales Footprint

            17.1.1.5. Strategy Overview

                17.1.1.5.1. Marketing Strategy

                17.1.1.5.2. Product Strategy

                17.1.1.5.3. Channel Strategy

        17.1.2. Riensch & Held GmbH & Co.KG

            17.1.2.1. Overview

            17.1.2.2. Product Portfolio

            17.1.2.3. Profitability by Market Segments

            17.1.2.4. Sales Footprint

            17.1.2.5. Strategy Overview

                17.1.2.5.1. Marketing Strategy

                17.1.2.5.2. Product Strategy

                17.1.2.5.3. Channel Strategy

        17.1.3. BV Filtropa

            17.1.3.1. Overview

            17.1.3.2. Product Portfolio

            17.1.3.3. Profitability by Market Segments

            17.1.3.4. Sales Footprint

            17.1.3.5. Strategy Overview

                17.1.3.5.1. Marketing Strategy

                17.1.3.5.2. Product Strategy

                17.1.3.5.3. Channel Strategy

        17.1.4. TERRANOVA PAPERS SA

            17.1.4.1. Overview

            17.1.4.2. Product Portfolio

            17.1.4.3. Profitability by Market Segments

            17.1.4.4. Sales Footprint

            17.1.4.5. Strategy Overview

                17.1.4.5.1. Marketing Strategy

                17.1.4.5.2. Product Strategy

                17.1.4.5.3. Channel Strategy

        17.1.5. Neu Kaliss Spezialpapier GmbH

            17.1.5.1. Overview

            17.1.5.2. Product Portfolio

            17.1.5.3. Profitability by Market Segments

            17.1.5.4. Sales Footprint

            17.1.5.5. Strategy Overview

                17.1.5.5.1. Marketing Strategy

                17.1.5.5.2. Product Strategy

                17.1.5.5.3. Channel Strategy

        17.1.6. Melitta

            17.1.6.1. Overview

            17.1.6.2. Product Portfolio

            17.1.6.3. Profitability by Market Segments

            17.1.6.4. Sales Footprint

            17.1.6.5. Strategy Overview

                17.1.6.5.1. Marketing Strategy

                17.1.6.5.2. Product Strategy

                17.1.6.5.3. Channel Strategy

        17.1.7. Glatfelter Corporation

            17.1.7.1. Overview

            17.1.7.2. Product Portfolio

            17.1.7.3. Profitability by Market Segments

            17.1.7.4. Sales Footprint

            17.1.7.5. Strategy Overview

                17.1.7.5.1. Marketing Strategy

                17.1.7.5.2. Product Strategy

                17.1.7.5.3. Channel Strategy

        17.1.8. Purico Group Limited

            17.1.8.1. Overview

            17.1.8.2. Product Portfolio

            17.1.8.3. Profitability by Market Segments

            17.1.8.4. Sales Footprint

            17.1.8.5. Strategy Overview

                17.1.8.5.1. Marketing Strategy

                17.1.8.5.2. Product Strategy

                17.1.8.5.3. Channel Strategy

        17.1.9. KONOS GmbH

            17.1.9.1. Overview

            17.1.9.2. Product Portfolio

            17.1.9.3. Profitability by Market Segments

            17.1.9.4. Sales Footprint

            17.1.9.5. Strategy Overview

                17.1.9.5.1. Marketing Strategy

                17.1.9.5.2. Product Strategy

                17.1.9.5.3. Channel Strategy

        17.1.10. Animo B.V

            17.1.10.1. Overview

            17.1.10.2. Product Portfolio

            17.1.10.3. Profitability by Market Segments

            17.1.10.4. Sales Footprint

            17.1.10.5. Strategy Overview

                17.1.10.5.1. Marketing Strategy

                17.1.10.5.2. Product Strategy

                17.1.10.5.3. Channel Strategy

        17.1.11. Rockline Industries

            17.1.11.1. Overview

            17.1.11.2. Product Portfolio

            17.1.11.3. Profitability by Market Segments

            17.1.11.4. Sales Footprint

            17.1.11.5. Strategy Overview

                17.1.11.5.1. Marketing Strategy

                17.1.11.5.2. Product Strategy

                17.1.11.5.3. Channel Strategy

        17.1.12. Thomas & Green

            17.1.12.1. Overview

            17.1.12.2. Product Portfolio

            17.1.12.3. Profitability by Market Segments

            17.1.12.4. Sales Footprint

            17.1.12.5. Strategy Overview

                17.1.12.5.1. Marketing Strategy

                17.1.12.5.2. Product Strategy

                17.1.12.5.3. Channel Strategy

18. Assumptions & Acronyms Used

19. Research Methodology

Don't pay for what you don't need

Customize your report by selecting specific countries or regions and save 30%!

List of Tables

Table 1: Global Market Value (US$ Million) Forecast by Region, 2018 to 2033

Table 2: Global Market Volume (Units) Forecast by Region, 2018 to 2033

Table 3: Global Market Value (US$ Million) Forecast by Product Type, 2018 to 2033

Table 4: Global Market Volume (Units) Forecast by Product Type, 2018 to 2033

Table 5: Global Market Value (US$ Million) Forecast by Material Type, 2018 to 2033

Table 6: Global Market Volume (Units) Forecast by Material Type, 2018 to 2033

Table 7: Global Market Value (US$ Million) Forecast by Thickness, 2018 to 2033

Table 8: Global Market Volume (Units) Forecast by Thickness, 2018 to 2033

Table 9: Global Market Value (US$ Million) Forecast by End-Use, 2018 to 2033

Table 10: Global Market Volume (Units) Forecast by End-Use, 2018 to 2033

Table 11: North America Market Value (US$ Million) Forecast by Country, 2018 to 2033

Table 12: North America Market Volume (Units) Forecast by Country, 2018 to 2033

Table 13: North America Market Value (US$ Million) Forecast by Product Type, 2018 to 2033

Table 14: North America Market Volume (Units) Forecast by Product Type, 2018 to 2033

Table 15: North America Market Value (US$ Million) Forecast by Material Type, 2018 to 2033

Table 16: North America Market Volume (Units) Forecast by Material Type, 2018 to 2033

Table 17: North America Market Value (US$ Million) Forecast by Thickness, 2018 to 2033

Table 18: North America Market Volume (Units) Forecast by Thickness, 2018 to 2033

Table 19: North America Market Value (US$ Million) Forecast by End-Use, 2018 to 2033

Table 20: North America Market Volume (Units) Forecast by End-Use, 2018 to 2033

Table 21: Latin America Market Value (US$ Million) Forecast by Country, 2018 to 2033

Table 22: Latin America Market Volume (Units) Forecast by Country, 2018 to 2033

Table 23: Latin America Market Value (US$ Million) Forecast by Product Type, 2018 to 2033

Table 24: Latin America Market Volume (Units) Forecast by Product Type, 2018 to 2033

Table 25: Latin America Market Value (US$ Million) Forecast by Material Type, 2018 to 2033

Table 26: Latin America Market Volume (Units) Forecast by Material Type, 2018 to 2033

Table 27: Latin America Market Value (US$ Million) Forecast by Thickness, 2018 to 2033

Table 28: Latin America Market Volume (Units) Forecast by Thickness, 2018 to 2033

Table 29: Latin America Market Value (US$ Million) Forecast by End-Use, 2018 to 2033

Table 30: Latin America Market Volume (Units) Forecast by End-Use, 2018 to 2033

Table 31: Europe Market Value (US$ Million) Forecast by Country, 2018 to 2033

Table 32: Europe Market Volume (Units) Forecast by Country, 2018 to 2033

Table 33: Europe Market Value (US$ Million) Forecast by Product Type, 2018 to 2033

Table 34: Europe Market Volume (Units) Forecast by Product Type, 2018 to 2033

Table 35: Europe Market Value (US$ Million) Forecast by Material Type, 2018 to 2033

Table 36: Europe Market Volume (Units) Forecast by Material Type, 2018 to 2033

Table 37: Europe Market Value (US$ Million) Forecast by Thickness, 2018 to 2033

Table 38: Europe Market Volume (Units) Forecast by Thickness, 2018 to 2033

Table 39: Europe Market Value (US$ Million) Forecast by End-Use, 2018 to 2033

Table 40: Europe Market Volume (Units) Forecast by End-Use, 2018 to 2033

Table 41: Asia Pacific Market Value (US$ Million) Forecast by Country, 2018 to 2033

Table 42: Asia Pacific Market Volume (Units) Forecast by Country, 2018 to 2033

Table 43: Asia Pacific Market Value (US$ Million) Forecast by Product Type, 2018 to 2033

Table 44: Asia Pacific Market Volume (Units) Forecast by Product Type, 2018 to 2033

Table 45: Asia Pacific Market Value (US$ Million) Forecast by Material Type, 2018 to 2033

Table 46: Asia Pacific Market Volume (Units) Forecast by Material Type, 2018 to 2033

Table 47: Asia Pacific Market Value (US$ Million) Forecast by Thickness, 2018 to 2033

Table 48: Asia Pacific Market Volume (Units) Forecast by Thickness, 2018 to 2033

Table 49: Asia Pacific Market Value (US$ Million) Forecast by End-Use, 2018 to 2033

Table 50: Asia Pacific Market Volume (Units) Forecast by End-Use, 2018 to 2033

Table 51: MEA Market Value (US$ Million) Forecast by Country, 2018 to 2033

Table 52: MEA Market Volume (Units) Forecast by Country, 2018 to 2033

Table 53: MEA Market Value (US$ Million) Forecast by Product Type, 2018 to 2033

Table 54: MEA Market Volume (Units) Forecast by Product Type, 2018 to 2033

Table 55: MEA Market Value (US$ Million) Forecast by Material Type, 2018 to 2033

Table 56: MEA Market Volume (Units) Forecast by Material Type, 2018 to 2033

Table 57: MEA Market Value (US$ Million) Forecast by Thickness, 2018 to 2033

Table 58: MEA Market Volume (Units) Forecast by Thickness, 2018 to 2033

Table 59: MEA Market Value (US$ Million) Forecast by End-Use, 2018 to 2033

Table 60: MEA Market Volume (Units) Forecast by End-Use, 2018 to 2033
Ismail Sutaria
Ismail Sutaria

Principal Consultant

Talk to Analyst

Find your sweet spots for generating winning opportunities in this market.

List of Charts

Figure 1: Global Market Value (US$ Million) by Product Type, 2023 to 2033

Figure 2: Global Market Value (US$ Million) by Material Type, 2023 to 2033

Figure 3: Global Market Value (US$ Million) by Thickness, 2023 to 2033

Figure 4: Global Market Value (US$ Million) by End-Use, 2023 to 2033

Figure 5: Global Market Value (US$ Million) by Region, 2023 to 2033

Figure 6: Global Market Value (US$ Million) Analysis by Region, 2018 to 2033

Figure 7: Global Market Volume (Units) Analysis by Region, 2018 to 2033

Figure 8: Global Market Value Share (%) and BPS Analysis by Region, 2023 to 2033

Figure 9: Global Market Y-o-Y Growth (%) Projections by Region, 2023 to 2033

Figure 10: Global Market Value (US$ Million) Analysis by Product Type, 2018 to 2033

Figure 11: Global Market Volume (Units) Analysis by Product Type, 2018 to 2033

Figure 12: Global Market Value Share (%) and BPS Analysis by Product Type, 2023 to 2033

Figure 13: Global Market Y-o-Y Growth (%) Projections by Product Type, 2023 to 2033

Figure 14: Global Market Value (US$ Million) Analysis by Material Type, 2018 to 2033

Figure 15: Global Market Volume (Units) Analysis by Material Type, 2018 to 2033

Figure 16: Global Market Value Share (%) and BPS Analysis by Material Type, 2023 to 2033

Figure 17: Global Market Y-o-Y Growth (%) Projections by Material Type, 2023 to 2033

Figure 18: Global Market Value (US$ Million) Analysis by Thickness, 2018 to 2033

Figure 19: Global Market Volume (Units) Analysis by Thickness, 2018 to 2033

Figure 20: Global Market Value Share (%) and BPS Analysis by Thickness, 2023 to 2033

Figure 21: Global Market Y-o-Y Growth (%) Projections by Thickness, 2023 to 2033

Figure 22: Global Market Value (US$ Million) Analysis by End-Use, 2018 to 2033

Figure 23: Global Market Volume (Units) Analysis by End-Use, 2018 to 2033

Figure 24: Global Market Value Share (%) and BPS Analysis by End-Use, 2023 to 2033

Figure 25: Global Market Y-o-Y Growth (%) Projections by End-Use, 2023 to 2033

Figure 26: Global Market Attractiveness by Product Type, 2023 to 2033

Figure 27: Global Market Attractiveness by Material Type, 2023 to 2033

Figure 28: Global Market Attractiveness by Thickness, 2023 to 2033

Figure 29: Global Market Attractiveness by End-Use, 2023 to 2033

Figure 30: Global Market Attractiveness by Region, 2023 to 2033

Figure 31: North America Market Value (US$ Million) by Product Type, 2023 to 2033

Figure 32: North America Market Value (US$ Million) by Material Type, 2023 to 2033

Figure 33: North America Market Value (US$ Million) by Thickness, 2023 to 2033

Figure 34: North America Market Value (US$ Million) by End-Use, 2023 to 2033

Figure 35: North America Market Value (US$ Million) by Country, 2023 to 2033

Figure 36: North America Market Value (US$ Million) Analysis by Country, 2018 to 2033

Figure 37: North America Market Volume (Units) Analysis by Country, 2018 to 2033

Figure 38: North America Market Value Share (%) and BPS Analysis by Country, 2023 to 2033

Figure 39: North America Market Y-o-Y Growth (%) Projections by Country, 2023 to 2033

Figure 40: North America Market Value (US$ Million) Analysis by Product Type, 2018 to 2033

Figure 41: North America Market Volume (Units) Analysis by Product Type, 2018 to 2033

Figure 42: North America Market Value Share (%) and BPS Analysis by Product Type, 2023 to 2033

Figure 43: North America Market Y-o-Y Growth (%) Projections by Product Type, 2023 to 2033

Figure 44: North America Market Value (US$ Million) Analysis by Material Type, 2018 to 2033

Figure 45: North America Market Volume (Units) Analysis by Material Type, 2018 to 2033

Figure 46: North America Market Value Share (%) and BPS Analysis by Material Type, 2023 to 2033

Figure 47: North America Market Y-o-Y Growth (%) Projections by Material Type, 2023 to 2033

Figure 48: North America Market Value (US$ Million) Analysis by Thickness, 2018 to 2033

Figure 49: North America Market Volume (Units) Analysis by Thickness, 2018 to 2033

Figure 50: North America Market Value Share (%) and BPS Analysis by Thickness, 2023 to 2033

Figure 51: North America Market Y-o-Y Growth (%) Projections by Thickness, 2023 to 2033

Figure 52: North America Market Value (US$ Million) Analysis by End-Use, 2018 to 2033

Figure 53: North America Market Volume (Units) Analysis by End-Use, 2018 to 2033

Figure 54: North America Market Value Share (%) and BPS Analysis by End-Use, 2023 to 2033

Figure 55: North America Market Y-o-Y Growth (%) Projections by End-Use, 2023 to 2033

Figure 56: North America Market Attractiveness by Product Type, 2023 to 2033

Figure 57: North America Market Attractiveness by Material Type, 2023 to 2033

Figure 58: North America Market Attractiveness by Thickness, 2023 to 2033

Figure 59: North America Market Attractiveness by End-Use, 2023 to 2033

Figure 60: North America Market Attractiveness by Country, 2023 to 2033

Figure 61: Latin America Market Value (US$ Million) by Product Type, 2023 to 2033

Figure 62: Latin America Market Value (US$ Million) by Material Type, 2023 to 2033

Figure 63: Latin America Market Value (US$ Million) by Thickness, 2023 to 2033

Figure 64: Latin America Market Value (US$ Million) by End-Use, 2023 to 2033

Figure 65: Latin America Market Value (US$ Million) by Country, 2023 to 2033

Figure 66: Latin America Market Value (US$ Million) Analysis by Country, 2018 to 2033

Figure 67: Latin America Market Volume (Units) Analysis by Country, 2018 to 2033

Figure 68: Latin America Market Value Share (%) and BPS Analysis by Country, 2023 to 2033

Figure 69: Latin America Market Y-o-Y Growth (%) Projections by Country, 2023 to 2033

Figure 70: Latin America Market Value (US$ Million) Analysis by Product Type, 2018 to 2033

Figure 71: Latin America Market Volume (Units) Analysis by Product Type, 2018 to 2033

Figure 72: Latin America Market Value Share (%) and BPS Analysis by Product Type, 2023 to 2033

Figure 73: Latin America Market Y-o-Y Growth (%) Projections by Product Type, 2023 to 2033

Figure 74: Latin America Market Value (US$ Million) Analysis by Material Type, 2018 to 2033

Figure 75: Latin America Market Volume (Units) Analysis by Material Type, 2018 to 2033

Figure 76: Latin America Market Value Share (%) and BPS Analysis by Material Type, 2023 to 2033

Figure 77: Latin America Market Y-o-Y Growth (%) Projections by Material Type, 2023 to 2033

Figure 78: Latin America Market Value (US$ Million) Analysis by Thickness, 2018 to 2033

Figure 79: Latin America Market Volume (Units) Analysis by Thickness, 2018 to 2033

Figure 80: Latin America Market Value Share (%) and BPS Analysis by Thickness, 2023 to 2033

Figure 81: Latin America Market Y-o-Y Growth (%) Projections by Thickness, 2023 to 2033

Figure 82: Latin America Market Value (US$ Million) Analysis by End-Use, 2018 to 2033

Figure 83: Latin America Market Volume (Units) Analysis by End-Use, 2018 to 2033

Figure 84: Latin America Market Value Share (%) and BPS Analysis by End-Use, 2023 to 2033

Figure 85: Latin America Market Y-o-Y Growth (%) Projections by End-Use, 2023 to 2033

Figure 86: Latin America Market Attractiveness by Product Type, 2023 to 2033

Figure 87: Latin America Market Attractiveness by Material Type, 2023 to 2033

Figure 88: Latin America Market Attractiveness by Thickness, 2023 to 2033

Figure 89: Latin America Market Attractiveness by End-Use, 2023 to 2033

Figure 90: Latin America Market Attractiveness by Country, 2023 to 2033

Figure 91: Europe Market Value (US$ Million) by Product Type, 2023 to 2033

Figure 92: Europe Market Value (US$ Million) by Material Type, 2023 to 2033

Figure 93: Europe Market Value (US$ Million) by Thickness, 2023 to 2033

Figure 94: Europe Market Value (US$ Million) by End-Use, 2023 to 2033

Figure 95: Europe Market Value (US$ Million) by Country, 2023 to 2033

Figure 96: Europe Market Value (US$ Million) Analysis by Country, 2018 to 2033

Figure 97: Europe Market Volume (Units) Analysis by Country, 2018 to 2033

Figure 98: Europe Market Value Share (%) and BPS Analysis by Country, 2023 to 2033

Figure 99: Europe Market Y-o-Y Growth (%) Projections by Country, 2023 to 2033

Figure 100: Europe Market Value (US$ Million) Analysis by Product Type, 2018 to 2033

Figure 101: Europe Market Volume (Units) Analysis by Product Type, 2018 to 2033

Figure 102: Europe Market Value Share (%) and BPS Analysis by Product Type, 2023 to 2033

Figure 103: Europe Market Y-o-Y Growth (%) Projections by Product Type, 2023 to 2033

Figure 104: Europe Market Value (US$ Million) Analysis by Material Type, 2018 to 2033

Figure 105: Europe Market Volume (Units) Analysis by Material Type, 2018 to 2033

Figure 106: Europe Market Value Share (%) and BPS Analysis by Material Type, 2023 to 2033

Figure 107: Europe Market Y-o-Y Growth (%) Projections by Material Type, 2023 to 2033

Figure 108: Europe Market Value (US$ Million) Analysis by Thickness, 2018 to 2033

Figure 109: Europe Market Volume (Units) Analysis by Thickness, 2018 to 2033

Figure 110: Europe Market Value Share (%) and BPS Analysis by Thickness, 2023 to 2033

Figure 111: Europe Market Y-o-Y Growth (%) Projections by Thickness, 2023 to 2033

Figure 112: Europe Market Value (US$ Million) Analysis by End-Use, 2018 to 2033

Figure 113: Europe Market Volume (Units) Analysis by End-Use, 2018 to 2033

Figure 114: Europe Market Value Share (%) and BPS Analysis by End-Use, 2023 to 2033

Figure 115: Europe Market Y-o-Y Growth (%) Projections by End-Use, 2023 to 2033

Figure 116: Europe Market Attractiveness by Product Type, 2023 to 2033

Figure 117: Europe Market Attractiveness by Material Type, 2023 to 2033

Figure 118: Europe Market Attractiveness by Thickness, 2023 to 2033

Figure 119: Europe Market Attractiveness by End-Use, 2023 to 2033

Figure 120: Europe Market Attractiveness by Country, 2023 to 2033

Figure 121: Asia Pacific Market Value (US$ Million) by Product Type, 2023 to 2033

Figure 122: Asia Pacific Market Value (US$ Million) by Material Type, 2023 to 2033

Figure 123: Asia Pacific Market Value (US$ Million) by Thickness, 2023 to 2033

Figure 124: Asia Pacific Market Value (US$ Million) by End-Use, 2023 to 2033

Figure 125: Asia Pacific Market Value (US$ Million) by Country, 2023 to 2033

Figure 126: Asia Pacific Market Value (US$ Million) Analysis by Country, 2018 to 2033

Figure 127: Asia Pacific Market Volume (Units) Analysis by Country, 2018 to 2033

Figure 128: Asia Pacific Market Value Share (%) and BPS Analysis by Country, 2023 to 2033

Figure 129: Asia Pacific Market Y-o-Y Growth (%) Projections by Country, 2023 to 2033

Figure 130: Asia Pacific Market Value (US$ Million) Analysis by Product Type, 2018 to 2033

Figure 131: Asia Pacific Market Volume (Units) Analysis by Product Type, 2018 to 2033

Figure 132: Asia Pacific Market Value Share (%) and BPS Analysis by Product Type, 2023 to 2033

Figure 133: Asia Pacific Market Y-o-Y Growth (%) Projections by Product Type, 2023 to 2033

Figure 134: Asia Pacific Market Value (US$ Million) Analysis by Material Type, 2018 to 2033

Figure 135: Asia Pacific Market Volume (Units) Analysis by Material Type, 2018 to 2033

Figure 136: Asia Pacific Market Value Share (%) and BPS Analysis by Material Type, 2023 to 2033

Figure 137: Asia Pacific Market Y-o-Y Growth (%) Projections by Material Type, 2023 to 2033

Figure 138: Asia Pacific Market Value (US$ Million) Analysis by Thickness, 2018 to 2033

Figure 139: Asia Pacific Market Volume (Units) Analysis by Thickness, 2018 to 2033

Figure 140: Asia Pacific Market Value Share (%) and BPS Analysis by Thickness, 2023 to 2033

Figure 141: Asia Pacific Market Y-o-Y Growth (%) Projections by Thickness, 2023 to 2033

Figure 142: Asia Pacific Market Value (US$ Million) Analysis by End-Use, 2018 to 2033

Figure 143: Asia Pacific Market Volume (Units) Analysis by End-Use, 2018 to 2033

Figure 144: Asia Pacific Market Value Share (%) and BPS Analysis by End-Use, 2023 to 2033

Figure 145: Asia Pacific Market Y-o-Y Growth (%) Projections by End-Use, 2023 to 2033

Figure 146: Asia Pacific Market Attractiveness by Product Type, 2023 to 2033

Figure 147: Asia Pacific Market Attractiveness by Material Type, 2023 to 2033

Figure 148: Asia Pacific Market Attractiveness by Thickness, 2023 to 2033

Figure 149: Asia Pacific Market Attractiveness by End-Use, 2023 to 2033

Figure 150: Asia Pacific Market Attractiveness by Country, 2023 to 2033

Figure 151: MEA Market Value (US$ Million) by Product Type, 2023 to 2033

Figure 152: MEA Market Value (US$ Million) by Material Type, 2023 to 2033

Figure 153: MEA Market Value (US$ Million) by Thickness, 2023 to 2033

Figure 154: MEA Market Value (US$ Million) by End-Use, 2023 to 2033

Figure 155: MEA Market Value (US$ Million) by Country, 2023 to 2033

Figure 156: MEA Market Value (US$ Million) Analysis by Country, 2018 to 2033

Figure 157: MEA Market Volume (Units) Analysis by Country, 2018 to 2033

Figure 158: MEA Market Value Share (%) and BPS Analysis by Country, 2023 to 2033

Figure 159: MEA Market Y-o-Y Growth (%) Projections by Country, 2023 to 2033

Figure 160: MEA Market Value (US$ Million) Analysis by Product Type, 2018 to 2033

Figure 161: MEA Market Volume (Units) Analysis by Product Type, 2018 to 2033

Figure 162: MEA Market Value Share (%) and BPS Analysis by Product Type, 2023 to 2033

Figure 163: MEA Market Y-o-Y Growth (%) Projections by Product Type, 2023 to 2033

Figure 164: MEA Market Value (US$ Million) Analysis by Material Type, 2018 to 2033

Figure 165: MEA Market Volume (Units) Analysis by Material Type, 2018 to 2033

Figure 166: MEA Market Value Share (%) and BPS Analysis by Material Type, 2023 to 2033

Figure 167: MEA Market Y-o-Y Growth (%) Projections by Material Type, 2023 to 2033

Figure 168: MEA Market Value (US$ Million) Analysis by Thickness, 2018 to 2033

Figure 169: MEA Market Volume (Units) Analysis by Thickness, 2018 to 2033

Figure 170: MEA Market Value Share (%) and BPS Analysis by Thickness, 2023 to 2033

Figure 171: MEA Market Y-o-Y Growth (%) Projections by Thickness, 2023 to 2033

Figure 172: MEA Market Value (US$ Million) Analysis by End-Use, 2018 to 2033

Figure 173: MEA Market Volume (Units) Analysis by End-Use, 2018 to 2033

Figure 174: MEA Market Value Share (%) and BPS Analysis by End-Use, 2023 to 2033

Figure 175: MEA Market Y-o-Y Growth (%) Projections by End-Use, 2023 to 2033

Figure 176: MEA Market Attractiveness by Product Type, 2023 to 2033

Figure 177: MEA Market Attractiveness by Material Type, 2023 to 2033

Figure 178: MEA Market Attractiveness by Thickness, 2023 to 2033

Figure 179: MEA Market Attractiveness by End-Use, 2023 to 2033

Figure 180: MEA Market Attractiveness by Country, 2023 to 2033

Recommendations

Packaging

Coffee Capsules Market

Published : June 2023

Packaging

Barrier Coated Papers Market

Published : May 2023

Explore Packaging Insights

View Reports

Coffee Filter Paper Market