

- Market Size (2026)
- USD 1.9 Bn
- Forecast (2036)
- USD 3.6 Bn
- CAGR (2026 to 2036)
- 6.6%
How big is Color Sensors Market in 2026?
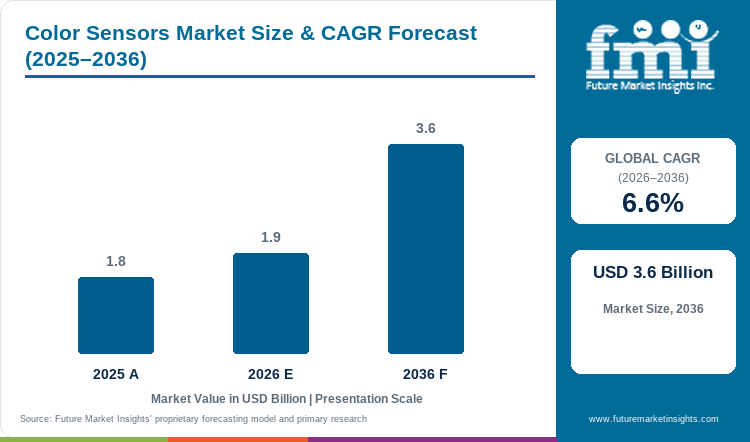
USD 1.9 billion in 2026 and USD 3.6 billion by 2036, expanding at 6.6% CAGR.
Demand for color sensors is projected to expand at 6.6% CAGR from 2026 to 2036. Value grows from USD 1.8 billion in 2025 to USD 1.9 billion in 2026 and reaches USD 3.6 billion by 2036. Factories move repeatable color checks from manual inspection into machine control to keep decisions inside the production cycle. In May 2025, ams OSRAM introduced the TCS3448 multispectral sensor for compact systems that need color data. Its 14 optical channels measure color without requiring a complete camera system. Equipment makers use that smaller data set for focused checks on parts, labels, and surfaces during routine operation.
Local operating conditions shape how quickly color sensing becomes an approved equipment purchase. Taiwan is projected to grow at 7.3% CAGR, while Germany is forecast at 5.6% through 2036. Taiwan's electronics base creates many inspection points for in-line sensors across chips, boards, and factory equipment. In February 2026, Destatis reported that German industrial production fell 1.1% during 2025. Germany's weaker factory trend raises the savings threshold for equipment upgrades in established plants. Taiwan offers more new-equipment work as chip and electronics output expands. German plants place greater weight on system fit, service needs, and measurable savings before replacing a working sensor.
Key Takeaways
- Manufacturers use color sensors to automate repeatable visual checks while protecting production speed and consistent product quality.
- RGB sensors are projected to hold 31.0% of sensor type revenue in 2026, supported by broad use in routine three-channel checks.
- Digital interfaces are estimated to hold 27.0% of output revenue in 2026, enabled by direct transfer of usable color values into controllers.
- Packaging inspection is forecast to represent 28.0% of application revenue in 2026, owing to fast lines requiring dependable label and mark checks.
- Gloss and distance variation can extend line qualification as uneven surfaces may shift color readings during normal production conditions.
- Key players include SICK, Keyence, Banner Engineering, Omron, Pepperl+Fuchs, ams OSRAM, Hamamatsu Photonics, Balluff, Rockwell Automation, and Baumer.
Analyst Perspective
"The strongest adoption route is replacing narrow manual checks with compact sensors that send clear results into existing machine controls. Qualification remains the main hurdle as gloss, distance, and lighting changes can disrupt readings on real production surfaces."
- Sudip Saha, Principal Consultant, Future Market Insights
How is the color sensors market segmented?
The color sensors market is segmented by Sensor Type, Output, Application, End Use, Sales Channel, and Region.
The color sensors market is segmented by sensor type, output, application, end use, sales channel, and region. Sensor type includes RGB sensors, true color sensors, contrast sensors, luminescence sensors, and spectral color sensors. Output covers digital, analog, IO-Link, Industrial Ethernet, and embedded I2C - SPI. Application includes packaging inspection, textile - printing, automotive paint, electronics assembly, and food sorting. End use covers factory automation, consumer electronics, automotive, food & beverage, and medical devices. Sales channel includes automation distributors, direct sensor OEMs, embedded component channels, and system integrators.
How do RGB sensors shape selection within the sensor type category?
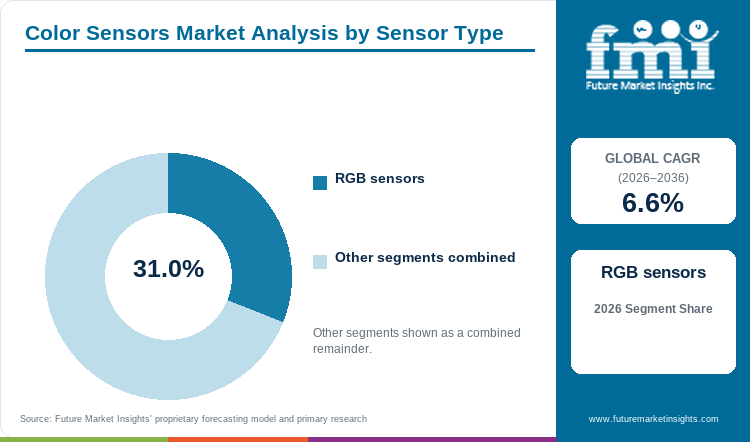
RGB sensors read reflected light through red, green, and blue channels for routine color decisions. Three-channel data handles sorting, mark checks, and basic shade checks without requiring a full spectral scan. In November 2025, SICK published CSM data for an RGB color sensor with IO-Link. The digital link sends color values and device data into machine controls during normal operation. Machine builders choose this compact format when a clear color decision matters more than detailed spectral data. RGB sensing also limits processing needs for repeated checks that require simple control logic and a dependable pass-or-reject result.
- RGB sensors are projected to hold 31.0% of sensor type revenue in 2026, reinforced by their practical fit for routine production checks.
- Machine builders choose RGB sensing for consistent color decisions without carrying the cost or data load of a full spectral scan.
Why does digital output influence the output category?
Digital output sends a ready color value from the sensor into a controller or embedded chip. The digital link removes an analog conversion step and can carry settings alongside device fault data. In November 2025, Rockwell Automation published 46CLR guidance for sensor data and HMI setup. The manual explains how control teams read device values and review faults through standard machine links. Plants use digital color results inside control systems they already maintain. Replacement work also becomes simpler when service teams can restore settings and review faults without a separate signal-conversion layer.
- Digital links are estimated to hold 27.0% of output revenue in 2026, attributable to direct controller access without extra signal conversion.
- Digital connections support remote setup and fault checks, helping service teams restore replacement sensors with less manual configuration.
How does packaging inspection support the application category?
Packaging lines use color sensors for rapid pass-or-reject checks on repeated production features. A sensor confirms marks, labels, caps, and pack types without building a complete image. In October 2025, Banner Engineering released QCM50 IO-Link AOI support files for PLC setup. The files help control teams configure lines that handle frequent product changes and different production recipes. Stored settings reduce setup work during product changes and shorter production runs. Packaging inspection favors compact sensors because many line decisions need a clear result rather than full image analysis. Compact sensing keeps setup practical on fast lines that handle frequent recipe changes.
- Packaging inspection is expected to lead application revenue with 28.0% share in 2026, driven by frequent mark and label checks on fast lines.
- Frequent product changes favor sensors that store taught colors and update settings without requiring a long production stop.
What supports factory automation within the end use category?
Factory automation places each color check inside the normal machine cycle instead of a separate manual inspection step. The sensor sorts a part or confirms a coating before the next machine action begins. In March 2025, Balluff introduced the BOS 6K family with BFS 6K RGB color-sensor models. The family uses IO-Link in a compact sensor format for machine data exchange. Full image sensor systems remain useful for checks that need shape, position, or other visual detail beyond color. Color sensors serve narrower tasks that require a repeatable decision, quick controller response, and less image data during routine production.
- Factory automation is forecast to represent 34.0% of end-use revenue in 2026, reinforced by color checks that trigger immediate machine actions.
- Plants favor color sensors that share fault data with existing controls, helping service teams restore settings during planned sensor replacement.
Why do automation distributors matter within the sales channel category?
Plants often need hands-on support before choosing a color sensor for a specific production line. Range, surface gloss, mounting distance, and control choices can change readings during setup and testing. In September 2026, Keyence introduced the IV4 vision sensor with built-in AI for production inspection. Its US site states that application support covers product choice and practical line use. Keyence gives plant teams a route to test inspection hardware before committing to an order. Automation distributors provide similar support during retrofit and replacement work, especially when sensors must match installed controls and maintenance practices.
- Automation distributors are likely to capture 38.0% of sales channel revenue in 2026, influenced by local support that reduces setup and replacement risk.
- Direct sensor OEMs serve machine builders that need line testing, setup support, and quick access to matching replacement parts.
What are the drivers, restraints and opportunities in the Color Sensors Market?
Automated inspection supports demand, optical variation extends qualification, and connected interfaces can reduce setup and replacement work.
- Driver: Manufacturers move repeatable color checks into machine control, supported by the need to reduce manual inspection without sacrificing production quality.
- Restraint: Gloss and texture can shift sensor readings, constraining qualification when distance or room lighting changes during normal production.
- Opportunity: IO-Link and other digital connections reduce replacement work by moving setup data and fault information into existing machine controls.
Machine control is replacing repeated visual checks
Plants use color sensors for narrow inspection tasks that can move directly into machine control. In April 2025, Pepperl+Fuchs released the VOS1000C color vision sensor for flexible inspection work. The unit combines color sensing with other inspection functions inside one device. Color sensing handles clear pass-or-reject decisions that do not require a complete image. Common jobs include mark checks, coating checks, and part sorting during production. Mark and coating checks use less data than a full machine vision system and require simpler control logic. Adoption is driven by applications that need repeatable decisions at production speed without adding full image processing. Machine control then keeps the inspection step inside the normal production cycle.
Optical variation can extend application qualification
Gloss and surface texture can change color readings as target distance or lighting conditions shift. SICK's January 2026 CSS High Resolution overview describes automatic distance control for changing targets. Automatic distance control removes one source of reading error, although production teams still need line testing. Plant teams teach the actual part and check color limits under normal operating conditions. The IO-Link interface stores setup data that service teams can reuse during later maintenance. Reflective parts and mixed materials may require additional tests before approval. Room lighting also becomes part of the same line trial. Qualification is constrained by the need for stable readings across the full operating range. Extra testing can delay replacement decisions and raise setup cost.
Controller-ready data can reduce commissioning work
Connected color sensors reduce commissioning work by placing device data on a common digital connection. In May 2026, Banner Engineering released Siemens function files for its QCM50 color sensor. The files give control teams a prepared route to device data and control functions. Machine builders store settings and restore them during planned sensor changes. Stored settings shorten restart work on lines with many similar sensing points. The opportunity is enabled by digital interfaces that preserve configuration data across routine service events. Sensor vendors also pair stable color checks with useful fault data for production teams. Stored setup data and fault information reduce service effort without changing the basic inspection task or adding a separate control layer.
Which country CAGRs are profiled in the Color Sensors Market?
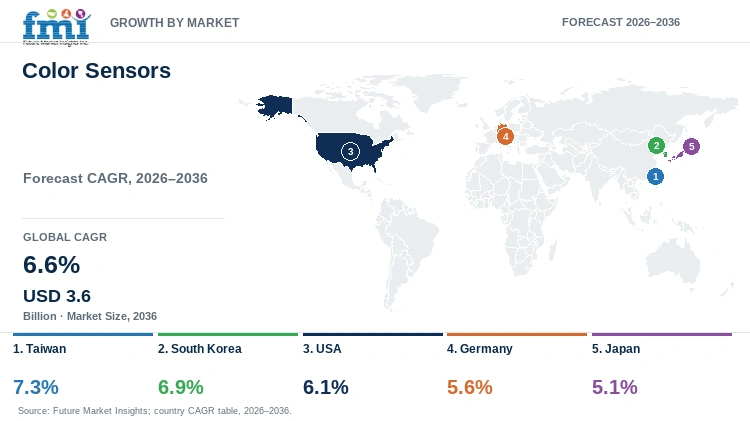
| Country | CAGR |
|---|---|
| Taiwan | 7.3% |
| South Korea | 6.9% |
| USA | 6.1% |
| Germany | 5.6% |
| Japan | 5.1% |
How do country-level CAGRs compare in the Color Sensors Market?
The five profiled countries span 5.1% to 7.3% CAGR across different industrial and automation conditions. Taiwan and South Korea are at the upper end of the range, followed by the USA. Germany and Japan form the lower end as mature installed equipment places greater weight on replacement economics and system compatibility.
- Taiwan's semiconductor equipment base favors compact color sensors that support repeated checks across tightly controlled production stages.
- South Korea's chip, electronics, and vehicle plants rely on connected production systems that reward consistent in-line color decisions.
- Manufacturers in the USA value sensors that standardize routine visual checks across existing automation without requiring a full camera system.
- Germany's established machinery base favors color sensors that match installed controls and provide service data for planned equipment upgrades.
- Japan's automotive and electronics factories prioritize compact sensing that works within proven production routines without adding unnecessary inspection complexity.
The full report provides country-level CAGR analysis across North America, Latin America, Western Europe, Eastern Europe, East Asia, South Asia and Pacific, and the Middle East and Africa.
Country-wise Analysis
- Color sensor demand in Taiwan is forecast to rise at 7.3% CAGR through 2036, supported by electronics production with frequent inspection points. In May 2026, DGBAS reported that factory output grew 26.18% year on year during the first quarter. Chip and computer production accounted for much of that increase across the national manufacturing base. Fast product cycles give equipment makers less time to qualify new sensing parts before production ramps. Strict yield targets also raise the need for dependable readings during line trials. Sensor suppliers must prove stable color values on real parts without slowing equipment qualification. Local technical support then helps successful trials move into regular production with fewer approval delays.
- Adoption of color sensors in South Korea is estimated to expand at 6.9% CAGR through 2036, shaped by connected factory systems. Chip, electronics, and vehicle plants use in-line checks across many linked production steps. In July 2026, the trade ministry said Korea would lead the new IEC SC65F smart-manufacturing group. The group develops common digital rules for equipment used inside connected factories. Large plants need fault information that maintenance teams can read through existing control tools. Sensor suppliers must also prove quick response and stable color decisions at high production speeds. Complex control environments can lengthen testing when new devices conflict with maintenance routines. Clear setup procedures help approved sensors enter regular service with fewer errors.
- Color sensor demand in the USA is forecast to rise at 6.1% CAGR through 2036, linked to wider factory automation. In February 2025, NIST reported that small manufacturers were turning to automation while labor gaps remained. The same guidance called for worker training as production systems become more digital. Smaller plants face tighter limits on control skills and capital than large plants. Limited control skills and capital favor devices that teams can configure without building a separate inspection system. Vendors must show simple setup and measurable savings from fewer manual checks or lower scrap. Clear operating savings help retrofit sensor projects compete for limited plant budgets and approval. Compatibility with installed controls also reduces the burden on smaller maintenance teams.
- Germany is estimated to post 5.6% CAGR through 2036, tied to selective replacement demand in mature automated plants. German factories use established controls and check data compatibility before approving a new sensor. In March 2025, a federal Manufacturing-X paper called for open data spaces and standard factory links. Manufacturing-X goals favor sensors that share information with current plant controls and service tools. Retrofit projects compete with other factory spending because much installed equipment already performs reliably. A new sensor must cut changeover time, lower rejects, or simplify service work enough to justify replacement. Clear operating gains help color sensors secure approval without waiting for a new factory project.
- Color sensor sales in Japan are forecast to expand at 5.1% CAGR through 2036, influenced by vehicle programs using shared digital data. Japanese automotive and electronics plants rely on strict work rules and equipment that has passed long production testing. In June 2025, METI updated the Mobility DX Strategy to connect more vehicle work through shared data. The policy links product design and factory activity through common digital information. New color sensors must prove value against vision cameras and inspection methods that plants already trust. Local service can reduce delays when coatings or parts change with line settings. Stable results on real parts help compact sensors move from trials into approved production use.
Who are the notable companies in the Color Sensors Market?
SICK, Keyence, Banner Engineering, Omron, Pepperl+Fuchs, ams OSRAM, Hamamatsu Photonics, Balluff, Rockwell Automation, and Baumer are active within the defined color sensors supply boundary.
Color sensor suppliers compete through three business models that address different purchase needs. Industrial sensor makers sell devices for line checks and direct machine control. Automation firms connect sensor data with controllers, service tools, and maintenance routines. Optical firms supply small RGB or spectral parts for products with built-in sensing. Factory teams compare reading stability, setup time, control fit, and local support before choosing line sensors. Product teams place more weight on part size, power use, and access to useful color data. Different buyer requirements shape how customers compare sensing options and the support needed for successful use.
- Industrial color sensing includes SICK, Banner Engineering, Omron, Balluff, Rockwell Automation, and Baumer, with portfolios built around production-line color checks.
- Keyence and Pepperl+Fuchs combine industrial sensing with line testing and local support during setup, service, and replacement work.
- ams OSRAM and Hamamatsu Photonics provide compact RGB or spectral components for product teams that build color sensing into smaller devices.
Competitive Benchmarking: Color Sensors Market
| Company | Dedicated Color Sensing | Digital Integration | Application Support | Geographic Reach |
|---|---|---|---|---|
| SICK | High | High | High | Global |
| Keyence | Medium | High | High | Global |
| Banner Engineering | High | High | High | Global |
| Omron | High | High | High | Global |
| Pepperl+Fuchs | Medium | High | Medium | Global |
| ams OSRAM | High | High | Medium | Global |
| Hamamatsu Photonics | High | Medium | Medium | Global |
| Balluff | High | High | High | Global |
| Rockwell Automation | High | High | High | Global |
| Baumer | Medium | Medium | High | Global |
Public product records support the benchmarking scores shown in this table. A High rating marks broad documented activity, while Medium marks a narrower role and Low marks limited evidence. Dedicated Color Sensing covers color checks, mark checks, and spectral measurement. Digital Integration covers IO-Link and built-in data access for connected equipment. Application Support covers line setup, production tests, and technical help during sensor choice or service.
Key Developments in the Color Sensors Market
- In October 2025, Hamamatsu Photonics launched its WS Series mini-spectrometers for compact spectral and color checks.
- In September 2025, ams OSRAM showed behind-OLED spectral color sensing for phone displays and ambient-light control.
- In January 2025, Baumer opened a Mexico subsidiary to expand local support for sensor and machine-vision products.
Key Players in the Color Sensors Market
Industrial color sensing and machine integration
- SICK
- Banner Engineering
- Omron
- Balluff
- Rockwell Automation
- Baumer
Application-led industrial sensing
- Keyence
- Pepperl+Fuchs
Embedded RGB and spectral components
- ams OSRAM
- Hamamatsu Photonics
Color Sensors Market - Report Scope
| Coverage field | Report scope |
|---|---|
| Market breakdown | By sensor type, output, application, end use, sales channel, and region. |
| Quantitative Units | USD billion. |
| Market Definition | Commercial color sensors that detect, classify, or measure color for industrial, embedded, and equipment applications are included. Full imaging systems are excluded. |
| Regions Covered | North America, Latin America, Western Europe, Eastern Europe, East Asia, South Asia and Pacific, and Middle East and Africa. |
| Countries Covered | Taiwan, South Korea, USA, Germany, Japan, and 20+ countries included in the full report. |
| Key Companies Profiled | SICK, Keyence, Banner Engineering, Omron, Pepperl+Fuchs, ams OSRAM, Hamamatsu Photonics, Balluff, Rockwell Automation, Baumer. |
| Forecast Period | 2026 to 2036. |
| Approach | Primary and secondary research with market triangulation. |
Color Sensors Market - Research Methodology
| Method | Approach |
|---|---|
| Primary Research | FMI analysts gathered input from manufacturers, service providers, technology developers, distributors, end users, procurement teams, and subject-matter experts. Interviews examined purchasing decisions, product or service evaluation, adoption barriers, approval requirements, pricing considerations, and expectations for technical or commercial support. Respondents were also asked what evidence is required before a trial, pilot, or initial order develops into regular purchasing. |
| Desk Research | Desk research covered government statistics, regulatory publications, trade data, industry associations, technical literature, standards, company filings, product information, and official corporate announcements. Sources were reviewed for relevance, publication date, geographic coverage, and consistency with the defined market scope. Claims relating to performance, applications, approvals, capacity, investment, and commercial activity were retained only when supported by credible public evidence. |
| Market Sizing and Forecasting | The market model combined the baseline value with historical performance, segment structure, pricing and volume indicators, adoption levels, company participation, and country-level demand conditions. Forecast assumptions considered economic activity, investment trends, regulatory developments, technology adoption, purchasing cycles, supply availability, and barriers to wider market use. Segment and regional estimates were reconciled before the final market total was calculated. |
| Data Validation | Estimates were checked against multiple independent indicators, including public data, company activity, trade patterns, industry developments, and findings from primary interviews. Validation also tested whether products, services, applications, and company revenues fell within the defined market boundaries. Adjacent categories, unsupported claims, overlapping revenues, and activities without direct market relevance were excluded to reduce double counting and maintain consistency across segments and countries. |
Color Sensors Market by Segments
Color Sensors Market segmented by Sensor Type:
- RGB sensors
- True color sensors
- Contrast sensors
- Luminescence sensors
- Spectral color sensors
Color Sensors Market segmented by Output:
- Digital
- Analog
- IO-Link
- Industrial Ethernet
- Embedded I2C - SPI
Color Sensors Market segmented by Application:
- Packaging inspection
- Textile - printing
- Automotive paint
- Electronics assembly
- Food sorting
Color Sensors Market segmented by End Use:
- Factory automation
- Consumer electronics
- Automotive
- Food & beverage
- Medical devices
Color Sensors Market segmented by Sales Channel:
- Automation distributors
- Direct sensor OEM
- Embedded component channel
- System integrators
Color Sensors Market by Region:
- North America
- United States
- Canada
- Latin America
- Brazil
- Mexico
- Chile
- Rest of Latin America
- Western Europe
- Germany
- United Kingdom
- Italy
- Spain
- France
- Nordics
- Benelux
- Rest of Western Europe
- Eastern Europe
- Russia
- Poland
- Hungary
- Balkan and Baltic States
- Rest of Eastern Europe
- East Asia
- China
- Japan
- South Korea
- South Asia and Pacific
- India
- ASEAN
- Australia and New Zealand
- Rest of South Asia and Pacific
- Middle East and Africa
- Kingdom of Saudi Arabia
- Other GCC Countries
- Türkiye
- South Africa
- Other African Union Countries
- Rest of Middle East and Africa
Research Sources and Bibliography
- ams OSRAM. (2025, May 27). GreenTech 2025: Redefining horticulture with light, intelligence, and innovation.
- Federal Statistical Office of Germany (Destatis). (2026, February 6). Production in December 2025: -1.9% on the previous month.
- SICK AG. (2025, November 20). CSM CSM-WP117A2P data sheet.
- Rockwell Automation. (2025, November). Device Objects Reference Manual: 46CLR ColorSight True Color Sensor.
- Banner Engineering. (2025, October 8). QCM50 IO-Link AOI support files.
- Balluff. (2025, March 24). BOS 6K sensor family in new generation.
- KEYENCE Corporation of America. (2026, September 14). Vision Sensor with Built-in AI IV4 Series.
- Pepperl+Fuchs. (2025, April 3). Vision Sensor VOS1000C-F226W-8MM-S.
- SICK AG. (2026, January 8). CSS High Resolution product overview.
- Banner Engineering. (2026, May 5). QCM50 Siemens Functions.
- Directorate General of Budget, Accounting and Statistics, Taiwan. (2026, May 29). GDP: Preliminary estimate for 2026Q1, and outlook for 2026.
- Ministry of Trade, Industry and Resources, Republic of Korea. (2026, July 13). Korea to lead international standardization of smart manufacturing in M.AX era.
- National Institute of Standards and Technology. (2025, February 20). What's coming for US manufacturing in 2025.
- Federal Ministry for Economic Affairs and Energy, Germany. (2025, March 31). Manufacturing-X: The future of industrial value creation is connected.
- Ministry of Economy, Trade and Industry, Japan. (2025, June 9). Mobility Digital Transformation (DX) Strategy updated.
- Hamamatsu Photonics Europe. (2025, October 13). Hamamatsu Photonics' newest compact, high-resolution mini-spectrometers for UV to NIR spectroscopy.
- ams OSRAM. (2025, September 16). Display content exactly as intended everywhere: Behind-OLED spectral color sensing technology.
- Baumer. (2025, January 21). New Baumer site established in Mexico.
- OMRON Corporation. (2026, July 16). OMRON advances inspection technology with NVIDIA Omniverse and Metropolis.
- ams OSRAM. (2026, January 5). ams OSRAM takes the stage at CES 2026 - Combining light, sensors and software to transform industries and improve lives.
- SICK AG. (2025, September 26). SICK expands its digital portfolio with new sensor models.
- Balluff. (2025, May 16). Image capture beyond the visible spectrum.
- Baumer. (2025, October 28). SPS 2025: Secure the lead with Baumer sensor solutions.
- SICK AG. (2025, July 9). SICK's new compact OD200 short-range distance sensor delivers high performance even on complex surfaces.
- KEYENCE Corporation of America. (2026, June 2). AI-Powered High-Performance Vision System VS-G Series.
- Banner Engineering. (2025, July 16). QCM50 Color Sensor Product Manual.
- OMRON Device & Module Solutions. (2026, June 1). New Color Sensor to Build into Equipment B5WC-VB2323-1.
- Pepperl+Fuchs. (2025, March 17). Visit Pepperl+Fuchs at HANNOVER MESSE 2025.
- ams OSRAM. (2026, September). ams OSRAM unveils imaging-to-display sensing solution for smartphones.
- Hamamatsu Photonics. (2025, November 4). New high-speed image sensor with compact package released: CMOS linear image sensor S15611W.
- Balluff. (2025, October 16). BOD 6K laser distance sensor with Time-of-Flight technology.
- Rockwell Automation. (2025, April 4). 45CLR ColorSight Photoelectric Sensor lifecycle replacement notice.
- Baumer. (2025, June 24). Baumer presents the smallest ToF sensor with the longest range.
This bibliography lists the main sources used for reader reference. The full report contains the complete source list and detailed citations.
This Report Answers
- What is the 2026 color sensors market size and 2036 forecast value?
- Which changes are moving color checks from manual inspection into machine control?
- Why do RGB sensors account for the largest verified sensor type share in 2026?
- How do digital outputs connect color sensors with controllers and service work?
- Why does packaging inspection account for the largest verified application share in 2026?
- How do light, gloss, and distance affect color sensor qualification?
- Why do country growth rates differ between Taiwan, South Korea, USA, Germany, and Japan?
- Which companies compete in industrial color sensing, automation links, and built-in spectral parts?
- What should machine builders test before approving production-line color sensors?
Frequently Asked Questions
How large is the color sensors market expected to be in 2026?
The color sensors market is expected to reach USD 1.9 billion in 2026 and USD 3.6 billion by 2036. Factories move routine visual checks into machine control so production lines can inspect parts at normal operating speed.
What is the CAGR of the color sensors market from 2026 to 2036?
The color sensors market is projected to grow at 6.6% CAGR from 2026 to 2036. Wider use of compact sensors supports inspection tasks that need color decisions without a full camera system.
Which sensor type holds the largest share of color sensor revenue?
RGB sensors are expected to hold 31.0% of sensor type revenue in 2026. Their position is supported by three-channel color data that handles many routine checks without a full spectral scan.
Which application segment holds the largest verified share in the color sensors market?
Packaging inspection is projected to hold 28.0% of application revenue in 2026. The position is driven by fast mark and label checks across production lines with frequent product changes.
Which companies are currently active across the color sensors market?
Key companies in the color sensors market include SICK, Keyence, Banner Engineering, Omron, Pepperl+Fuchs, ams OSRAM, and Hamamatsu Photonics. Balluff, Rockwell Automation, and Baumer also compete through industrial sensing, control connections, and application support.
Preview the report firsthand - request a free sample
Get SampleGet the brochure for pricing and purchase details.
Get PDFTable of Content
- Key Takeaways
- Market Size and CAGR
- Top Growth Driver
- Fastest Growing Segment
- Leading Region
- Key Companies
- Emerging Opportunities
- Executive Summary
- Global Market Outlook
- Demand-side Trends
- Supply-side Trends
- Technology Roadmap Analysis
- Analysis and Recommendations
- Analyst Perspective (What is happening? Why now? What should investors know?)
- Key Questions Answered
- How large is the market?
- What is the CAGR?
- What are key trends?
- Which region dominates?
- Who are the leaders?
- Market Overview
- Market Coverage / Taxonomy
- Market Definition / Scope / Limitations
- Research Methodology
- Chapter Orientation
- Analytical Lens and Working Hypotheses
- Market Structure, Signals, and Trend Drivers
- Benchmarking and Cross-market Comparability
- Market Sizing, Forecasting, and Opportunity Mapping
- Research Design and Evidence Framework
- Desk Research Programme (Secondary Evidence)
- Expert Input and Fieldwork (Primary Evidence)
- Tooling, Models, and Reference Databases
- Data Engineering and Model Build
- Quality Assurance and Audit Trail
- Market Background
- Market Dynamics (Drivers, Restraints, Opportunity, Trends)
- Scenario Forecast (Optimistic, Likely, Conservative)
- Impact Analysis
- AI Impact
- Sustainability Impact
- Regulatory Impact
- Technology Impact
- Consumer / Buyer Analysis
- Purchase Drivers
- Adoption Barriers
- Buyer Journey
- Opportunity Map Analysis
- Product Life Cycle Analysis
- Supply Chain Analysis
- Investment Feasibility Matrix
- Value Chain Analysis
- PESTLE and Porter's Analysis
- Regulatory Landscape
- Regional Parent Market Outlook
- Production and Consumption Statistics
- Import and Export Statistics
- Global Market Analysis and Forecast, 2021 to 2036
- Historical Market Size Value (USD Billion) Analysis, 2021 to 2025
- Current and Future Market Size Value (USD Billion) Projections, 2026 to 2036
- Y-o-Y Growth Trend Analysis
- Absolute $ Opportunity Analysis
- Global Market Pricing Analysis, 2021 to 2036
- Global Market Analysis and Forecast, By Sensor Type, 2021 to 2036
- Introduction / Key Findings
- Historical Market Size Value (USD Billion) Analysis By Sensor Type, 2021 to 2025
- Current and Future Market Size Value (USD Billion) Analysis and Forecast By Sensor Type, 2026 to 2036
- RGB sensors
- True color sensors
- Contrast sensors
- Luminescence sensors
- Spectral color sensors
- Y-o-Y Growth Trend Analysis By Sensor Type, 2021 to 2025
- Absolute $ Opportunity Analysis By Sensor Type, 2026 to 2036
- Global Market Analysis and Forecast, By Output, 2021 to 2036
- Introduction / Key Findings
- Historical Market Size Value (USD Billion) Analysis By Output, 2021 to 2025
- Current and Future Market Size Value (USD Billion) Analysis and Forecast By Output, 2026 to 2036
- Digital
- Analog
- IO-Link
- Industrial Ethernet
- Embedded I2C - SPI
- Y-o-Y Growth Trend Analysis By Output, 2021 to 2025
- Absolute $ Opportunity Analysis By Output, 2026 to 2036
- Global Market Analysis and Forecast, By Application, 2021 to 2036
- Introduction / Key Findings
- Historical Market Size Value (USD Billion) Analysis By Application, 2021 to 2025
- Current and Future Market Size Value (USD Billion) Analysis and Forecast By Application, 2026 to 2036
- Packaging inspection
- Textile - printing
- Automotive paint
- Electronics assembly
- Food sorting
- Y-o-Y Growth Trend Analysis By Application, 2021 to 2025
- Absolute $ Opportunity Analysis By Application, 2026 to 2036
- Global Market Analysis and Forecast, By End Use, 2021 to 2036
- Introduction / Key Findings
- Historical Market Size Value (USD Billion) Analysis By End Use, 2021 to 2025
- Current and Future Market Size Value (USD Billion) Analysis and Forecast By End Use, 2026 to 2036
- Factory automation
- Consumer electronics
- Automotive
- Food & beverage
- Medical devices
- Y-o-Y Growth Trend Analysis By End Use, 2021 to 2025
- Absolute $ Opportunity Analysis By End Use, 2026 to 2036
- Global Market Analysis and Forecast, By Sales Channel, 2021 to 2036
- Introduction / Key Findings
- Historical Market Size Value (USD Billion) Analysis By Sales Channel, 2021 to 2025
- Current and Future Market Size Value (USD Billion) Analysis and Forecast By Sales Channel, 2026 to 2036
- Automation distributors
- Direct sensor OEM
- Embedded component channel
- System integrators
- Y-o-Y Growth Trend Analysis By Sales Channel, 2021 to 2025
- Absolute $ Opportunity Analysis By Sales Channel, 2026 to 2036
- Global Market Analysis and Forecast, By Region, 2021 to 2036
- Introduction
- Historical Market Size Value (USD Billion) Analysis By Region, 2021 to 2025
- Current Market Size Value (USD Billion) Analysis and Forecast By Region, 2026 to 2036
- North America
- Latin America
- Western Europe
- Eastern Europe
- East Asia
- South Asia and Pacific
- Middle East and Africa
- Market Attractiveness Analysis By Region
- North America Market Analysis and Forecast, By Country, 2021 to 2036
- Historical Market Size Value (USD Billion) Trend Analysis By Market Taxonomy, 2021 to 2025
- Market Size Value (USD Billion) Forecast By Market Taxonomy, 2026 to 2036
- By Country
- United States
- Canada
- By Sensor Type
- By Output
- By Application
- By End Use
- By Sales Channel
- By Country
- Market Attractiveness Analysis
- By Country
- By Sensor Type
- By Output
- By Application
- By End Use
- By Sales Channel
- Key Takeaways
- Latin America Market Analysis and Forecast, By Country
- Historical Market Size Value (USD Billion) Trend Analysis By Market Taxonomy, 2021 to 2025
- Market Size Value (USD Billion) Forecast By Market Taxonomy, 2026 to 2036
- By Country
- Brazil
- Mexico
- Chile
- Rest of Latin America
- By Sensor Type
- By Output
- By Application
- By End Use
- By Sales Channel
- By Country
- Market Attractiveness Analysis
- By Country
- By Sensor Type
- By Output
- By Application
- By End Use
- By Sales Channel
- Key Takeaways
- Western Europe Market Analysis and Forecast, By Country
- Historical Market Size Value (USD Billion) Trend Analysis By Market Taxonomy, 2021 to 2025
- Market Size Value (USD Billion) Forecast By Market Taxonomy, 2026 to 2036
- By Country
- Germany
- United Kingdom
- Italy
- Spain
- France
- Nordics
- Benelux
- Rest of Western Europe
- By Sensor Type
- By Output
- By Application
- By End Use
- By Sales Channel
- By Country
- Market Attractiveness Analysis
- By Country
- By Sensor Type
- By Output
- By Application
- By End Use
- By Sales Channel
- Key Takeaways
- Eastern Europe Market Analysis and Forecast, By Country
- Historical Market Size Value (USD Billion) Trend Analysis By Market Taxonomy, 2021 to 2025
- Market Size Value (USD Billion) Forecast By Market Taxonomy, 2026 to 2036
- By Country
- Russia
- Poland
- Hungary
- Balkan and Baltic States
- Rest of Eastern Europe
- By Sensor Type
- By Output
- By Application
- By End Use
- By Sales Channel
- By Country
- Market Attractiveness Analysis
- By Country
- By Sensor Type
- By Output
- By Application
- By End Use
- By Sales Channel
- Key Takeaways
- East Asia Market Analysis and Forecast, By Country
- Historical Market Size Value (USD Billion) Trend Analysis By Market Taxonomy, 2021 to 2025
- Market Size Value (USD Billion) Forecast By Market Taxonomy, 2026 to 2036
- By Country
- China
- Japan
- South Korea
- By Sensor Type
- By Output
- By Application
- By End Use
- By Sales Channel
- By Country
- Market Attractiveness Analysis
- By Country
- By Sensor Type
- By Output
- By Application
- By End Use
- By Sales Channel
- Key Takeaways
- South Asia and Pacific Market Analysis and Forecast, By Country
- Historical Market Size Value (USD Billion) Trend Analysis By Market Taxonomy, 2021 to 2025
- Market Size Value (USD Billion) Forecast By Market Taxonomy, 2026 to 2036
- By Country
- India
- ASEAN
- Australia and New Zealand
- Rest of South Asia and Pacific
- By Sensor Type
- By Output
- By Application
- By End Use
- By Sales Channel
- By Country
- Market Attractiveness Analysis
- By Country
- By Sensor Type
- By Output
- By Application
- By End Use
- By Sales Channel
- Key Takeaways
- Middle East and Africa Market Analysis and Forecast, By Country
- Historical Market Size Value (USD Billion) Trend Analysis By Market Taxonomy, 2021 to 2025
- Market Size Value (USD Billion) Forecast By Market Taxonomy, 2026 to 2036
- By Country
- Kingdom of Saudi Arabia
- Other GCC Countries
- Türkiye
- South Africa
- Other African Union Countries
- Rest of Middle East and Africa
- By Sensor Type
- By Output
- By Application
- By End Use
- By Sales Channel
- By Country
- Market Attractiveness Analysis
- By Country
- By Sensor Type
- By Output
- By Application
- By End Use
- By Sales Channel
- Key Takeaways
- Key Countries Market Analysis
- United States
- Pricing Analysis
- Market Share Analysis, 2025
- By Sensor Type
- By Output
- By Application
- By End Use
- By Sales Channel
- Canada
- Pricing Analysis
- Market Share Analysis, 2025
- By Sensor Type
- By Output
- By Application
- By End Use
- By Sales Channel
- Mexico
- Pricing Analysis
- Market Share Analysis, 2025
- By Sensor Type
- By Output
- By Application
- By End Use
- By Sales Channel
- Brazil
- Pricing Analysis
- Market Share Analysis, 2025
- By Sensor Type
- By Output
- By Application
- By End Use
- By Sales Channel
- Chile
- Pricing Analysis
- Market Share Analysis, 2025
- By Sensor Type
- By Output
- By Application
- By End Use
- By Sales Channel
- Germany
- Pricing Analysis
- Market Share Analysis, 2025
- By Sensor Type
- By Output
- By Application
- By End Use
- By Sales Channel
- United Kingdom
- Pricing Analysis
- Market Share Analysis, 2025
- By Sensor Type
- By Output
- By Application
- By End Use
- By Sales Channel
- Italy
- Pricing Analysis
- Market Share Analysis, 2025
- By Sensor Type
- By Output
- By Application
- By End Use
- By Sales Channel
- Spain
- Pricing Analysis
- Market Share Analysis, 2025
- By Sensor Type
- By Output
- By Application
- By End Use
- By Sales Channel
- France
- Pricing Analysis
- Market Share Analysis, 2025
- By Sensor Type
- By Output
- By Application
- By End Use
- By Sales Channel
- India
- Pricing Analysis
- Market Share Analysis, 2025
- By Sensor Type
- By Output
- By Application
- By End Use
- By Sales Channel
- ASEAN
- Pricing Analysis
- Market Share Analysis, 2025
- By Sensor Type
- By Output
- By Application
- By End Use
- By Sales Channel
- Australia and New Zealand
- Pricing Analysis
- Market Share Analysis, 2025
- By Sensor Type
- By Output
- By Application
- By End Use
- By Sales Channel
- China
- Pricing Analysis
- Market Share Analysis, 2025
- By Sensor Type
- By Output
- By Application
- By End Use
- By Sales Channel
- Japan
- Pricing Analysis
- Market Share Analysis, 2025
- By Sensor Type
- By Output
- By Application
- By End Use
- By Sales Channel
- South Korea
- Pricing Analysis
- Market Share Analysis, 2025
- By Sensor Type
- By Output
- By Application
- By End Use
- By Sales Channel
- Russia
- Pricing Analysis
- Market Share Analysis, 2025
- By Sensor Type
- By Output
- By Application
- By End Use
- By Sales Channel
- Poland
- Pricing Analysis
- Market Share Analysis, 2025
- By Sensor Type
- By Output
- By Application
- By End Use
- By Sales Channel
- Hungary
- Pricing Analysis
- Market Share Analysis, 2025
- By Sensor Type
- By Output
- By Application
- By End Use
- By Sales Channel
- Kingdom of Saudi Arabia
- Pricing Analysis
- Market Share Analysis, 2025
- By Sensor Type
- By Output
- By Application
- By End Use
- By Sales Channel
- Türkiye
- Pricing Analysis
- Market Share Analysis, 2025
- By Sensor Type
- By Output
- By Application
- By End Use
- By Sales Channel
- South Africa
- Pricing Analysis
- Market Share Analysis, 2025
- By Sensor Type
- By Output
- By Application
- By End Use
- By Sales Channel
- Taiwan
- Pricing Analysis
- Market Share Analysis, 2025
- By Sensor Type
- By Output
- By Application
- By End Use
- By Sales Channel
- United States
- Market Structure Analysis
- Competition Dashboard
- Competition Benchmarking
- Market Share Analysis of Top Players
- By Regional
- By Sensor Type
- By Output
- By Application
- By End Use
- By Sales Channel
- Emerging Startups
- Innovation Benchmarking
- Competition Analysis
- Competition Deep Dive
- SICK
- Overview
- Product Portfolio
- Profitability by Market Segments
- Sales Footprint
- Strategy Overview
- Marketing Strategy
- Product Strategy
- Channel Strategy
- Keyence
- Banner Engineering
- Omron
- Pepperl+Fuchs
- ams OSRAM
- Hamamatsu Photonics
- Balluff
- Rockwell Automation
- Baumer
- SICK
- Case Studies
- Success Stories
- Recent Developments
- Competition Deep Dive
- Assumptions & Acronyms Used


