

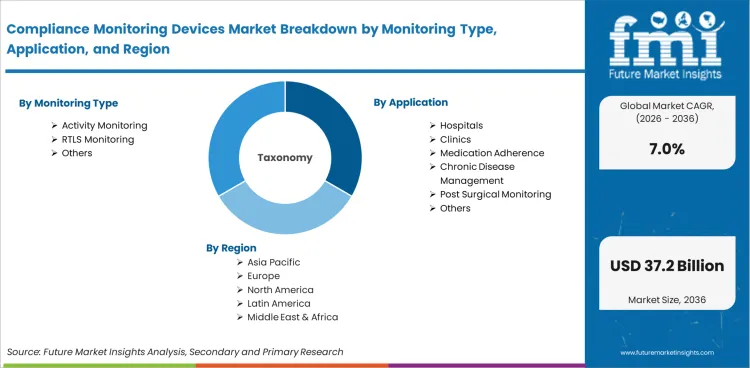
- Market Size (2026)
- USD 18.9 Bn
- Forecast (2036)
- USD 37.2 Bn
- CAGR (2026 to 2036)
- 7.0%
Compliance Monitoring Devices Market Size, Market Forecast and Outlook By FMI
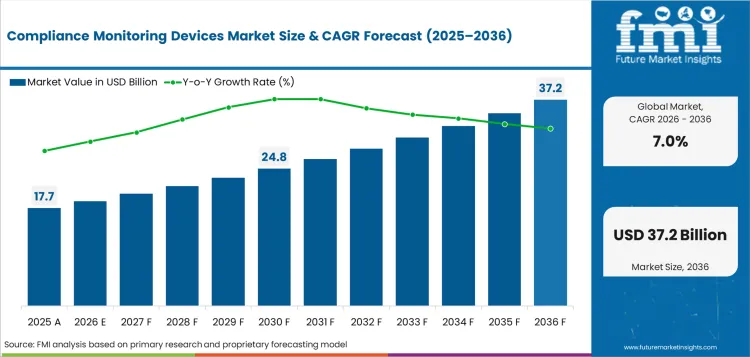
The compliance monitoring devices market was valued at USD 17.7 billion in 2025. The market is set to reach USD 18.9 billion by 2026-end and grow at a CAGR of 7.0% between 2026-2036 to reach USD 37.2 billion by 2036. Activity Monitoring will dominate with a 52.6% share, while Hospitals will lead with a 64.3% share.
Summary of the Compliance Monitoring Devices Market
- Demand and Growth Drivers
- Increasing prevalence of chronic diseases such as diabetes, cardiovascular disease and COPD is increasing the patient population that necessitates continuous compliance monitoring for medication adherence and post-surgical recovery monitoring.
- Pressure from healthcare payers on hospital readmission penalties is driving the adoption of remote compliance monitoring that identifies non-adherence and early decline before expensive emergency department visits.
- Advances in wearable sensor technology allow for continuous monitoring of activity, vital signs, and medication adherence at price points that are affordable for population-based chronic disease.
- Product and Segment View
- Activity monitoring segment accounts for 52.6% of activity monitoring in 2026, with continuous patient compliance data provided by wearable accelerometers, motion sensors, and physiological monitoring.
- The application segment is dominated by hospitals at 64.3%, with highest utilization of devices for inpatient compliance monitoring, discharge follow-up and outpatient chronic disease management.
- Medication compliance devices are the largest product segment and include smart pill dispensers, ingestible sensors and blister pack monitoring that monitor medication adherence in clinical and home environments.
- Geography and Competitive Outlook
- South Korea has a CAGR of 7.4% and is driven by the integration of digital health with the national health insurance, an aging population demographic, and government investment in digital healthcare infrastructure.
- European Union at 7.0% reflects EU digital health regulation framework, chronic disease management programs and healthcare system cost containment driving adoption of compliance monitoring.
- SCRAM Systems is the market share leader with 23.0% through alcohol monitoring technology, court-mandated compliance programs and existing judicial system partnerships.
- Analyst Opinion
- The compliance monitoring devices market spans healthcare medication adherence, substance use monitoring, and post-surgical recovery tracking, with healthcare applications representing the fastest-growing segment as chronic disease management shifts from episodic visits to continuous remote monitoring.
- Growth at 7.0% CAGR reflects aging populations, chronic disease burden, and healthcare cost pressure that together create economic justification for compliance monitoring investment.
- SCRAM Systems maintains the leading position through court-mandated continuous alcohol monitoring technology and established contracts with over 4,600 justice agencies across North America.
- Companies offering integrated medication adherence platforms combining smart dispensing, patient engagement, and clinician dashboards create higher retention than single-device solutions.
- Capital allocation toward AI-powered non-compliance prediction, wearable integration, and chronic disease management platforms is expected to shape competitive positioning through 2036.
Key Takeaways, Market Size, and Forecast
- The compliance monitoring devices market was worth USD 17.67 billion in 2025.
- The Compliance Monitoring Devices Market is projected to reach USD 37.19 billion by 2036.
- The market is expected to grow at a CAGR of 7.0% during the forecast period 2026-2036.
- The market is expected to generate an incremental opportunity of USD 18.29 billion during 2026-2036.
- In 2026, activity monitoring is projected to account for 52.6% of the monitoring type segment, driven by the adoption of wearable sensors to monitor medication adherence and manage chronic diseases in hospital and home care settings.
- South Korea (7.4%) and the European Union (7.0%) are among the fastest growing markets in the world.
Compliance Monitoring Devices Market Definition
The compliance monitoring devices market includes devices and systems that monitor, measure and report compliance to prescribed medical treatment, substance use limitations or post-surgical recovery protocols. The products are used in health care facilities, home care, judicial systems and pharmaceutical companies.
Compliance Monitoring Devices Market Inclusions
Market scope includes medication compliance devices, wearable compliance devices, remote monitoring devices, and diagnostic compliance devices. The revenue is tracked by monitoring type, application, product, technology, and end use from 2026 to 2036.
Compliance Monitoring Devices Market Exclusions
It does not include general fitness wearables without clinical compliance functionality, standard hospital patient monitoring systems without adherence tracking, and electronic health record software without device integration.
Compliance Monitoring Devices Market Research Methodology
- Primary Research: FMI analysts interviewed hospital compliance officers, remote patient monitoring providers, substance use monitoring companies and device manufacturers.
- Desk Research: Compiled healthcare compliance measures, remote monitoring adoption polls, judicial monitoring program data, and financial disclosures from manufacturers.
- Market Sizing and Forecasting: Bottom-up aggregation of patient populations for chronic diseases, rates of non-adherence to medication, enrollment in judicial monitoring programs, and average device prices.
- Data validation: Quarterly validation against healthcare utilization data, remote monitoring enrollment figures and manufacturer revenue disclosures.
Why is the Compliance Monitoring Devices Market Growing?
- Non-adherence to medication in 50% of chronic disease patients costs healthcare systems over USD 500 billion annually in preventable hospitalizations, providing an economic rationale for investment in compliance monitoring.
- South Korea is leading with 7.4% CAGR, driven by NHIS (National Health Insurance Service) digital health integration mandates and aging demographics, with more than 18% of the population aged 65 plus creating structured monitoring demand.
- In addition to the traditional pill count and refill-based adherence measurement, real-time verification of medication ingestion is feasible with technology such as ingestible sensors (Proteus-type) and smart blister pack monitoring.
Healthcare systems, pharmaceutical companies and judicial agencies are investing in technology to ensure compliance with prescribed behavior. Compliance monitoring devices market is growing. Medication non-adherence in healthcare is responsible for 10-25% of hospital readmissions and costs healthcare systems over USD 500 billion annually in the USA alone. Objective adherence data are provided by smart pill dispensers, ingestible sensors and wearable monitoring devices and enable targeted intervention before clinical deterioration occurs.
Substance use compliance monitoring is utilized for judicial and rehabilitation programs that require ongoing verification of alcohol and drug abstinence. SCRAM Systems’ continuous alcohol monitoring bracelets and BI Incorporated location monitoring help court-mandated compliance programs. The intersection of healthcare and judicial compliance forms a varied marketplace with different requirements from buyers. The market is projected to expand at a CAGR of 7.0% between 2026 and 2036.
Market Segmentation Analysis
- Monitoring type . Activity monitoring accounts for 52.6%. Wearable sensors monitor patient’s movements, medication intake time, and physiological compliance indicators.
- Hospitals account for 64.3% of the application, including inpatient monitoring, discharge follow-up, and chronic disease outpatient management programs.
- The leading product segment is medication compliance devices, including smart dispensers, ingestible sensors and electronic blister packs.
The compliance monitoring devices market is segmented into monitoring type application product technology and end use. Each dimension has different clinical, judicial and pharmaceutical compliance requirements.
Insights into the Activity Monitoring Segment
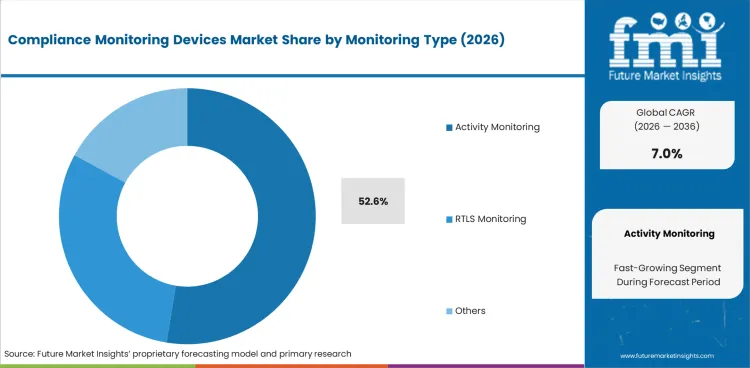
Monitoring of activities is expected to account for 52.6% of the monitoring type segment by 2026. Activity levels of patients are tracked relative to prescribed recovery or exercise protocols using wearable accelerometers and motion sensors. Monitoring after surgery confirms that ambulation is occurring and the risk of venous thromboembolism is reduced. Then chronic disease activity monitoring. Physical activity adherence for cardiac rehabilitation and diabetes management.
The rest is covered by RTLS (Real-Time Location System) monitoring and other types of monitoring. RTLS tracking for psychiatric and judicial patient location compliance. Continuous biochemical compliance verification is provided by substance use monitoring devices.
Insights into the Hospital Application Segment
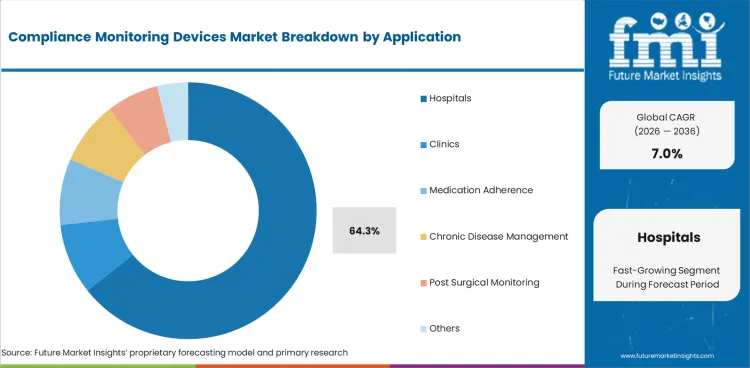
In 2026, the applications from hospitals are 64.3%. Inpatient medication compliance monitoring ensures timely administration and documentation of adherence for clinical audit. Monitoring compliance with discharge reduces 30-day readmission rates by monitoring medication intake, activity levels, and compliance with vital signs. It employs remote monitoring devices in outpatient programs for chronic disease management in diabetes, heart failure and COPD.
The rest is from clinics, home care, pharmaceutical companies and research organizations. Enables home care remote monitoring aging-in-place compliance. Pharmaceutical Clinical Trial compliance monitoring is a check of protocol compliance.
Compliance Monitoring Devices Market Drivers, Restraints, and Opportunities
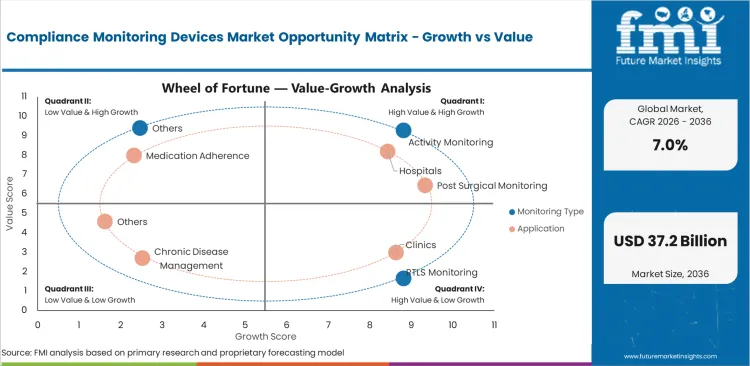
- The rising incidence of chronic disease and the costs associated with medication non-adherence provide a healthcare economic rationale for investing in compliance monitoring.
- Patient privacy concerns and data security requirements create friction for adoption, with HIPAA, GDPR and national health data regulations governing how device data must be handled to remain compliant.
- AI-powered predictive analytics enable early non-compliance detection that allows for clinician intervention before clinical deterioration or medication gaps lead to adverse events.
The compliance monitoring devices market is driven by the burden of chronic diseases, pressure on healthcare costs and advancement in technology. The increasing clinical and institutional adoption is reflected by expansion at a CAGR of 7.0% during 2026-2036.
Healthcare Cost Pressure
Demand reflects healthcare payer focus on reducing avoidable costs. Medicare Hospital Readmissions Reduction Program penalties, UK NHS quality incentive payments, and South Korean NHIS chronic disease management programs create financial incentives for compliance monitoring that prevents costly readmissions.
Data Privacy and Security
Adoption is moderated by regulatory requirements governing patient compliance data. HIPAA in the USA, GDPR in the EU, and PIPA in South Korea establish data protection frameworks that compliance device manufacturers must navigate for data collection, storage, and sharing.
AI-Powered Compliance Prediction
Machine learning algorithms analyzing compliance device data predict non-adherence patterns before clinical deterioration. Predictive models identify patients at risk of medication gaps, missed appointments, or activity non-compliance, enabling proactive clinician intervention.
Judicial Monitoring Program Expansion
Court-mandated substance use monitoring programs are expanding as alternatives to incarceration. Electronic monitoring, continuous alcohol sensing, and location tracking serve probation, parole, and pretrial diversion programs across North America and Europe.
Analysis of Compliance Monitoring Devices Market By Key Countries
.webp "Top Country Growth Comparison Compliance Monitoring Devices Market Cagr (2026 2036)")
| Country | CAGR |
|---|---|
| South Korea | 7.4% |
| European Union | 7% |
| USA | 6.9% |
| UK | 6.8% |
| Japan | 6.6% |
Source: FMI analysis based on primary research and proprietary forecasting model
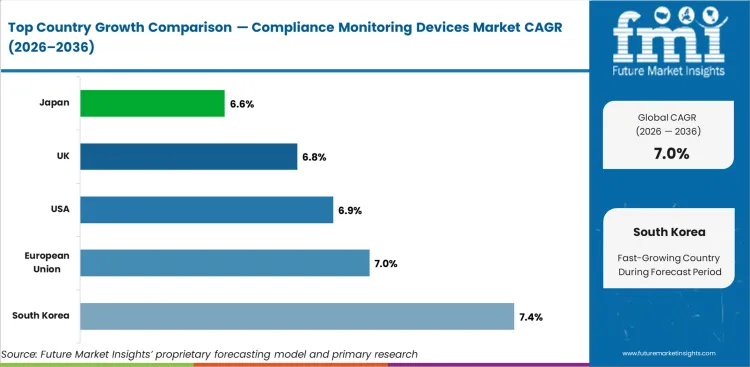
- South Korea at 7.4% CAGR reflects NHIS digital health integration and aging population demographics driving compliance monitoring adoption.
- The European Union at 7.0% is driven by EU digital health regulation, chronic disease management programs, and healthcare cost containment.
- The USA at 6.9% is supported by Medicare readmission penalties, judicial monitoring programs, and remote patient monitoring reimbursement expansion.
- The UK at 6.8% reflects NHS digital health strategy and post-discharge compliance monitoring investment.
The global compliance monitoring devices market is estimated at USD 18.91 billion in 2026 and is projected to expand at 7.0% CAGR from 2026 to 2036. The analysis covers key markets.
Demand Outlook for Compliance Monitoring Devices Market in South Korea
South Korea is projected to expand at 7.4% CAGR through 2036. NHIS digital health integration supports remote compliance monitoring reimbursement for chronic disease management. With over 18% of the population aged 65 plus, medication adherence monitoring for multi-morbid elderly patients creates high-volume demand across hospital and home care settings.
- NHIS digital health coverage expansion includes reimbursement for remote compliance monitoring devices used in chronic disease management programs for diabetes, hypertension, and heart failure.
- Samsung Medical Center, Asan Medical Center, and Seoul National University Hospital deploy compliance monitoring for post-discharge medication adherence and chronic disease outpatient programs.
- Korean digital health companies including Vuno and Lunit integrate AI-powered compliance analytics with wearable monitoring platforms for chronic disease patient management.
Future Outlook for Compliance Monitoring Devices Market in the European Union
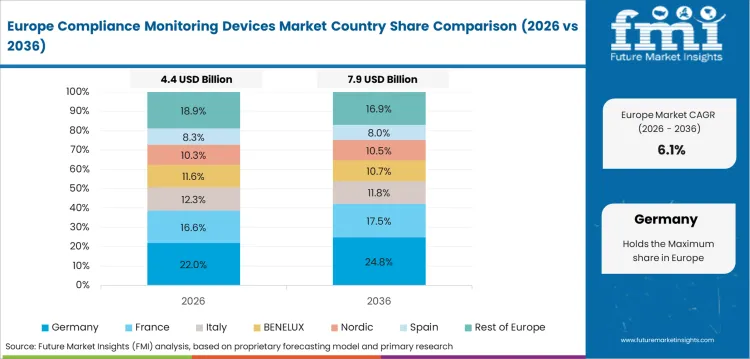
The European Union is projected to grow at 7.0% CAGR through 2036. EU Digital Health Regulation and European Health Data Space framework support cross-border compliance monitoring data interoperability. Chronic disease management programs across Germany, France, and Netherlands create structured monitoring demand.
- European Health Data Space framework establishes data sharing standards that enable compliance monitoring device data integration across EU healthcare systems.
- German Disease Management Programs (DMPs) for diabetes, COPD, and coronary heart disease create structured compliance monitoring demand across statutory health insurance providers.
- Philips Healthcare and Siemens Healthineers remote monitoring platforms integrate compliance device data with clinical decision support for European hospital and home care customers.
Opportunity Analysis of Compliance Monitoring Devices Market in the USA
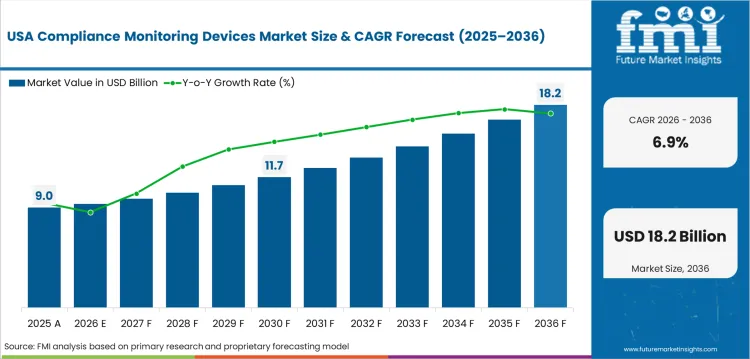
The USA is projected to expand at 6.9% CAGR through 2036. Medicare Hospital Readmissions Reduction Program penalties, CMS Remote Patient Monitoring reimbursement codes (CPT 99453 to 99458), and judicial alcohol/location monitoring programs create dual healthcare and justice system demand.
- CMS Remote Patient Monitoring CPT codes (99453, 99454, 99457, 99458) provide reimbursement for compliance monitoring device deployment and data review, creating healthcare provider revenue models.
- SCRAM Systems and BI Incorporated serve over 4,600 US judicial agencies with continuous alcohol monitoring and electronic location tracking for court-mandated compliance programs.
- Abbott Laboratories and Medtronic remote monitoring platforms integrate medication adherence and physiological compliance data for chronic disease management across US healthcare networks.
In-depth Analysis of Compliance Monitoring Devices Market in the UK
The UK is projected to grow at 6.8% CAGR through 2036. NHS Long Term Plan digital health strategy supports remote monitoring investment for chronic disease management and post-discharge compliance. HM Prison and Probation Service electronic monitoring programs create judicial compliance demand.
- NHS Long Term Plan remote monitoring investment includes compliance devices for heart failure, COPD, and diabetes patient management across Integrated Care Systems.
- HM Prison and Probation Service electronic monitoring using GPS tagging and alcohol monitoring serves probation and release compliance programs across England and Wales.
- NHS Accelerated Access Collaborative supports adoption of compliance monitoring technologies through health technology assessment and implementation frameworks.
Sales Analysis of Compliance Monitoring Devices Market in Japan
Japan is projected to grow at 6.6% CAGR through 2036. The world's most aged population with 30% over 65 creates structural medication adherence monitoring demand. Ministry of Health digital healthcare infrastructure investment supports remote compliance monitoring at hospitals and long-term care facilities.
- Japanese aging demographics with 30% population over 65 create the highest per-capita medication adherence monitoring demand globally for multi-morbid elderly patients.
- Ministry of Health, Labour and Welfare digital healthcare programs support remote monitoring technology adoption at hospitals and long-term care insurance facilities.
- Omron Healthcare and Terumo compliance monitoring devices serve Japanese healthcare providers through medical device distribution channels and hospital procurement programs.
Competitive Landscape and Strategic Positioning
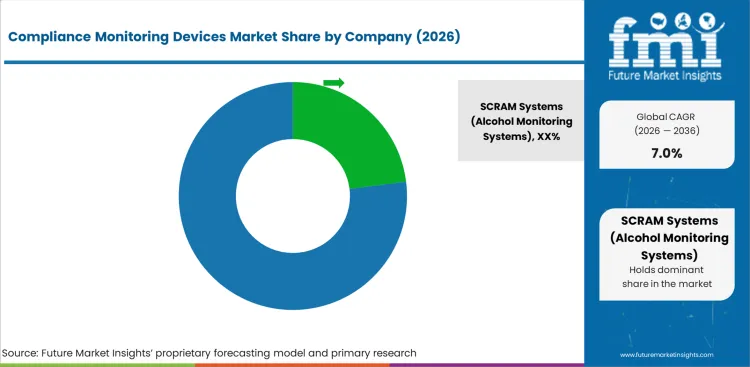
- SCRAM Systems leads the way with 23.0% market share in continuous alcohol monitoring technology and established judicial system partnerships across North America.
- Abbott Laboratories and BI Incorporated (GEO Group) compete with portfolios of electronic monitoring and healthcare compliance devices respectively.
- The competitive landscape includes judicial monitoring specialists, medical device companies, and digital health platform providers.
SCRAM Systems sustains the leader position through continued alcohol monitoring (CAM) bracelet technology deployed to more than 4,600 judicial agencies. Transdermal alcohol detection with tamper-proof design offers court-admissible compliance data. Cross-market positioning grows in healthcare alcohol monitoring.
GEO Group (BI Incorporated) Provides electronic monitoring for pre-trial, probation and immigration compliance. Remote physiological monitoring helps Abbott Laboratories with healthcare compliance. Soberlink provides facial recognition validated mobile breath alcohol testing.
Barriers to entry are: judicial agency contract development, healthcare regulatory (FDA, CE) compliance, clinical validation, and integration with existing healthcare IT systems. AI compliance prediction, wearables integration and working with healthcare payers are top priorities.
Key Companies in the Compliance Monitoring Devices Market
Key global companies leading the compliance monitoring devices market include:
- SCRAM Systems (USA), BI Incorporated/GEO Group (USA), and Track Group (USA) hold leading positions in judicial compliance monitoring through electronic monitoring technology and government agency contracts.
- Abbott Laboratories (USA), Soberlink Healthcare (USA), and Sandata Technologies (USA) maintain positions through healthcare compliance monitoring devices and patient management platforms.
- Lifeloc Technologies (USA), Smart Start (USA), and Geotab (Canada) serve specialized compliance segments including breath testing, ignition interlock, and fleet compliance monitoring.
Competitive Benchmarking: Compliance Monitoring Devices Market
| Company | Judicial Monitoring | Healthcare Compliance | AI/Analytics | Geographic Reach |
|---|---|---|---|---|
| SCRAM Systems | Leading (CAM) | Expanding | Moderate | North America |
| BI Incorporated | Strong (GPS/RF) | Limited | Moderate | North America, Global |
| Abbott Laboratories | None | Strong | Advanced | Global |
| Soberlink Healthcare | Moderate | Moderate | Moderate | North America |
| Track Group | Strong | Limited | Moderate | Americas, Global |
| Intoximeters | Moderate | Limited | Limited | Americas |
| Smart Start | Moderate (Interlock) | None | Limited | North America |
| Sandata Technologies | None | Strong (HC) | Moderate | North America |
| Geotab | Fleet Compliance | None | Advanced | Global |
Source: Future Market Insights competitive analysis, 2026.
Key Developments in Compliance Monitoring Devices Market
- In 2025, SCRAM Systems launched a next-generation continuous alcohol monitoring bracelet with enhanced transdermal sensing accuracy and Bluetooth connectivity for real-time data transmission to supervising agencies.
- In 2025, Abbott Laboratories expanded its remote patient monitoring platform with medication compliance tracking integration, combining physiological monitoring with adherence analytics for chronic disease management.
- In 2026, BI Incorporated announced a hybrid GPS and biometric monitoring device combining location tracking with substance use detection for comprehensive court-mandated compliance programs.
Key Players in the Compliance Monitoring Devices Market
Major Global Players
- SCRAM Systems (Alcohol Monitoring Systems)
- BI Incorporated (GEO Group)
- Abbott Laboratories ( Alere Toxicology)
- Soberlink Healthcare LLC
- Track Group, Inc.
- Intoximeters, Inc.
Emerging Players/Startups
- Proteus Digital Health
- AdhereTech
- Medisafe
- Pillsy (now Everly Health)
- WellDoc Inc.
Report Scope and Coverage
| Parameter | Details |
|---|---|
| Quantitative Units | USD 18.91 billion to USD 37.19 billion, at a CAGR of 7.0% |
| Market Definition | The compliance monitoring devices market includes devices tracking adherence to medical treatments, substance use restrictions, and recovery protocols for healthcare, judicial, and pharmaceutical applications. |
| Regions Covered | North America, Latin America, Europe, East Asia, South Asia and Pacific, Middle East and Africa |
| Countries Covered | South Korea, European Union, USA, UK, Japan, 30 plus countries |
| Key Companies Profiled | SCRAM Systems (Alcohol Monitoring Systems), BI Incorporated (GEO Group), Abbott Laboratories ( Alere Toxicology), Soberlink Healthcare LLC, Track Group, Inc., Intoximeters, Inc., Sentinel Offender Services, Smart Start Inc., Lifeloc Technologies, Inc., Sandata Technologies (Healthcare compliance), Geotab Inc. (Fleet compliance), Veritone, Inc. (AI compliance monitoring), Axon Enterprise, Inc. (Body-worn law enforcement devices) |
| Forecast Period | 2026 to 2036 |
| Approach | Hybrid bottom-up methodology using chronic disease patient populations, judicial monitoring enrollments, and device pricing, triangulated with manufacturer revenue and healthcare utilization data. |
Segmentation
Compliance Monitoring Devices Market Segmented by Monitoring Type:
- Activity Monitoring
- RTLS Monitoring
- Others
Compliance Monitoring Devices Market Segmented by Application:
- Hospitals
- Clinics
- Medication Adherence
- Chronic Disease Management
- Post Surgical Monitoring
- Others
Compliance Monitoring Devices Market Segmented by Product:
- Medication Compliance Devices
- Smart Pill Dispensers
- Electronic Medication Packaging
- Wearable Compliance Devices
- Smart Wearables
- Adherence Tracking Devices
- Remote Monitoring Devices
- Home Monitoring Systems
- Connected Health Devices
- Diagnostic Compliance Devices
- Therapy Monitoring Systems
- Treatment Adherence Devices
Compliance Monitoring Devices Market Segmented by Technology:
- Monitoring Technology
- Real Time Monitoring
- Continuous Tracking
- Connectivity Technology
- Internet of Things
- Cloud Based Platforms
- Data Analytics
- Predictive Analytics
- Behavioral Analysis
- Artificial Intelligence
- Adherence Prediction
- Alert Systems
Compliance Monitoring Devices Market Segmented by End Use:
- Hospitals
- Home Care Settings
- Pharmaceutical Companies
- Research Organizations
Compliance Monitoring Devices Market by Region:
- North America
- USA
- Canada
- Mexico
- Latin America
- Brazil
- Chile
- Rest of Latin America
- Western Europe
- Germany
- UK
- Italy
- Spain
- France
- Nordic
- BENELUX
- Rest of Western Europe
- Eastern Europe
- Russia
- Poland
- Hungary
- Balkan & Baltic
- Rest of Eastern Europe
- East Asia
- China
- Japan
- South Korea
- South Asia and Pacific
- India
- ASEAN
- Australia & New Zealand
- Rest of South Asia and Pacific
- Middle East & Africa
- Kingdom of Saudi Arabia
- Other GCC Countries
- Turkiye
- South Africa
- Other African Union
- Rest of Middle East & Africa
Research Sources and Bibliography
- 1. World Health Organization. (2025). WHO Adherence to Long-Term Therapies Report. WHO.
- 2. Centers for Medicare and Medicaid Services. (2025). CMS Remote Patient Monitoring Reimbursement Data. CMS.
- 3. European Commission. (2025). EC Digital Health and European Health Data Space Reports. EC.
- 4. Organisation for Economic Co-operation and Development. (2025). OECD Health Statistics and Chronic Disease Management Data. OECD.
- 5. World Bank. (2025). World Bank Health Expenditure Data. World Bank.
This bibliography is provided for reader reference. The full Future Market Insights report contains the complete reference list with publication dates, URLs, and supporting data for all cited works.
This Report Answers
- Estimating the size of the compliance monitoring devices market and revenue projections from 2026 to 2036.
- Segmentation by monitoring type, application, product, technology, and end use.
- Insights across key regional markets.
- Analysis of healthcare versus judicial compliance demand dynamics.
- Assessment of the competitive landscape across monitoring specialists and healthcare device companies.
- Identification of investment opportunities in AI compliance prediction, wearable integration, and chronic disease management.
- Medication adherence and compliance program tracking.
- Delivery of data in PDF and Excel formats.
Frequently Asked Questions
What is the global market demand for Compliance Monitoring Devices in 2026?
In 2026, the global compliance monitoring devices market is estimated at USD 18.91 billion.
How big will the Compliance Monitoring Devices Market be in 2036?
By 2036, the market is projected to reach USD 37.19 billion.
How much is demand for the Compliance Monitoring Devices Market expected to grow between 2026 and 2036?
Between 2026 and 2036, the market is projected to expand at a CAGR of 7.0%.
Which monitoring type is expected to lead in 2026?
Activity monitoring is expected to hold 52.6% in 2026, with wearable sensors tracking medication adherence and patient activity compliance.
What is causing demand to rise in South Korea?
South Korea is expected to grow at 7.4% CAGR through 2036, driven by NHIS digital health integration and aging population demographics.
What is causing demand to rise in the European Union?
The EU is expected to grow at 7.0% CAGR through 2036, supported by EU digital health regulation and chronic disease management programs.
What does this report mean by Compliance Monitoring Devices Market definition?
The market includes devices tracking adherence to medical treatments, substance use restrictions, and recovery protocols for healthcare and judicial applications.
How does FMI make the Compliance Monitoring Devices Market forecast and validate it?
Forecasting uses hybrid methodology with patient populations and monitoring enrollments, validated against manufacturer revenue and healthcare utilization data.
Preview the report firsthand - request a free sample
Get SampleGet the brochure for pricing and purchase details.
Get PDFTable of Content
- Executive Summary
- Global Market Outlook
- Demand-side Trends
- Supply-side Trends
- Technology Roadmap Analysis
- Analysis and Recommendations
- Market Overview
- Market Coverage / Taxonomy
- Market Definition / Scope / Limitations
- Research Methodology
- Chapter Orientation
- Analytical Lens and Working Hypotheses
- Market Structure, Signals, and Trend Drivers
- Benchmarking and Cross-market Comparability
- Market Sizing, Forecasting, and Opportunity Mapping
- Research Design and Evidence Framework
- Desk Research Programme (Secondary Evidence)
- Company Annual and Sustainability Reports
- Peer-reviewed Journals and Academic Literature
- Corporate Websites, Product Literature, and Technical Notes
- Earnings Decks and Investor Briefings
- Statutory Filings and Regulatory Disclosures
- Technical White Papers and Standards Notes
- Trade Journals, Industry Magazines, and Analyst Briefs
- Conference Proceedings, Webinars, and Seminar Materials
- Government Statistics Portals and Public Data Releases
- Press Releases and Reputable Media Coverage
- Specialist Newsletters and Curated Briefings
- Sector Databases and Reference Repositories
- FMI Internal Proprietary Databases and Historical Market Datasets
- Subscription Datasets and Paid Sources
- Social Channels, Communities, and Digital Listening Inputs
- Additional Desk Sources
- Expert Input and Fieldwork (Primary Evidence)
- Primary Modes
- Qualitative Interviews and Expert Elicitation
- Quantitative Surveys and Structured Data Capture
- Blended Approach
- Why Primary Evidence is Used
- Field Techniques
- Interviews
- Surveys
- Focus Groups
- Observational and In-context Research
- Social and Community Interactions
- Stakeholder Universe Engaged
- C-suite Leaders
- Board Members
- Presidents and Vice Presidents
- R&D and Innovation Heads
- Technical Specialists
- Domain Subject-matter Experts
- Scientists
- Physicians and Other Healthcare Professionals
- Governance, Ethics, and Data Stewardship
- Research Ethics
- Data Integrity and Handling
- Primary Modes
- Tooling, Models, and Reference Databases
- Desk Research Programme (Secondary Evidence)
- Data Engineering and Model Build
- Data Acquisition and Ingestion
- Cleaning, Normalisation, and Verification
- Synthesis, Triangulation, and Analysis
- Quality Assurance and Audit Trail
- Market Background
- Market Dynamics
- Drivers
- Restraints
- Opportunity
- Trends
- Scenario Forecast
- Demand in Optimistic Scenario
- Demand in Likely Scenario
- Demand in Conservative Scenario
- Opportunity Map Analysis
- Product Life Cycle Analysis
- Supply Chain Analysis
- Investment Feasibility Matrix
- Value Chain Analysis
- PESTLE and Porter’s Analysis
- Regulatory Landscape
- Regional Parent Market Outlook
- Production and Consumption Statistics
- Import and Export Statistics
- Market Dynamics
- Global Market Analysis 2021 to 2025 and Forecast, 2026 to 2036
- Historical Market Size Value (USD Million) Analysis, 2021 to 2025
- Current and Future Market Size Value (USD Million) Projections, 2026 to 2036
- Y-o-Y Growth Trend Analysis
- Absolute $ Opportunity Analysis
- Global Market Pricing Analysis 2021 to 2025 and Forecast 2026 to 2036
- Global Market Analysis 2021 to 2025 and Forecast 2026 to 2036, By Monitoring Type
- Introduction / Key Findings
- Historical Market Size Value (USD Million) Analysis By Monitoring Type , 2021 to 2025
- Current and Future Market Size Value (USD Million) Analysis and Forecast By Monitoring Type , 2026 to 2036
- Activity Monitoring
- RTLS Monitoring
- Others
- Activity Monitoring
- Y-o-Y Growth Trend Analysis By Monitoring Type , 2021 to 2025
- Absolute $ Opportunity Analysis By Monitoring Type , 2026 to 2036
- Global Market Analysis 2021 to 2025 and Forecast 2026 to 2036, By Application
- Introduction / Key Findings
- Historical Market Size Value (USD Million) Analysis By Application, 2021 to 2025
- Current and Future Market Size Value (USD Million) Analysis and Forecast By Application, 2026 to 2036
- Hospitals
- Clinics
- Medication Adherence
- Chronic Disease Management
- Post Surgical Monitoring
- Others
- Hospitals
- Y-o-Y Growth Trend Analysis By Application, 2021 to 2025
- Absolute $ Opportunity Analysis By Application, 2026 to 2036
- Global Market Analysis 2021 to 2025 and Forecast 2026 to 2036, By Product
- Introduction / Key Findings
- Historical Market Size Value (USD Million) Analysis By Product, 2021 to 2025
- Current and Future Market Size Value (USD Million) Analysis and Forecast By Product, 2026 to 2036
- Medication Compliance Devices
- Smart Pill Dispensers
- Electronic Medication Packaging
- Wearable Compliance Devices
- Smart Wearables
- Adherence Tracking Devices
- Remote Monitoring Devices
- Home Monitoring Systems
- Connected Health Devices
- Diagnostic Compliance Devices
- Therapy Monitoring Systems
- Treatment Adherence Devices
- Medication Compliance Devices
- Y-o-Y Growth Trend Analysis By Product, 2021 to 2025
- Absolute $ Opportunity Analysis By Product, 2026 to 2036
- Global Market Analysis 2021 to 2025 and Forecast 2026 to 2036, By Technology
- Introduction / Key Findings
- Historical Market Size Value (USD Million) Analysis By Technology, 2021 to 2025
- Current and Future Market Size Value (USD Million) Analysis and Forecast By Technology, 2026 to 2036
- Monitoring Technology
- Real Time Monitoring
- Continuous Tracking
- Connectivity Technology
- Internet of Things
- Cloud Based Platforms
- Data Analytics
- Predictive Analytics
- Behavioral Analysis
- Artificial Intelligence
- Adherence Prediction
- Alert Systems
- Monitoring Technology
- Y-o-Y Growth Trend Analysis By Technology, 2021 to 2025
- Absolute $ Opportunity Analysis By Technology, 2026 to 2036
- Global Market Analysis 2021 to 2025 and Forecast 2026 to 2036, By End Use
- Introduction / Key Findings
- Historical Market Size Value (USD Million) Analysis By End Use, 2021 to 2025
- Current and Future Market Size Value (USD Million) Analysis and Forecast By End Use, 2026 to 2036
- Hospitals
- Home Care Settings
- Pharmaceutical Companies
- Research Organizations
- Hospitals
- Y-o-Y Growth Trend Analysis By End Use, 2021 to 2025
- Absolute $ Opportunity Analysis By End Use, 2026 to 2036
- Global Market Analysis 2021 to 2025 and Forecast 2026 to 2036, By Region
- Introduction
- Historical Market Size Value (USD Million) Analysis By Region, 2021 to 2025
- Current Market Size Value (USD Million) Analysis and Forecast By Region, 2026 to 2036
- North America
- Latin America
- Western Europe
- Eastern Europe
- East Asia
- South Asia and Pacific
- Middle East & Africa
- Market Attractiveness Analysis By Region
- North America Market Analysis 2021 to 2025 and Forecast 2026 to 2036, By Country
- Historical Market Size Value (USD Million) Trend Analysis By Market Taxonomy, 2021 to 2025
- Market Size Value (USD Million) Forecast By Market Taxonomy, 2026 to 2036
- By Country
- USA
- Canada
- Mexico
- By Monitoring Type
- By Application
- By Product
- By Technology
- By End Use
- By Country
- Market Attractiveness Analysis
- By Country
- By Monitoring Type
- By Application
- By Product
- By Technology
- By End Use
- Key Takeaways
- Latin America Market Analysis 2021 to 2025 and Forecast 2026 to 2036, By Country
- Historical Market Size Value (USD Million) Trend Analysis By Market Taxonomy, 2021 to 2025
- Market Size Value (USD Million) Forecast By Market Taxonomy, 2026 to 2036
- By Country
- Brazil
- Chile
- Rest of Latin America
- By Monitoring Type
- By Application
- By Product
- By Technology
- By End Use
- By Country
- Market Attractiveness Analysis
- By Country
- By Monitoring Type
- By Application
- By Product
- By Technology
- By End Use
- Key Takeaways
- Western Europe Market Analysis 2021 to 2025 and Forecast 2026 to 2036, By Country
- Historical Market Size Value (USD Million) Trend Analysis By Market Taxonomy, 2021 to 2025
- Market Size Value (USD Million) Forecast By Market Taxonomy, 2026 to 2036
- By Country
- Germany
- UK
- Italy
- Spain
- France
- Nordic
- BENELUX
- Rest of Western Europe
- By Monitoring Type
- By Application
- By Product
- By Technology
- By End Use
- By Country
- Market Attractiveness Analysis
- By Country
- By Monitoring Type
- By Application
- By Product
- By Technology
- By End Use
- Key Takeaways
- Eastern Europe Market Analysis 2021 to 2025 and Forecast 2026 to 2036, By Country
- Historical Market Size Value (USD Million) Trend Analysis By Market Taxonomy, 2021 to 2025
- Market Size Value (USD Million) Forecast By Market Taxonomy, 2026 to 2036
- By Country
- Russia
- Poland
- Hungary
- Balkan & Baltic
- Rest of Eastern Europe
- By Monitoring Type
- By Application
- By Product
- By Technology
- By End Use
- By Country
- Market Attractiveness Analysis
- By Country
- By Monitoring Type
- By Application
- By Product
- By Technology
- By End Use
- Key Takeaways
- East Asia Market Analysis 2021 to 2025 and Forecast 2026 to 2036, By Country
- Historical Market Size Value (USD Million) Trend Analysis By Market Taxonomy, 2021 to 2025
- Market Size Value (USD Million) Forecast By Market Taxonomy, 2026 to 2036
- By Country
- China
- Japan
- South Korea
- By Monitoring Type
- By Application
- By Product
- By Technology
- By End Use
- By Country
- Market Attractiveness Analysis
- By Country
- By Monitoring Type
- By Application
- By Product
- By Technology
- By End Use
- Key Takeaways
- South Asia and Pacific Market Analysis 2021 to 2025 and Forecast 2026 to 2036, By Country
- Historical Market Size Value (USD Million) Trend Analysis By Market Taxonomy, 2021 to 2025
- Market Size Value (USD Million) Forecast By Market Taxonomy, 2026 to 2036
- By Country
- India
- ASEAN
- Australia & New Zealand
- Rest of South Asia and Pacific
- By Monitoring Type
- By Application
- By Product
- By Technology
- By End Use
- By Country
- Market Attractiveness Analysis
- By Country
- By Monitoring Type
- By Application
- By Product
- By Technology
- By End Use
- Key Takeaways
- Middle East & Africa Market Analysis 2021 to 2025 and Forecast 2026 to 2036, By Country
- Historical Market Size Value (USD Million) Trend Analysis By Market Taxonomy, 2021 to 2025
- Market Size Value (USD Million) Forecast By Market Taxonomy, 2026 to 2036
- By Country
- Kingdom of Saudi Arabia
- Other GCC Countries
- Turkiye
- South Africa
- Other African Union
- Rest of Middle East & Africa
- By Monitoring Type
- By Application
- By Product
- By Technology
- By End Use
- By Country
- Market Attractiveness Analysis
- By Country
- By Monitoring Type
- By Application
- By Product
- By Technology
- By End Use
- Key Takeaways
- Key Countries Market Analysis
- USA
- Pricing Analysis
- Market Share Analysis, 2025
- By Monitoring Type
- By Application
- By Product
- By Technology
- By End Use
- Canada
- Pricing Analysis
- Market Share Analysis, 2025
- By Monitoring Type
- By Application
- By Product
- By Technology
- By End Use
- Mexico
- Pricing Analysis
- Market Share Analysis, 2025
- By Monitoring Type
- By Application
- By Product
- By Technology
- By End Use
- Brazil
- Pricing Analysis
- Market Share Analysis, 2025
- By Monitoring Type
- By Application
- By Product
- By Technology
- By End Use
- Chile
- Pricing Analysis
- Market Share Analysis, 2025
- By Monitoring Type
- By Application
- By Product
- By Technology
- By End Use
- Germany
- Pricing Analysis
- Market Share Analysis, 2025
- By Monitoring Type
- By Application
- By Product
- By Technology
- By End Use
- UK
- Pricing Analysis
- Market Share Analysis, 2025
- By Monitoring Type
- By Application
- By Product
- By Technology
- By End Use
- Italy
- Pricing Analysis
- Market Share Analysis, 2025
- By Monitoring Type
- By Application
- By Product
- By Technology
- By End Use
- Spain
- Pricing Analysis
- Market Share Analysis, 2025
- By Monitoring Type
- By Application
- By Product
- By Technology
- By End Use
- France
- Pricing Analysis
- Market Share Analysis, 2025
- By Monitoring Type
- By Application
- By Product
- By Technology
- By End Use
- India
- Pricing Analysis
- Market Share Analysis, 2025
- By Monitoring Type
- By Application
- By Product
- By Technology
- By End Use
- ASEAN
- Pricing Analysis
- Market Share Analysis, 2025
- By Monitoring Type
- By Application
- By Product
- By Technology
- By End Use
- Australia & New Zealand
- Pricing Analysis
- Market Share Analysis, 2025
- By Monitoring Type
- By Application
- By Product
- By Technology
- By End Use
- China
- Pricing Analysis
- Market Share Analysis, 2025
- By Monitoring Type
- By Application
- By Product
- By Technology
- By End Use
- Japan
- Pricing Analysis
- Market Share Analysis, 2025
- By Monitoring Type
- By Application
- By Product
- By Technology
- By End Use
- South Korea
- Pricing Analysis
- Market Share Analysis, 2025
- By Monitoring Type
- By Application
- By Product
- By Technology
- By End Use
- Russia
- Pricing Analysis
- Market Share Analysis, 2025
- By Monitoring Type
- By Application
- By Product
- By Technology
- By End Use
- Poland
- Pricing Analysis
- Market Share Analysis, 2025
- By Monitoring Type
- By Application
- By Product
- By Technology
- By End Use
- Hungary
- Pricing Analysis
- Market Share Analysis, 2025
- By Monitoring Type
- By Application
- By Product
- By Technology
- By End Use
- Kingdom of Saudi Arabia
- Pricing Analysis
- Market Share Analysis, 2025
- By Monitoring Type
- By Application
- By Product
- By Technology
- By End Use
- Turkiye
- Pricing Analysis
- Market Share Analysis, 2025
- By Monitoring Type
- By Application
- By Product
- By Technology
- By End Use
- South Africa
- Pricing Analysis
- Market Share Analysis, 2025
- By Monitoring Type
- By Application
- By Product
- By Technology
- By End Use
- USA
- Market Structure Analysis
- Competition Dashboard
- Competition Benchmarking
- Market Share Analysis of Top Players
- By Regional
- By Monitoring Type
- By Application
- By Product
- By Technology
- By End Use
- Competition Analysis
- Competition Deep Dive
- SCRAM Systems (Alcohol Monitoring Systems)
- Overview
- Product Portfolio
- Profitability by Market Segments (Product/Age /Sales Channel/Region)
- Sales Footprint
- Strategy Overview
- Marketing Strategy
- Product Strategy
- Channel Strategy
- BI Incorporated (GEO Group)
- Abbott Laboratories ( Alere Toxicology)
- Soberlink Healthcare LLC
- Track Group, Inc.
- Intoximeters, Inc.
- Sentinel Offender Services
- Smart Start Inc.
- Lifeloc Technologies, Inc.
- Sandata Technologies (Healthcare compliance)
- Geotab Inc. (Fleet compliance)
- Veritone, Inc. (AI compliance monitoring)
- Axon Enterprise, Inc. (Body-worn law enforcement devices)
- SCRAM Systems (Alcohol Monitoring Systems)
- Competition Deep Dive
- Assumptions & Acronyms Used


