

- Market Size (2026)
- USD 860.6 Mn
- Forecast (2036)
- USD 1677.2 Mn
- CAGR (2026 to 2036)
- 6.9%
How big is the Cord Adhesion Coatings Market in 2026?
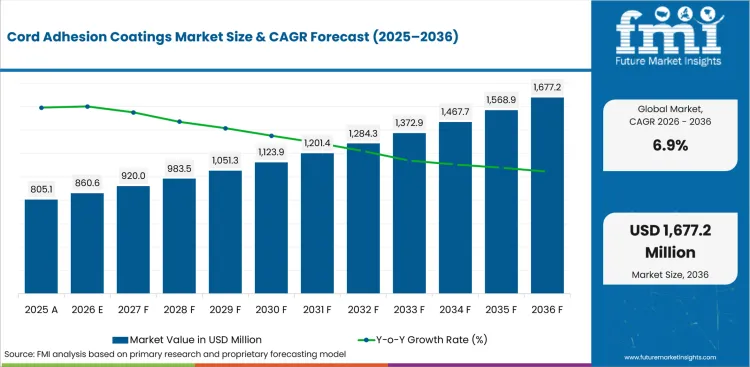
USD 860.6 million in 2026 and USD 1,677.2 million by 2036 at a 6.9% CAGR.
The demand of cord adhesion coatings are estimated to rise at 6.9% CAGR through 2036, increasing valuation from USD 860.6 million in 2026 to USD 1,677.2 million by 2036. Tire plant qualification pressure is expected to drive demand for repeatable cord-to-rubber bonding systems. USTMA projected in December 2025 that total USA tire shipments would reach 337.4 million units in 2025. The shipment base keeps adhesion reliability tied to automotive tire demand and warranty-sensitive release checks for plant teams.
India and China are anticipated to value local line support because automotive production scale increases qualification workload for tire plants. United States, Germany and Japan accounts are expected to stress documentation depth during multi-plant approval and warranty review. Reinforcement converters also test coating fit before textile cord or steel cord programs move into routine supply. In September 2024, H.B. Fuller described CILBOND bonding agents for chemically bonding rubber during molding and casting. The product evidence is shaping sourcing team reviews beside adhesives and sealants demand across industrial rubber accounts.
Cord selection to tire curing creates a value chain in which coating accountability extends past initial approval. In May 2026, Bekaert completed a tire cord business acquisition in China and Thailand. The move links reinforcement access to coating qualification and EV tire specifications across regional tire programs. Established markets are expected to stress documentation depth during multi-plant approval. High-growth markets are anticipated to value local service access during scale-up.
Summary of the Cord Adhesion Coatings Market
| Market Signal | Commercial Impact |
|---|---|
| Demand and Growth Drivers | Purchasing is expected to be driven by tire plant qualification pressure and reinforcement bonding control. Documentation needs are projected to create urgency during OEM approval and compounder scale-up.
|
| Product and Segment View | Direct to OEM, passenger tires, and resorcinol formaldehyde latex are expected to lead their parent categories in 2026. Steel cord and tire manufacturing also remain visible screens for supplier qualification.
|
| Geography and Growth Outlook | India and China are projected to form the higher-growth tier due to vehicle production scale and supplier localization. The United States, Germany, the United Kingdom, and Japan are expected to expand under qualification-led purchasing cycles.
|
| Competitive Landscape | Competition is moderately fragmented around adhesion chemistry, reinforcement access, and technical documentation. Verification screens are expected to center on product proof, line support, and regional service continuity.
|
| Analyst Perspective | Cord adhesion coatings are evaluated inside tire-plant discipline where small process drift can affect release decisions. Buyers need coatings that keep reinforcement bonding stable across curing cycles, material changes and repeat orders.
|
Source: FMI's proprietary forecasting model and primary research
How is the cord adhesion coatings market segmented?
The cord adhesion coatings industry is segmented by chemistry, reinforcement type, application, end use, sales channel, and region.
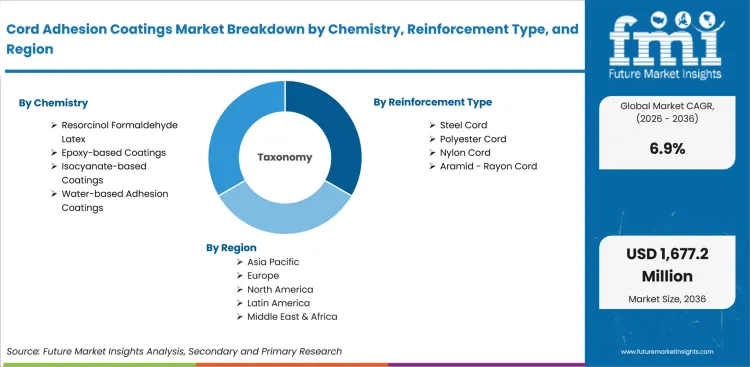
The cord adhesion coatings market is segmented by chemistry, reinforcement type, application, end use, sales channel, and region. By chemistry, the market covers resorcinol formaldehyde latex, epoxy-based coatings, isocyanate-based coatings, and water-based adhesion coatings. By reinforcement type, it covers steel cord, polyester cord, nylon cord, and aramid or rayon cord. By application, it covers passenger tires, truck and bus tires, industrial belts, and hoses or technical rubber. By end use, it covers tire manufacturing, industrial rubber goods, automotive belts, and technical textiles. By sales channel, it covers direct to OEM, chemical distributors, and compounder supply. Regional coverage includes North America, Europe, East Asia, South Asia, and other markets linked to rubber anti-tack agents.
How does direct to OEM shape demand within the sales channel category?
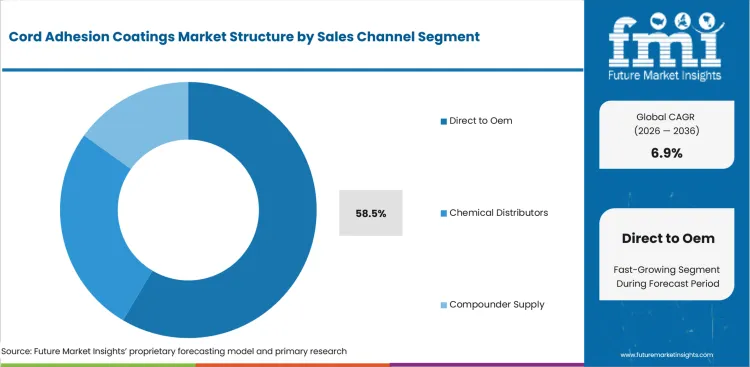
OEM-directed purchasing is tied to approved-material lists and plant-level accountability during tire plant qualification. H.B. Fuller's September 2024 bonding guidance described CILBOND as a rubber-to-substrate bonding agent used in wear-sensitive components. The same qualification logic supports cord adhesion coatings in tire plants. Direct ordering gives technical teams a clearer route for line trials and delivery planning. Corrective action also moves faster if adhesion results drift during production.
- By sales channel, direct to OEM is projected to account for 58.5% share in 2026 due to specification ownership and direct service response. H.B. Fuller's September 2024 guidance stated that CILBOND is applied in micron-level layers for rubber bonding, which supports OEM reviews that need product identity and application records before scale-up.
- Direct to OEM is witnessing demand from tire manufacturers owing to approval control and faster escalation during line trials. Technical teams comparing coating service routes use direct channels to reduce handoff risk between formulation approval and plant service.
What supports demand for passenger tires within the application category?
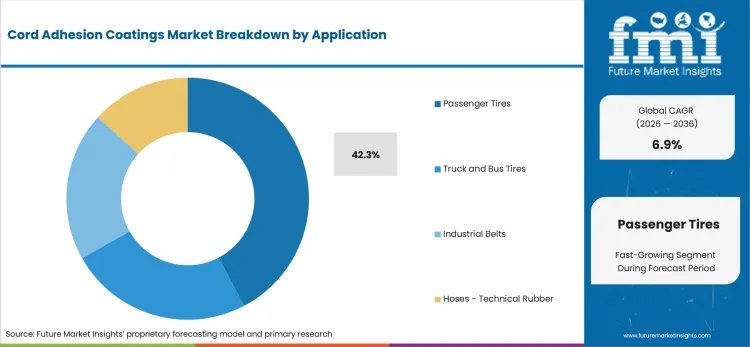
Passenger tire programs place coating performance under frequent production and warranty review across high-volume lines. In December 2025, USTMA projected original equipment passenger tire shipments at 41.6 million units in 2025. The channel creates recurring checks for cord adhesion dips and rubber compatibility during plant release. Tire manufacturers link passenger tire coatings to curing consistency and technical sign-off before broader production orders are approved.
- By application, passenger tires are estimated to hold 42.3% share in 2026 owing to repeated plant runs and warranty-sensitive performance. In December 2025, USTMA projected replacement passenger tire shipments of 221.6 million units in 2025, which keeps passenger platforms close to coating validation and production release decisions.
- Demand for passenger tire applications is expected to grow among tire manufacturers attributable to line frequency and lower tolerance for adhesion drift. Suppliers tied to low rolling-resistance tire development need coating proof that fits compound changes and routine tire construction reviews.
How is resorcinol formaldehyde latex positioned within the chemistry category?
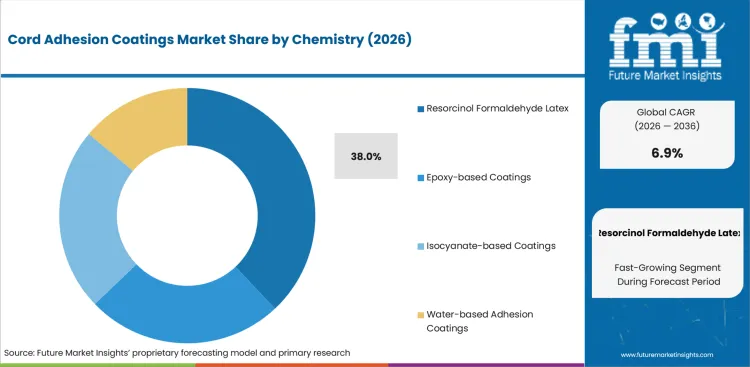
RFL chemistry remains familiar to tire cord plants due to its role in textile cord adhesion systems. In May 2025, PubMed Central published a peer-reviewed article describing RFL dipping as a widely used industrial method for improving adhesion between textile cords and rubber. Chemical formulators keep RFL under review even as alternative systems are tested for safety or handling reasons.
- By chemistry, resorcinol formaldehyde latex is forecast to represent 38.0% share in 2026 driven by proven bonding between textile cords and rubber compounds. The May 2025 PMC article on textile cord adhesion supports the industrial relevance of RFL dips, which keeps specification files central during technical approval.
- RFL systems are drawing attention from compounders shaped by their known process window and established adhesion response. Formulators also compare the chemistry against low PAH tire additives during reformulation work that requires cleaner technical files.
What drives steel cord demand within the reinforcement type category?
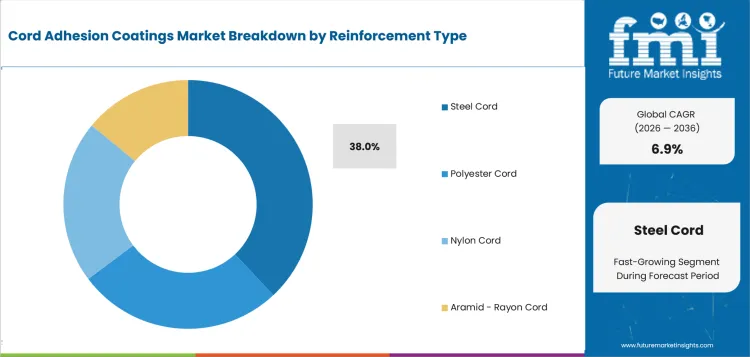
Steel cord adoption is linked to radial tire programs and higher-load reinforcement requirements. In May 2026, Bekaert completed the acquisition of tire reinforcement business from Bridgestone in China and Thailand. The transaction keeps steel cord supply close to regional tire manufacturing and coating qualification. Coating suppliers serving steel cord accounts need compatibility proof across brass plating and rubber compounds during humid-ageing tests.
- By reinforcement type, steel cord is anticipated to lead with 38.0% share in 2026 attributable to high-load tire construction and reinforcement continuity. Bekaert completed a tire cord business acquisition in China and Thailand in May 2026, which raises the value of coating compatibility near major Asian tire plants.
- Steel cord adoption is gaining momentum in radial tire programs supported by load-bearing requirements and localized reinforcement supply. Tire companies using connected tire programs still need conventional cord adhesion reliability before sensors or traceability claims become commercially credible.
How do tire manufacturers evaluate the end use category?
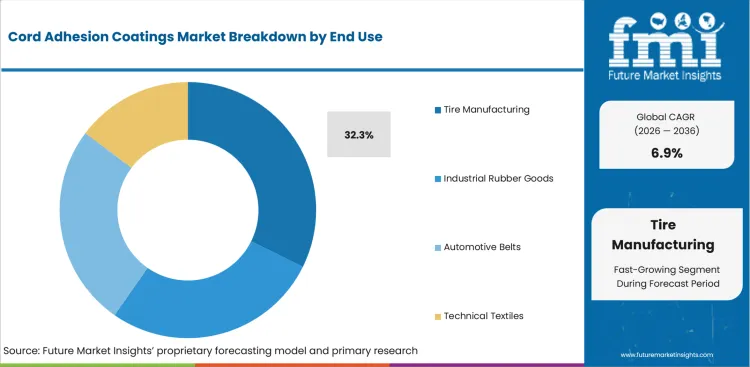
Tire manufacturing creates the strictest coating qualification path due to curing heat and high-volume rejection risk. In April 2026, OICA reported that global vehicle production rose to 96.4 million units in 2025. The production base keeps tire output planning visible for coating suppliers serving passenger and commercial tire lines. Plant teams assess whether a coating keeps cord-rubber bonding stable across recipes and equipment settings.
- By end use, tire manufacturing is set to lead with 32.3% share in 2026 due to recurring qualification routines and high rejection cost. In April 2026, OICA reported Asia-Pacific vehicle production at 59.2 million units in 2025, which supports adhesion coating demand near tire and reinforcement production hubs.
- Purchase activity for tire manufacturing is anticipated to rise driven by plant efforts to control rework and approval risk. Coating suppliers connected to vulcanization accelerator use need to explain cure behavior beside adhesion strength and line compatibility.
What are the drivers, restraints, and opportunities in the Cord Adhesion Coatings Market?
Near-term purchases are being shaped by tire qualification control, chemical handling constraints, and EV tire reformulation routes outlined below.
- Driver: tire manufacturers are expected to purchase coatings that reduce cord-rubber adhesion drift during repeated plant runs.
- Restraint: approval cycles are anticipated to slow adoption where chemical safety files and ageing proof remain incomplete.
- Opportunity: EV tire programs are projected to open account access for coatings that support load and torque-sensitive compounds.
Tire plants are expected to raise interest in coatings that make cord bonding easier to verify before production release. In July 2024, Parker Hannifin stated that its elastomer process materials division uses nearly 100 years of rubber bonding experience. The experience base supports qualification reviews that require product history and plant support. Technical teams are expected to place greater weight on documented adhesion behavior than on spot-price comparison.
Chemical review teams are likely to delay purchase decisions if RFL handling and formaldehyde controls lack clear documentation. In February 2026, ECHA's regulatory needs list remained a reference point for companies tracking REACH and CLP obligations. The reference environment keeps coating formulators focused on exposure controls and substance files during supplier review. Qualification risk remains higher in accounts that require multi-site approval across tire plants and reinforcement suppliers.
EV tire programs are projected to convert the restraint into a reformulation route for coating suppliers. In April 2026, OICA reported new-energy vehicle production in China reached 16.626 million units in 2025. The production base is expected to raise the need for adhesion systems that tolerate higher torque loads. Suppliers that connect coating trials to functional coating materials are expected to receive closer review in EV tire accounts.
Which country CAGRs are profiled in the Cord Adhesion Coatings Market?
.webp "Top Country Growth Comparison Cord Adhesion Coatings Market Cagr (2026 2036)")
| Country | CAGR |
|---|---|
| United States | 5.8% |
| China | 8.0% |
| India | 8.8% |
| Germany | 5.4% |
| United Kingdom | 5.6% |
| Japan | 5.4% |
| South Korea | 6.8% |
| Rest of World | 7.4% |
Source: FMI's proprietary forecasting model and primary research
How do country-level CAGRs compare in the Cord Adhesion Coatings Market?
Country growth is expected to reflect tire production scale and service access across different sourcing systems. India is projected to grow at 8.8% CAGR and China is forecast at 8.0% CAGR due to manufacturing scale. Rest of World is anticipated at 7.4% CAGR due to localized tire capacity. South Korea is predicted to reach 6.8% CAGR due to compact technical networks. The United States and the United Kingdom are expected to expand at 5.8% and 5.6% CAGR. Germany and Japan are projected to advance at 5.4% CAGR under stricter approval cycles.
- United States demand is projected to grow at 5.8% CAGR by 2036, supported by replacement tire scale and service-led supplier screening. In December 2025, USTMA projected light truck replacement shipments of 37.8 million units for 2025. The replacement channel keeps adhesion performance tied to fleet use and warranty-sensitive accounts. Tire manufacturers in Ohio and South Carolina are expected to evaluate coating suppliers on line support and domestic technical response. Suppliers with USA field service and complete safety files are expected to receive stronger consideration in qualified tire accounts.
- Cord adhesion coating demand in China is forecast to rise at 8.0% CAGR over the forecast period, driven by tire output linked to vehicle production scale. In April 2026, OICA reported that China reached 34.53 million vehicles produced in 2025. The scale creates recurring reinforcement and coating needs across passenger and commercial tire plants. Local tire groups and export-oriented manufacturers are expected to screen suppliers on price discipline and batch consistency. Direct service teams are expected to draw attention from procurement groups in coastal tire manufacturing clusters.
- India is estimated to post 8.8% CAGR over the forecast period, owing to domestic vehicle output and formalized component sourcing. In February 2026, India's Ministry of Heavy Industries reported passenger vehicle production of 53.8 lakh units during January to December 2025. The output volume supports tire plant expansion and repeat coating procurement. Local compounders and tire manufacturers still apply cost filters before wider qualification. Suppliers with local inventory and trial support are expected to gain traction where plants require faster approval cycles.
- Germany's cord adhesion coatings sector is projected to record 5.4% CAGR during the assessment period, shaped by EV tire qualification and strict technical review. In August 2025, VDA reported 864,000 electric cars produced in Germany during the first half of 2025. The EV mix raises scrutiny of reinforcement systems used for heavier tire designs. German tire and technical rubber accounts are expected to test suppliers on documentation depth before commercial conversion. Chemical suppliers with transparent safety files are expected to receive stronger consideration in multi-site technical reviews.
- United Kingdom sales are forecast to expand at 5.6% CAGR by 2036, influenced by export-linked tire programs and service accountability. In June 2026, SMMT reported more than 717,000 cars built in the United Kingdom in 2025. The production base keeps tire replacement and specialty vehicle demand visible despite plant restructuring. Imported chemical supply and shorter domestic tire capacity make delivery assurance a procurement filter. Distributors with technical escalation routes are expected to draw attention from accounts that require smaller batch support.
- Japan's outlook is anticipated to advance at 5.4% CAGR over the assessment period, supported by long qualification cycles and exacting tire quality screens. In September 2025, JAMA reported motor vehicle production of 8.23 million units in 2024. The output base supports steady tire and technical rubber demand for approved coating systems. Japanese manufacturers are expected to favor proven suppliers with repeatable specifications and clear ageing data. Suppliers with patient validation support are expected to receive stronger consideration before model-cycle procurement decisions.
- In South Korea, coating demand is predicted to advance at 6.8% CAGR through 2036, reinforced by concentrated tire groups and fast supplier feedback loops. In January 2026, South Korea's Ministry of Trade Industry and Energy reported domestic automobile production of 4.1 million units in 2025. Concentrated production makes qualification wins commercially meaningful for approved chemical suppliers. Tire manufacturers in the country are expected to test coatings on troubleshooting speed and batch stability. Suppliers with fast technical response are expected to gain traction in accounts that require quick plant-level correction.
- Rest of World demand is forecast to expand at 7.4% CAGR by 2036, led by localized tire capacity and import-dependent chemical routes. In April 2026, ACEA reported global car production of 78.7 million units in 2025. The production base supports tire plant investment outside the core profiled markets. Smaller tire plants are expected to rely on distributors for specification translation and supply continuity. Regional channels with application support are expected to draw attention from procurement teams in markets with limited coating formulation capacity.
Who are the notable companies in the Cord Adhesion Coatings Market?
Henkel, H.B. Fuller, Parker LORD, DuPont, LANXESS, Kordsa, Bekaert, Cabot, and Eastman are the notable companies shaping this market.
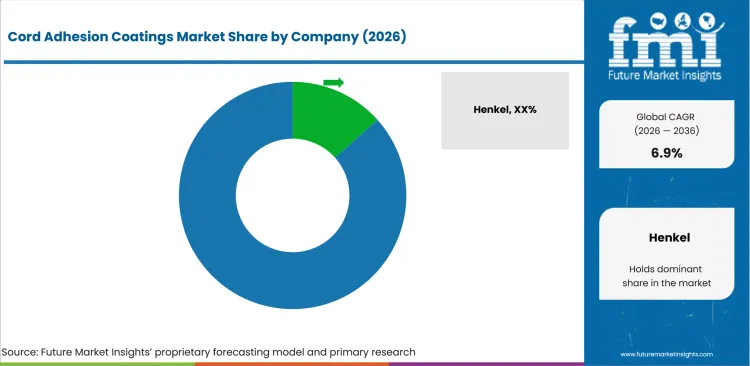
The market is moderately fragmented across adhesive chemistry, reinforcement materials, and specialty chemical inputs. Concentration is controlled by qualification history and access to tire plant technical teams. Multinational suppliers hold broader portfolios and formal documentation systems for approved accounts. Regional specialists compete in narrow application settings where service proximity or cost control carries weight. Competition centers on adhesion proof and regulatory files. The structure is comparable to industrial coating demand where procurement screens balance coating performance and service continuity.
Adhesive technology programs separate suppliers by rubber bonding proof and application support. Henkel, H.B. Fuller, Parker LORD, and DuPont serve accounts that need chemistry depth before changing approved coating systems. Tire manufacturers gain a clearer route for technical review if suppliers provide safety sheets and plant support together.
Specialty chemical input strength creates a second competitive route for coating formulation work. LANXESS, Cabot, and Eastman compete where formulators need resin or additive knowledge for rubber compounds. Their role is commercially useful if coating recipes must align with cure behavior and reinforcement performance.
Reinforcement access gives some companies a closer connection to tire cord specification work. Kordsa and Bekaert support accounts that link textile cord and steel cord to coating qualification. Their portfolios help procurement teams assess whether adhesion chemistry fits the reinforcement selected for a tire platform.
Application data combined with local support is expected to secure repeat account consideration. Parker LORD, H.B. Fuller, Bekaert, and Kordsa have visible roles in that mix. Procurement teams are expected to favor groups that reduce handoffs between coating trials and reinforcement approval.
Competitive Benchmarking: Cord Adhesion Coatings Market
| Company | Bonding Portfolio Fit | Reinforcement Access | Documentation Depth | Service Reach |
|---|---|---|---|---|
| Henkel | High | Medium | High | Global |
| H.B. Fuller | High | Medium | High | Global |
| Parker LORD | High | Medium | High | Global |
| DuPont | Medium | Medium | Strong | Global |
| LANXESS | Medium | Medium | Strong | Global |
| Kordsa | Medium | High | Strong | Global |
| Bekaert | Medium | High | Strong | Global |
| Cabot | Medium | Medium | Medium | Global |
| Eastman | Medium | Medium | Medium | Global |
Source: Future Market Insights competitive analysis, 2026. Ratings reflect relative portfolio relevance and workflow fit. Service capability and geographic reach shape the remaining comparison.
Key Developments in the Cord Adhesion Coatings Market
- In January 2026, Bekaert announced the planned acquisition of Bridgestone tire reinforcement operations in China and Thailand. The announcement covered tire cord production facilities serving regional production networks. The move is expected to intensify review of approved cord systems.
- In March 2026, Kordsa published its 2025 Annual Report covering tire reinforcement and material transition work. The report positioned tire reinforcement as a core business line for automotive and aircraft tire markets.
Key Players in the Cord Adhesion Coatings Market
Adhesive and bonding suppliers
- Henkel
- H.B. Fuller
- Parker LORD
- DuPont
Rubber and reinforcement suppliers
- LANXESS
- Kordsa
- Bekaert
Specialty chemical suppliers
- Cabot
- Eastman
Cord Adhesion Coatings Market - Report Scope
| Coverage field | Report scope |
|---|---|
| Market breakdown | Cord Adhesion Coatings Market Breakdown By Chemistry, Reinforcement Type, Application, End Use, Sales Channel, and Region |
| Quantitative Units | USD 860.6 million in 2026 to USD 1,677.2 million by 2036, at a CAGR of 6.9% |
| Market Definition | Cord adhesion coatings are chemical dip, primer, or bonding systems applied to tire and technical rubber reinforcement cords to improve adhesion between cords and rubber compounds for tire manufacturers and rubber processors. |
| Regions Covered | North America, Latin America, Europe, East Asia, South Asia, Oceania, and Middle East and Africa |
| Countries Covered | United States, China, India, Germany, United Kingdom, Japan, South Korea, and 25+ countries |
| Key Companies Profiled | Henkel, H.B. Fuller, Parker LORD, DuPont, LANXESS, Kordsa, Bekaert, Cabot, and Eastman |
| Forecast Period | 2026 to 2036 |
| Approach | Hybrid bottom-up and top-down methodology using tire output, reinforcement type mix, adhesion chemistry adoption, OEM qualification routes, and country-level vehicle production signals |
Source: Future Market Insights - analysis driven by proprietary forecasting models and primary research
Cord Adhesion Coatings Market - Research Methodology
| Method | Approach |
|---|---|
| Primary Research | FMI analysts reviewed inputs from tire manufacturers, rubber compounders, reinforcement converters, technical procurement teams, and chemical distributors. Interviews focused on adhesion failure risk, RFL replacement pressure, line-trial acceptance, documentation gaps, service ownership, and the practical limits of changing approved coating systems inside tire plants. |
| Desk Research | Desk research covered tire shipment data, vehicle production releases, chemical safety references, company product pages, annual reports, and industry association statistics. Product relevance was checked against cord-to-rubber adhesion, RFL dip use, steel cord compatibility, textile cord treatment, and rubber-to-substrate bonding claims. |
| Market Sizing and Forecasting | Market sizing used a hybrid top-down and bottom-up model. Inputs included global tire and vehicle output, coating use by reinforcement type, chemistry mix, OEM-direct procurement share, and country-level tire manufacturing intensity. Forecast assumptions were adjusted for qualification cycles and local technical-service availability. |
| Data Validation | Forecasts were checked against tire shipment activity, vehicle production indicators, company portfolio reviews, and supplier capability evidence. Company profiles were reviewed to avoid counting adjacent adhesives or chemicals without direct relevance to rubber bonding, reinforcement treatment, tire cord, or technical rubber adhesion applications. |
Source: Future Market Insights (FMI) analysis, based on proprietary forecasting model and primary research
Cord Adhesion Coatings Market by Segments
Cord Adhesion Coatings Market segmented by Chemistry:
- Resorcinol Formaldehyde Latex
- Epoxy-Based Coatings
- Isocyanate-Based Coatings
- Water-Based Adhesion Coatings
Cord Adhesion Coatings Market segmented by Reinforcement Type:
- Steel Cord
- Polyester Cord
- Nylon Cord
- Aramid / Rayon Cord
Cord Adhesion Coatings Market segmented by Application:
- Passenger Tires
- Truck and Bus Tires
- Industrial Belts
- Hoses / Technical Rubber
Cord Adhesion Coatings Market segmented by End Use:
- Tire Manufacturing
- Industrial Rubber Goods
- Automotive Belts
- Technical Textiles
Cord Adhesion Coatings Market segmented by Sales Channel:
- Direct to OEM
- Chemical Distributors
- Compounder Supply
Cord Adhesion Coatings Market by Region:
- North America
- United States
- Canada
- Latin America
- Brazil
- Mexico
- Argentina
- Europe
- Germany
- United Kingdom
- France
- Italy
- Spain
- East Asia
- China
- Japan
- South Korea
- South Asia
- India
- Thailand
- Indonesia
- Oceania
- Australia
- New Zealand
- Middle East and Africa
- GCC countries
- South Africa
- Turkey
Research Sources and Bibliography
- Bekaert. (2026, May). Bekaert completes acquisition of tire cord business from Bridgestone in China and Thailand. Bekaert.
- H.B. Fuller. (2024, September). Overcoming Challenges in Rubber-to-Substrate Bonding. H.B. Fuller.
- International Organization of Motor Vehicle Manufacturers. (2026, April). Auto industry growth shifted east in 2025 amid global repositioning. International Organization of Motor Vehicle Manufacturers.
- Japan Automobile Manufacturers Association. (2025, September). The Motor Industry of Japan 2025. Japan Automobile Manufacturers Association.
- Kordsa. (2024, July). 2024 Annual Report. Kordsa.
- Kordsa. (2026, March). 2025 Annual Report. Kordsa.
- Ministry of Trade Industry and Energy. (2026, January). Automobile Exports Hit Record High of $72 Billion in 2025. Ministry of Trade Industry and Energy.
- Ministry of Heavy Industries. (2026, February). Promotion of Automotive and Heavy Engineering Sector. Press Information Bureau.
- Parker Hannifin. (2024, July). Elastomer Process Materials Division. Parker Hannifin.
- Pehlivan, M. (2025, May). Optimization of Adhesion in Textile Cord-Rubber Composites. PubMed Central.
- Society of Motor Manufacturers and Traders. (2026, June). UK Car Manufacturing. Society of Motor Manufacturers and Traders.
- USA Tire Manufacturers Association. (2025, December). USTMA November 2025 Forecast. USA Tire Manufacturers Association.
- Verband der Automobilindustrie. (2025, August). Electric car production at record levels in first half of the year. Verband der Automobilindustrie.
- European Chemicals Agency. (2026, February). Assessment of regulatory needs: list. European Chemicals Agency.
- European Automobile Manufacturers Association. (2026, April). Economic and Market Report: Global and EU auto industry, full-year 2025. European Automobile Manufacturers Association.
This bibliography is provided for reader reference and uses primary government sources, standards-body references, official trade bodies and company sources.
This Report Answers
- What value is forecast for the cord adhesion coatings market in 2026 and by 2036?
- What CAGR is forecast for the cord adhesion coatings market from 2026 to 2036?
- Which chemistry, reinforcement type, application, end use, and sales channel segments shape demand?
- Which tire plant pressures support adoption and purchase activity across approved accounts?
- How do country CAGRs differ across the profiled markets?
- Which companies compete across bonding chemistry, reinforcement access, documentation, and service reach?
- How does FMI validate forecasts using hybrid bottom-up and top-down methodology?
- What factors should tire manufacturers address before broader account expansion or sourcing commitment?
- How do chemical safety files, line trials, and qualification records affect vendor selection?
Frequently Asked Questions
What is driving growth in the Cord Adhesion Coatings Market?
Growth is being driven by tire plant qualification pressure and demand for repeatable cord-to-rubber bonding. Passenger tire programs and reinforcement compatibility keep coatings under review.
Who are the key players in the Cord Adhesion Coatings Market?
Key players include Henkel, H.B. Fuller, Parker LORD, DuPont, Kordsa, Bekaert, LANXESS, Cabot and Eastman. Competition centers on bonding technology and line support.
What is a significant restraint in the Cord Adhesion Coatings Market?
A significant restraint is qualification uncertainty inside tire and technical rubber production. Buyers may delay switching when adhesion proof and heat-aging evidence are insufficient.
Why should executives track the Cord Adhesion Coatings Market?
Executives should track the market due to its direct bearing on tire plant approval risk and repeat production quality. Coating selection affects warranty exposure and supplier accountability during multi-plant qualification.
What business problem does the Cord Adhesion Coatings Market address?
The market addresses the need to bond reinforcement cords to rubber compounds in tires and technical rubber goods. The product reduces uncertainty during calendering and ageing tests before recurring production.
What should procurement leaders evaluate before selecting suppliers?
Procurement leaders should evaluate adhesion proof and reinforcement compatibility before selecting suppliers. Supplier selection should also review safety files and local trial support.
What limits return on investment for purchasers?
Return on investment is likely to be limited by long qualification cycles and incomplete chemical documentation. Adoption risk also rises if plant teams lack clear acceptance criteria.
How do suppliers build long-term account confidence?
Suppliers build account confidence by providing repeatable adhesion data and fast plant-level troubleshooting. Clear handling instructions and safety files support recurring purchase decisions.
Preview the report firsthand - request a free sample
Get SampleGet the brochure for pricing and purchase details.
Get PDFTable of Content
- Key Takeaways
- Market Size and CAGR
- Top Growth Driver
- Fastest Growing Segment
- Leading Region
- Key Companies
- Emerging Opportunities
- Executive Summary
- Global Market Outlook
- Demand-side Trends
- Supply-side Trends
- Technology Roadmap Analysis
- Analysis and Recommendations
- Analyst Perspective (What is happening? Why now? What should investors know?)
- Key Questions Answered
- How large is the market?
- What is the CAGR?
- What are key trends?
- Which region dominates?
- Who are the leaders?
- Market Overview
- Market Coverage / Taxonomy
- Market Definition / Scope / Limitations
- Research Methodology
- Chapter Orientation
- Analytical Lens and Working Hypotheses
- Market Structure, Signals, and Trend Drivers
- Benchmarking and Cross-market Comparability
- Market Sizing, Forecasting, and Opportunity Mapping
- Research Design and Evidence Framework
- Desk Research Programme (Secondary Evidence)
- Expert Input and Fieldwork (Primary Evidence)
- Tooling, Models, and Reference Databases
- Data Engineering and Model Build
- Quality Assurance and Audit Trail
- Market Background
- Market Dynamics (Drivers, Restraints, Opportunity, Trends)
- Scenario Forecast (Optimistic, Likely, Conservative)
- Impact Analysis
- AI Impact
- Sustainability Impact
- Regulatory Impact
- Technology Impact
- Consumer / Buyer Analysis
- Purchase Drivers
- Adoption Barriers
- Buyer Journey
- Opportunity Map Analysis
- Product Life Cycle Analysis
- Supply Chain Analysis
- Investment Feasibility Matrix
- Value Chain Analysis
- PESTLE and Porter's Analysis
- Regulatory Landscape
- Regional Parent Market Outlook
- Production and Consumption Statistics
- Import and Export Statistics
- Global Market Analysis and Forecast, 2021 to 2036
- Historical Market Size Value (USD Million) & Volume (Unit) Analysis, 2021 to 2025
- Current and Future Market Size Value (USD Million) & Volume (Unit) Projections, 2026 to 2036
- Y-o-Y Growth Trend Analysis
- Absolute $ Opportunity Analysis
- Global Market Pricing Analysis, 2021 to 2036
- Global Market Analysis and Forecast, By Chemistry, 2021 to 2036
- Introduction / Key Findings
- Historical Market Size Value (USD Million) & Volume (Unit) Analysis By Chemistry, 2021 to 2025
- Current and Future Market Size Value (USD Million) & Volume (Unit) Analysis and Forecast By Chemistry, 2026 to 2036
- Resorcinol Formaldehyde Latex
- Epoxy-based Coatings
- Isocyanate-based Coatings
- Water-based Adhesion Coatings
- Resorcinol Formaldehyde Latex
- Y-o-Y Growth Trend Analysis By Chemistry, 2021 to 2025
- Absolute $ Opportunity Analysis By Chemistry, 2026 to 2036
- Global Market Analysis and Forecast, By Reinforcement Type, 2021 to 2036
- Introduction / Key Findings
- Historical Market Size Value (USD Million) & Volume (Unit) Analysis By Reinforcement Type, 2021 to 2025
- Current and Future Market Size Value (USD Million) & Volume (Unit) Analysis and Forecast By Reinforcement Type, 2026 to 2036
- Steel Cord
- Polyester Cord
- Nylon Cord
- Aramid - Rayon Cord
- Steel Cord
- Y-o-Y Growth Trend Analysis By Reinforcement Type, 2021 to 2025
- Absolute $ Opportunity Analysis By Reinforcement Type, 2026 to 2036
- Global Market Analysis and Forecast, By Application, 2021 to 2036
- Introduction / Key Findings
- Historical Market Size Value (USD Million) & Volume (Unit) Analysis By Application, 2021 to 2025
- Current and Future Market Size Value (USD Million) & Volume (Unit) Analysis and Forecast By Application, 2026 to 2036
- Passenger Tires
- Truck and Bus Tires
- Industrial Belts
- Hoses - Technical Rubber
- Passenger Tires
- Y-o-Y Growth Trend Analysis By Application, 2021 to 2025
- Absolute $ Opportunity Analysis By Application, 2026 to 2036
- Global Market Analysis and Forecast, By End Use, 2021 to 2036
- Introduction / Key Findings
- Historical Market Size Value (USD Million) & Volume (Unit) Analysis By End Use, 2021 to 2025
- Current and Future Market Size Value (USD Million) & Volume (Unit) Analysis and Forecast By End Use, 2026 to 2036
- Tire Manufacturing
- Industrial Rubber Goods
- Automotive Belts
- Technical Textiles
- Tire Manufacturing
- Y-o-Y Growth Trend Analysis By End Use, 2021 to 2025
- Absolute $ Opportunity Analysis By End Use, 2026 to 2036
- Global Market Analysis and Forecast, By Sales Channel, 2021 to 2036
- Introduction / Key Findings
- Historical Market Size Value (USD Million) & Volume (Unit) Analysis By Sales Channel, 2021 to 2025
- Current and Future Market Size Value (USD Million) & Volume (Unit) Analysis and Forecast By Sales Channel, 2026 to 2036
- Direct to Oem
- Chemical Distributors
- Compounder Supply
- Direct to Oem
- Y-o-Y Growth Trend Analysis By Sales Channel, 2021 to 2025
- Absolute $ Opportunity Analysis By Sales Channel, 2026 to 2036
- Global Market Analysis and Forecast, By Region, 2021 to 2036
- Introduction
- Historical Market Size Value (USD Million) & Volume (Unit) Analysis By Region, 2021 to 2025
- Current Market Size Value (USD Million) & Volume (Unit) Analysis and Forecast By Region, 2026 to 2036
- North America
- Latin America
- Western Europe
- Eastern Europe
- East Asia
- South Asia and Pacific
- Middle East & Africa
- Market Attractiveness Analysis By Region
- North America Market Analysis and Forecast, By Country, 2021 to 2036
- Historical Market Size Value (USD Million) & Volume (Unit) Trend Analysis By Market Taxonomy, 2021 to 2025
- Market Size Value (USD Million) & Volume (Unit) Forecast By Market Taxonomy, 2026 to 2036
- By Country
- USA
- Canada
- Mexico
- By Chemistry
- By Reinforcement Type
- By Application
- By End Use
- By Sales Channel
- By Country
- Market Attractiveness Analysis
- By Country
- By Chemistry
- By Reinforcement Type
- By Application
- By End Use
- By Sales Channel
- Key Takeaways
- Latin America Market Analysis and Forecast, By Country
- Historical Market Size Value (USD Million) & Volume (Unit) Trend Analysis By Market Taxonomy, 2021 to 2025
- Market Size Value (USD Million) & Volume (Unit) Forecast By Market Taxonomy, 2026 to 2036
- By Country
- Brazil
- Chile
- Rest of Latin America
- By Chemistry
- By Reinforcement Type
- By Application
- By End Use
- By Sales Channel
- By Country
- Market Attractiveness Analysis
- By Country
- By Chemistry
- By Reinforcement Type
- By Application
- By End Use
- By Sales Channel
- Key Takeaways
- Western Europe Market Analysis and Forecast, By Country
- Historical Market Size Value (USD Million) & Volume (Unit) Trend Analysis By Market Taxonomy, 2021 to 2025
- Market Size Value (USD Million) & Volume (Unit) Forecast By Market Taxonomy, 2026 to 2036
- By Country
- Germany
- UK
- Italy
- Spain
- France
- Nordic
- BENELUX
- Rest of Western Europe
- By Chemistry
- By Reinforcement Type
- By Application
- By End Use
- By Sales Channel
- By Country
- Market Attractiveness Analysis
- By Country
- By Chemistry
- By Reinforcement Type
- By Application
- By End Use
- By Sales Channel
- Key Takeaways
- Eastern Europe Market Analysis and Forecast, By Country
- Historical Market Size Value (USD Million) & Volume (Unit) Trend Analysis By Market Taxonomy, 2021 to 2025
- Market Size Value (USD Million) & Volume (Unit) Forecast By Market Taxonomy, 2026 to 2036
- By Country
- Russia
- Poland
- Hungary
- Balkan & Baltic
- Rest of Eastern Europe
- By Chemistry
- By Reinforcement Type
- By Application
- By End Use
- By Sales Channel
- By Country
- Market Attractiveness Analysis
- By Country
- By Chemistry
- By Reinforcement Type
- By Application
- By End Use
- By Sales Channel
- Key Takeaways
- East Asia Market Analysis and Forecast, By Country
- Historical Market Size Value (USD Million) & Volume (Unit) Trend Analysis By Market Taxonomy, 2021 to 2025
- Market Size Value (USD Million) & Volume (Unit) Forecast By Market Taxonomy, 2026 to 2036
- By Country
- China
- Japan
- South Korea
- By Chemistry
- By Reinforcement Type
- By Application
- By End Use
- By Sales Channel
- By Country
- Market Attractiveness Analysis
- By Country
- By Chemistry
- By Reinforcement Type
- By Application
- By End Use
- By Sales Channel
- Key Takeaways
- South Asia and Pacific Market Analysis and Forecast, By Country
- Historical Market Size Value (USD Million) & Volume (Unit) Trend Analysis By Market Taxonomy, 2021 to 2025
- Market Size Value (USD Million) & Volume (Unit) Forecast By Market Taxonomy, 2026 to 2036
- By Country
- India
- ASEAN
- Australia & New Zealand
- Rest of South Asia and Pacific
- By Chemistry
- By Reinforcement Type
- By Application
- By End Use
- By Sales Channel
- By Country
- Market Attractiveness Analysis
- By Country
- By Chemistry
- By Reinforcement Type
- By Application
- By End Use
- By Sales Channel
- Key Takeaways
- Middle East & Africa Market Analysis and Forecast, By Country
- Historical Market Size Value (USD Million) & Volume (Unit) Trend Analysis By Market Taxonomy, 2021 to 2025
- Market Size Value (USD Million) & Volume (Unit) Forecast By Market Taxonomy, 2026 to 2036
- By Country
- Kingdom of Saudi Arabia
- Other GCC Countries
- Türkiye
- South Africa
- Other African Union
- Rest of Middle East & Africa
- By Chemistry
- By Reinforcement Type
- By Application
- By End Use
- By Sales Channel
- By Country
- Market Attractiveness Analysis
- By Country
- By Chemistry
- By Reinforcement Type
- By Application
- By End Use
- By Sales Channel
- Key Takeaways
- Key Countries Market Analysis
- USA
- Pricing Analysis
- Market Share Analysis, 2025
- By Chemistry
- By Reinforcement Type
- By Application
- By End Use
- By Sales Channel
- Canada
- Pricing Analysis
- Market Share Analysis, 2025
- By Chemistry
- By Reinforcement Type
- By Application
- By End Use
- By Sales Channel
- Mexico
- Pricing Analysis
- Market Share Analysis, 2025
- By Chemistry
- By Reinforcement Type
- By Application
- By End Use
- By Sales Channel
- Brazil
- Pricing Analysis
- Market Share Analysis, 2025
- By Chemistry
- By Reinforcement Type
- By Application
- By End Use
- By Sales Channel
- Chile
- Pricing Analysis
- Market Share Analysis, 2025
- By Chemistry
- By Reinforcement Type
- By Application
- By End Use
- By Sales Channel
- Germany
- Pricing Analysis
- Market Share Analysis, 2025
- By Chemistry
- By Reinforcement Type
- By Application
- By End Use
- By Sales Channel
- UK
- Pricing Analysis
- Market Share Analysis, 2025
- By Chemistry
- By Reinforcement Type
- By Application
- By End Use
- By Sales Channel
- Italy
- Pricing Analysis
- Market Share Analysis, 2025
- By Chemistry
- By Reinforcement Type
- By Application
- By End Use
- By Sales Channel
- Spain
- Pricing Analysis
- Market Share Analysis, 2025
- By Chemistry
- By Reinforcement Type
- By Application
- By End Use
- By Sales Channel
- France
- Pricing Analysis
- Market Share Analysis, 2025
- By Chemistry
- By Reinforcement Type
- By Application
- By End Use
- By Sales Channel
- India
- Pricing Analysis
- Market Share Analysis, 2025
- By Chemistry
- By Reinforcement Type
- By Application
- By End Use
- By Sales Channel
- ASEAN
- Pricing Analysis
- Market Share Analysis, 2025
- By Chemistry
- By Reinforcement Type
- By Application
- By End Use
- By Sales Channel
- Australia & New Zealand
- Pricing Analysis
- Market Share Analysis, 2025
- By Chemistry
- By Reinforcement Type
- By Application
- By End Use
- By Sales Channel
- China
- Pricing Analysis
- Market Share Analysis, 2025
- By Chemistry
- By Reinforcement Type
- By Application
- By End Use
- By Sales Channel
- Japan
- Pricing Analysis
- Market Share Analysis, 2025
- By Chemistry
- By Reinforcement Type
- By Application
- By End Use
- By Sales Channel
- South Korea
- Pricing Analysis
- Market Share Analysis, 2025
- By Chemistry
- By Reinforcement Type
- By Application
- By End Use
- By Sales Channel
- Russia
- Pricing Analysis
- Market Share Analysis, 2025
- By Chemistry
- By Reinforcement Type
- By Application
- By End Use
- By Sales Channel
- Poland
- Pricing Analysis
- Market Share Analysis, 2025
- By Chemistry
- By Reinforcement Type
- By Application
- By End Use
- By Sales Channel
- Hungary
- Pricing Analysis
- Market Share Analysis, 2025
- By Chemistry
- By Reinforcement Type
- By Application
- By End Use
- By Sales Channel
- Kingdom of Saudi Arabia
- Pricing Analysis
- Market Share Analysis, 2025
- By Chemistry
- By Reinforcement Type
- By Application
- By End Use
- By Sales Channel
- Türkiye
- Pricing Analysis
- Market Share Analysis, 2025
- By Chemistry
- By Reinforcement Type
- By Application
- By End Use
- By Sales Channel
- South Africa
- Pricing Analysis
- Market Share Analysis, 2025
- By Chemistry
- By Reinforcement Type
- By Application
- By End Use
- By Sales Channel
- USA
- Market Structure Analysis
- Competition Dashboard
- Competition Benchmarking
- Market Share Analysis of Top Players
- By Regional
- By Chemistry
- By Reinforcement Type
- By Application
- By End Use
- By Sales Channel
- Emerging Startups
- Innovation Benchmarking
- Competition Analysis
- Competition Deep Dive
- Henkel
- Overview
- Product Portfolio
- Profitability by Market Segments (Product/Region/Sales Channel)
- Sales Footprint
- Strategy Overview
- Marketing Strategy
- Product Strategy
- Channel Strategy
- H.B. Fuller
- Parker LORD
- DuPont
- LANXESS
- Kordsa
- Bekaert
- Cabot
- and Eastman
- Henkel
- Case Studies
- Success Stories
- Recent Developments
- Competition Deep Dive
- Assumptions & Acronyms Used


