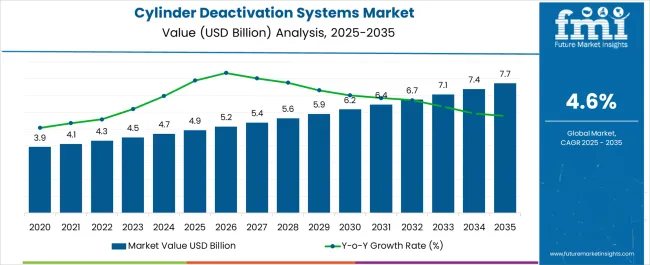
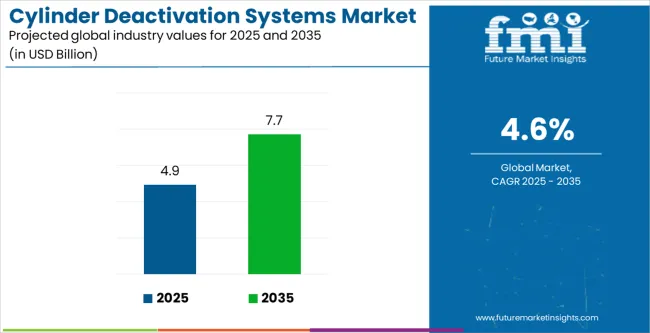
The Cylinder Deactivation Systems Market is estimated to be valued at USD 4.9 billion in 2025 and is projected to reach USD 7.7 billion by 2035, registering a compound annual growth rate (CAGR) of 4.6% over the forecast period.
| Metric | Value |
|---|---|
| Cylinder Deactivation Systems Market Estimated Value in (2025 E) | USD 4.9 billion |
| Cylinder Deactivation Systems Market Forecast Value in (2035 F) | USD 7.7 billion |
| Forecast CAGR (2025 to 2035) | 4.6% |
The cylinder deactivation systems market is experiencing robust growth, supported by rising demand for fuel efficient vehicles and increasingly stringent emission regulations across global automotive markets. Automakers are adopting cylinder deactivation technologies to enhance fuel economy without compromising performance, especially in mid to high displacement engines.
Technological improvements in electronic control units, advanced solenoids, and valve actuation systems are contributing to improved reliability and seamless operation of cylinder deactivation systems. Furthermore, growing consumer preference for passenger cars that balance power with efficiency is accelerating the adoption of these systems.
The market outlook remains favorable, as manufacturers continue to focus on integrating lightweight components, optimizing combustion, and meeting evolving environmental standards across both developed and emerging automotive markets.
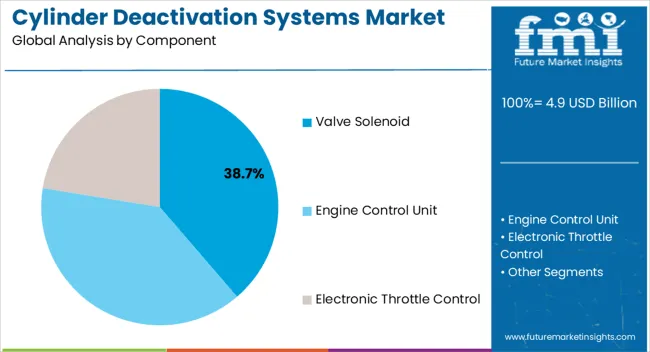
The valve solenoid segment is projected to contribute 38.70% of total market revenue by 2025 within the component category, making it the leading segment. Its dominance is attributed to the critical role valve solenoids play in enabling precise control of cylinder activation and deactivation, thereby ensuring efficient engine performance.
The growing use of electronically controlled solenoids has enhanced response accuracy, improved durability, and supported compliance with emission standards.
The ability of valve solenoids to optimize combustion and reduce fuel consumption has reinforced their prominence, establishing them as a key enabler of cylinder deactivation technology.
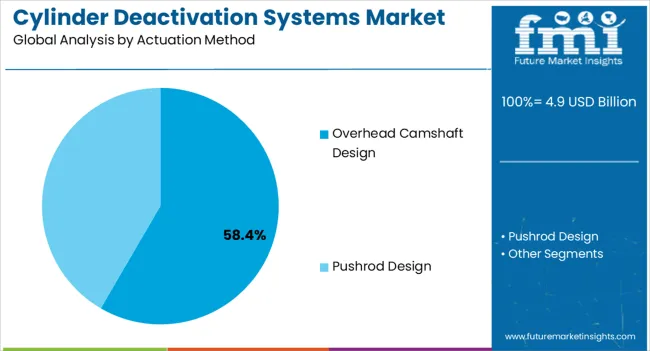
The overhead camshaft design segment is expected to hold 58.40% of total market revenue by 2025 under the actuation method category, positioning it as the most significant contributor. This is driven by the superior precision, smoother valve timing, and reduced mechanical complexity associated with overhead camshaft systems.
Automakers have increasingly adopted this design due to its compatibility with modern fuel efficiency technologies and its ability to support advanced electronic control systems.
The combination of efficiency, durability, and integration capability has allowed overhead camshaft designs to dominate within actuation methods.
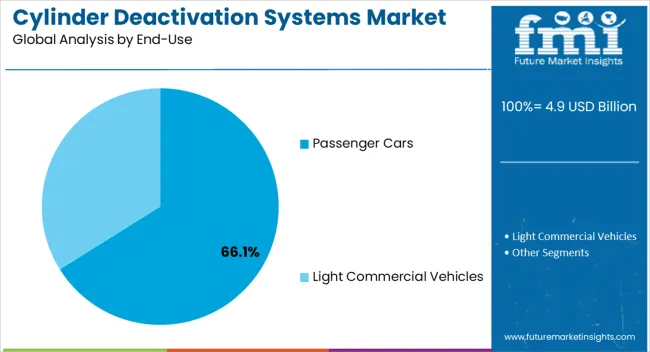
The passenger cars segment is estimated to represent 66.10% of total market revenue by 2025 within the end use category, making it the most prominent segment. This growth is fueled by the increasing consumer demand for vehicles that combine performance with fuel economy, particularly in urban and suburban markets.
The widespread presence of passenger cars across global automotive fleets, along with regulatory pressure for emission reduction, has accelerated the adoption of cylinder deactivation systems in this category.
Enhanced affordability of the technology and its integration into mainstream vehicle models have further reinforced the leadership of passenger cars in driving overall market growth.
Future Market Insights (FMI) analysis states, the cylinder deactivation system sales increased at 6.0% CAGR from 2020 to 2025. The global market for cylinder deactivation system is forecast to progress at 4.6 % CAGR in between 2025 and 2035.
Increased demand for fuel-efficient automobiles has been witnessed as a result of government authorities enacting severe emission requirements and regulations. It is expected to boost the global market for cylinder deactivation systems.
The cylinder deactivation systems industry is experiencing some interesting trends that are reshaping the industry. These trends include the increasing development and adoption of new cylinder deactivation technologies by automotive manufacturers, and the growing popularity of SUVs and pickup trucks.
In the past, cylinder deactivation systems were primarily used in luxury vehicles. With increasing demand for fuel-efficient vehicles and stricter fuel efficiency regulations, more automotive manufacturers are incorporating cylinder deactivation technology into their models.
Another trend is the growing popularity of SUVs and pickup trucks. In the past, these types of vehicles were not known for their fuel efficiency. With the development of cylinder deactivation technology, manufacturers have been able to increase fuel efficiency without compromising on performance.
As a result, there is an increasing demand for SUVs and pickup trucks equipped with cylinder deactivation systems.
Cylinder deactivation has gained prominence as a solution to compensate for the loss of displacement due to downsized engines. By deactivating cylinders when full power is not required, automakers can achieve improved fuel efficiency without sacrificing performance.
Increasingly stringent fuel economy and emissions regulations worldwide have acted as a significant driver for the adoption of cylinder deactivation systems. These regulations push automakers to explore technologies that reduce carbon dioxide (CO2) emissions and improve overall fuel efficiency.
Growing Demand for Fuel Efficiency:
Increasing environmental concerns and government regulations on emissions have prompted automotive manufacturers to focus on developing more fuel-efficient vehicles. Cylinder deactivation systems offer a solution by temporarily shutting down specific cylinders when their power is not needed, thereby reducing fuel consumption.
Increased Adoption by Automakers:
Cylinder deactivation systems have been increasingly adopted by automotive manufacturers as a means to meet stringent fuel efficiency and emissions regulations. These systems allow engines to deactivate a certain number of cylinders during light load or cruising conditions, reducing fuel consumption and emissions.
Advancements in Technology:
Ongoing advancements in cylinder deactivation technology have been observed, aiming to improve system efficiency, performance, and driver experience. These include refined control algorithms, improved actuation mechanisms, and integration with other engine management systems.
Integration with Hybrid Powertrains:
Cylinder deactivation systems have been integrated with hybrid powertrains to further enhance fuel efficiency and optimize power delivery. This integration allows for improved energy management and the ability to run the engine in the most efficient mode based on driving conditions.
Strong economies in Asia Pacific encompass China, India, and Japan. E-commerce business expansion combined with the presence of an established distribution infrastructure is helping the market in this region to flourish.
There is high prevalence of shipyards, small commercial establishments, and bulky equipment manufacturing sectors, which is driving vehicle demand. This, in turn, is likely to fuel the region's cylinder deactivation system market.
The presence of numerous automakers and manufacturers within the regions is yet another reason leading to Asia Pacific's dominant position in the globally cylinder deactivation system market.
The region is expected to reach USD 7.7 billion in valuation by 2035, from a size of USD 4.9 billion at the end of the historical period in 2025.
Growing Demand for SUVs and Light-duty Trucks in the Country Has Contributed to Expansion
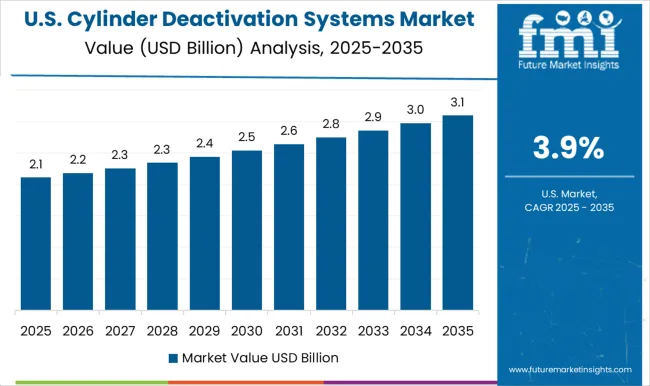
As per the latest Future Market Insights (FMI) report, the United States is set to be worth USD 7.7 billion by 2035. Sales are projected to increase at 4.6% CAGR over the forecast period 2025 and 2035.
One of the main reasons for the significant valuation of the cylinder deactivation system market in the United States is the increasing demand for low fuel-consuming vehicles. With strict emissions regulations and rising fuel costs, consumers are looking for more economical options.
The adoption of cylinder deactivation systems in the United States has increased due to its ability to improve fuel efficiency by up to 20%.
Growing demand for SUVs and light-duty trucks in the country has also contributed to the expansion of the cylinder deactivation system market.
With leading automakers such as General Motors and Ford adopting this technology, the United States is expected to remain a prominent player in the market for cylinder deactivation systems.
China's Focus On Reducing Air Pollution and Promoting Green Transportation Has Fueled Demand
In recent years, China has emerged as a leading player in the global automotive industry, with a rapidly growing consumer market and an increasing demand for fuel-efficient vehicles.
This has led to a rise in the adoption of cylinder deactivation systems in the country. It provides a cost-effective way for automakers to comply with stricter fuel efficiency standards.
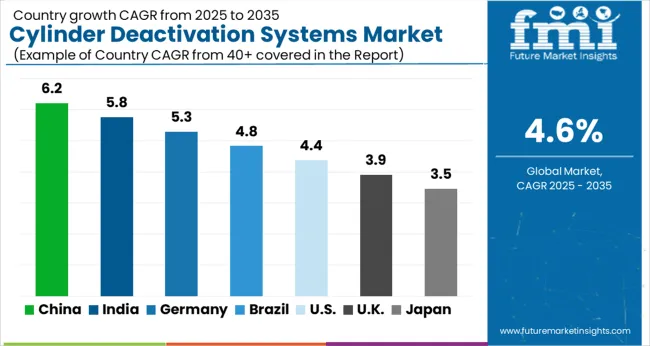
China's focus on reducing air pollution and promoting green transportation has further fueled the demand for cylinder deactivation systems. As a result, China is expected to hold a valuation of USD 1.5 billion in the global cylinder deactivation system market by 2035. It is anticipated to exhibit a 4.5% CAGR from 2025 to 2035.
Strict Regulatory Frameworks on Emissions are Popularizing Cylinder Deactivation Systems in the United Kingdom
According to FMI analysis, sales in the United Kingdom are projected to expand at 4.3% CAGR between 2025 and 2035. Revenue in the United Kingdom is projected to increase to a total of USD 237.6 million by 2035.
The United Kingdom is set to monopolize the cylinder deactivation system market, with significant valuation globally. One of the main reasons for this is the strict emission regulations imposed by the United Kingdom government, which has led to increased demand for fuel-efficient vehicles.
Cylinder deactivation systems are one way to achieve better fuel efficiency and reduce emissions. It has made them a popular technology for automakers in the United Kingdom market. As a result, the country is expected to continue to hold a significant share in the global cylinder deactivation systems market.
Increasing Demand for Fuel-Efficient Vehicles to Push Sales of Valve Solenoid Segment
Based on component, valve solenoid segment is poised to set to hold mammoth share during the projected period. It is likely to surpass at 4.4% CAGR during the forecast period.
The valve solenoid is the leading component in the cylinder deactivation systems industry due to its ability to effectively control the flow of oil to deactivate the engine cylinders.
This component ensures smooth transition between cylinder activation and deactivation, which ultimately results in improved fuel efficiency and reduced emissions.
With increasing demand for fuel-efficient vehicles, the valve solenoid is expected to continue leading the market segment. Automotive manufacturers are also focusing on developing advanced valve solenoids that can improve the overall performance of cylinder deactivation systems.
Overhead Camshaft Design Preferred for Better Precision in Valve Timing and Operation
Overhead camshaft design is estimated to dominate the valve actuation method segment in terms of market share in 2025. Sales are likely to register 4.2% CAGR during the assessment period.
The overhead camshaft design is currently the leading segment in the cylinder deactivation systems industry. This is due to its superior valve control and increased efficiency in comparison to other designs.
This design allows for better precision in valve timing and operation, resulting in a more effective cylinder deactivation process.
The overhead camshaft design is becoming increasingly popular as automotive manufacturers focus on developing more advanced and fuel-efficient engines, further driving demand for this technology.
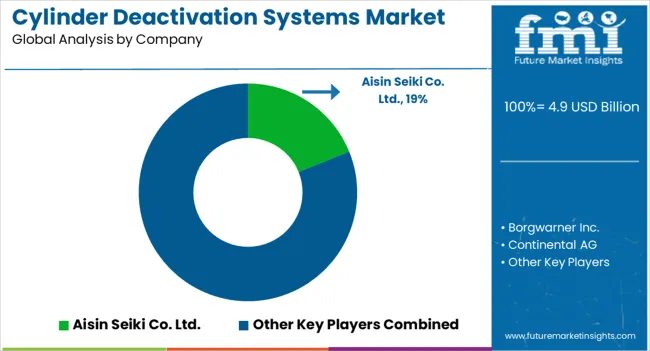
Key players in the market include Aisin Seiki Co. Ltd.; Borgwarner Inc.; Continental AG; Delphi Technologies; Denso
Key manufacturers are investing in research and development activities to enhance the efficiency performance, and reliability of cylinder deactivation systems. They are focusing on developing advanced technologies and innovative systems to meet stringent emission regulation.
To stand out in the competitive market, manufacturer focus on product differentiation. They aim to offer unique features, advanced technologies, and improved functionalities in their systems.
This include the development of intelligent control algorithms, integration with vehicle control system, and customization option based on customer preferences.
Recent developments:
| Attribute | Details |
|---|---|
| Market Size Value in 2025 | USD 4.5 billion |
| Market Forecast Value in 2035 | USD 7.1 billion |
| Anticipated Growth Rate (2025 to 2035) | 4.6% CAGR |
| Forecast Period | 2025 to 2035 |
| Historical Data Available for | 2020 to 2025 |
| Market Analysis | Volume (MT) and Value (USD billion) |
| Key Regions Covered | North America; Latin America; Europe; South Asia; East Asia; Oceania; and Middle East & Africa |
| Key Countries Covered | United States, Canada, Brazil, Mexico, Argentina, Germany, United Kingdom, France, Italy, Spain, BENELUX, Nordic, Russia, Poland China, Japan, South Korea, India, Thailand, Malaysia, Indonesia, Australia, New Zealand, GCC Countries, Turkey, Egypt, South Africa |
| Key Market Segments Covered | Component, Valve Actuation Method, End-use, and Regions |
| Key Companies Profiled | Aisin Seiki Co. Ltd.; Borgwarner Inc.; Continental AG; Delphi Technologies; Denso |
The global cylinder deactivation systems market is estimated to be valued at USD 4.9 billion in 2025.
The market size for the cylinder deactivation systems market is projected to reach USD 7.7 billion by 2035.
The cylinder deactivation systems market is expected to grow at a 4.6% CAGR between 2025 and 2035.
The key product types in cylinder deactivation systems market are valve solenoid, engine control unit and electronic throttle control.
In terms of actuation method, overhead camshaft design segment to command 58.4% share in the cylinder deactivation systems market in 2025.


Our Research Products

The "Full Research Suite" delivers actionable market intel, deep dives on markets or technologies, so clients act faster, cut risk, and unlock growth.

The Leaderboard benchmarks and ranks top vendors, classifying them as Established Leaders, Leading Challengers, or Disruptors & Challengers.

Locates where complements amplify value and substitutes erode it, forecasting net impact by horizon

We deliver granular, decision-grade intel: market sizing, 5-year forecasts, pricing, adoption, usage, revenue, and operational KPIs—plus competitor tracking, regulation, and value chains—across 60 countries broadly.

Spot the shifts before they hit your P&L. We track inflection points, adoption curves, pricing moves, and ecosystem plays to show where demand is heading, why it is changing, and what to do next across high-growth markets and disruptive tech

Real-time reads of user behavior. We track shifting priorities, perceptions of today’s and next-gen services, and provider experience, then pace how fast tech moves from trial to adoption, blending buyer, consumer, and channel inputs with social signals (#WhySwitch, #UX).

Partner with our analyst team to build a custom report designed around your business priorities. From analysing market trends to assessing competitors or crafting bespoke datasets, we tailor insights to your needs.
Supplier Intelligence
Discovery & Profiling
Capacity & Footprint
Performance & Risk
Compliance & Governance
Commercial Readiness
Who Supplies Whom
Scorecards & Shortlists
Playbooks & Docs
Category Intelligence
Definition & Scope
Demand & Use Cases
Cost Drivers
Market Structure
Supply Chain Map
Trade & Policy
Operating Norms
Deliverables
Buyer Intelligence
Account Basics
Spend & Scope
Procurement Model
Vendor Requirements
Terms & Policies
Entry Strategy
Pain Points & Triggers
Outputs
Pricing Analysis
Benchmarks
Trends
Should-Cost
Indexation
Landed Cost
Commercial Terms
Deliverables
Brand Analysis
Positioning & Value Prop
Share & Presence
Customer Evidence
Go-to-Market
Digital & Reputation
Compliance & Trust
KPIs & Gaps
Outputs
Full Research Suite comprises of:
Market outlook & trends analysis
Interviews & case studies
Strategic recommendations
Vendor profiles & capabilities analysis
5-year forecasts
8 regions and 60+ country-level data splits
Market segment data splits
12 months of continuous data updates
DELIVERED AS:
PDF EXCEL ONLINE
Cylinder Boring Machine Market Size and Share Forecast Outlook 2025 to 2035
Systems Administration Management Tools Market Size and Share Forecast Outlook 2025 to 2035
Cylinder Head Cover Market
Gas Cylinder Market Size and Share Forecast Outlook 2025 to 2035
VRF Systems Market Growth - Trends & Forecast 2025 to 2035
Cloud Systems Management Software Market Size and Share Forecast Outlook 2025 to 2035
Hi-Fi Systems Market Size and Share Forecast Outlook 2025 to 2035
Cough systems Market
Engine Cylinder Liners Market Size and Share Forecast Outlook 2025 to 2035
Backpack Systems Market Size and Share Forecast Outlook 2025 to 2035
Unmanned Systems Market Analysis - Size, Share, & Forecast Outlook 2025 to 2035
DC Power Systems Market Trends - Growth, Demand & Forecast 2025 to 2035
Catheter Systems Market
Reporter Systems Market
Aerostat Systems Market
Hydraulic Cylinder Market Size and Share Forecast Outlook 2025 to 2035
Cryogenic Systems Market Size and Share Forecast Outlook 2025 to 2035
Composite Cylinder Market Size and Share Forecast Outlook 2025 to 2035
CNG Tanks Cylinders Market Growth - Trends & Forecast 2025 to 2035
Air Brake Systems Market Growth & Demand 2025 to 2035

Thank you!
You will receive an email from our Business Development Manager. Please be sure to check your SPAM/JUNK folder too.
Chat With
MaRIA