The global deblistering machines market is projected to grow from USD 1.2 billion in 2025 to approximately USD 3.1 billion by 2035, recording an absolute increase of USD 1.9 billion over the forecast period. This translates into a total growth of 158.3%, with the market forecast to expand at a CAGR of 9.9% between 2025 and 2035. The overall market size is expected to grow by approximately 2.6X during the same period, supported by increasing demand for pharmaceutical waste management solutions, growing adoption of medication recovery systems, and rising requirements for efficient blister pack processing across healthcare facilities and pharmaceutical operations.
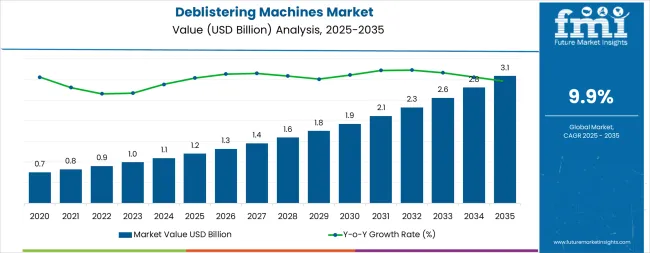
Between 2025 and 2030, the deblistering machines market is expected to grow from USD 1.2 billion to USD 1.9 billion, reflecting a 36.8% share of the total forecast growth for the decade. This period will be driven by rising demand for medication recovery solutions, increasing pharmaceutical waste management needs, and the growing availability of advanced deblistering systems in healthcare and pharmaceutical manufacturing sectors. Between 2030 and 2035, the market will expand from USD 1.9 billion to USD 3.1 billion, contributing 63.2% of the decade’s growth. This phase will be marked by the advancement of automated processing technologies, the integration of innovative recovery systems, and the development of high-capacity deblistering solutions. Emphasis on cost optimization and waste reduction will spur demand for efficient systems with improved material separation, contamination control, and enhanced processing capabilities.
| Metric | Value |
|---|---|
| Estimated Value in (2025E) | USD 1.2 billion |
| Forecast Value in (2035F) | USD 3.1 billion |
| Forecast CAGR (2025 to 2035) | 9.9% |
The deblistering machines market is primarily driven by the pharmaceutical packaging market, which contributes around 35-40%. These machines are essential in recovering tablets and capsules from blister packs, especially for returned or expired products, enabling repackaging while ensuring product safety and compliance. As the need for high-efficiency pharmaceutical packaging continues to grow, the demand for deblistering machines increases in parallel. The pharmaceutical manufacturing market holds about 20-25% of the share, where deblistering machines are used during production to recover damaged products, thus reducing waste and ensuring that only quality products are shipped. The contract packaging market contributes around 15-20%, driven by third-party companies handling packaging, returns, and waste management.
In addition to these primary sectors, the recycling and waste management market plays a significant role, accounting for 10-12%, as deblistering machines help recover pharmaceutical products from packaging materials for recycling or proper disposal, reducing environmental impact. The automated packaging systems market holds a share of 5-8%, integrating deblistering machines into automated packaging lines to enhance efficiency, reduce labor costs, and improve overall production speed. These parent markets highlight the growing need for deblistering machines in improving operational efficiency, ensuring regulatory compliance, and reducing pharmaceutical waste throughout the industry.
Market expansion is being supported by the increasing global demand for pharmaceutical waste management solutions and the corresponding shift toward automated recovery systems that can provide superior processing outcomes while meeting user requirements for cost reduction and efficient medication handling processes. Modern healthcare facilities are increasingly focused on incorporating recovery solutions that can enhance medication utilization while satisfying demands for reliable, consistently performing processing equipment and optimized waste management practices. Deblistering machines' proven ability to deliver recovery benefits, cost optimization, and diverse application possibilities makes them essential equipment for medication-intensive facilities and quality-conscious pharmaceutical organizations.
The growing emphasis on pharmaceutical waste reduction and operational efficiency is driving demand for high-quality deblistering machines that can support distinctive recovery outcomes and comprehensive cost management positioning across hospital pharmacies, pharmaceutical manufacturing, and specialty healthcare categories. User preference for equipment that combines processing excellence with efficiency characteristics is creating opportunities for innovative implementations in both traditional and emerging pharmaceutical applications. The rising influence of healthcare cost management and medication recovery initiatives is also contributing to increased adoption of deblistering machines that can provide authentic economic benefits and reliability characteristics.
The market is segmented by machine type, capacity, end-use industry, and region. By machine type, the market is divided into semi-automatic deblistering machines, fully automatic deblistering machines, and manual deblistering machines. Based on capacity, the market is categorized into low capacity, medium capacity, and high capacity. By end-use industry, the market includes pharmaceutical manufacturing, hospital pharmacies, retail pharmacies, clinical research organizations, contract packaging organizations, and other industries. Regionally, the market is divided into North America, Europe, Asia Pacific, Latin America, Middle East & Africa, and other regions.
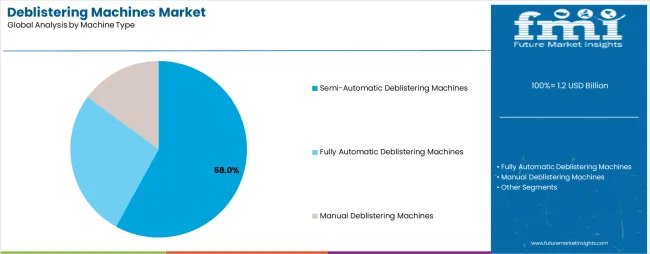
The semi-automatic deblistering machines segment is projected to account for 58% of the deblistering machines market in 2025, reaffirming its position as the leading machine category. Healthcare facilities and pharmaceutical organizations increasingly utilize semi-automatic machines for their optimal balance of processing efficiency, established operational flexibility, and essential functionality in medication recovery applications across diverse pharmaceutical categories. Semi-automatic machines' standardized performance characteristics and proven cost-effectiveness directly address user requirements for reliable medication recovery and optimal investment value in pharmaceutical applications.
This machine segment forms the foundation of modern pharmaceutical waste management patterns, as it represents the format with the greatest facility acceptance potential and established compatibility across multiple pharmaceutical systems. Facility investments in waste management optimization and cost standardization continue to strengthen adoption among quality-conscious organizations. With users prioritizing operational efficiency and cost-effectiveness, semi-automatic machines align with both economic objectives and performance requirements, making them the central component of comprehensive medication recovery strategies.
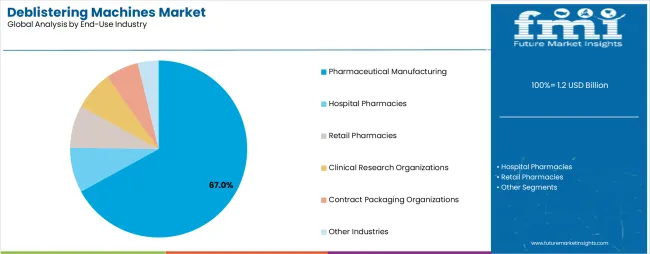
Pharmaceutical manufacturing is projected to represent 67% of the deblistering machines market growth through 2035, underscoring its critical role as the primary choice for quality-focused facilities seeking superior recovery benefits and enhanced efficiency credentials. Pharmaceutical manufacturers and production facility managers prefer deblistering machines for their enhanced processing standards, proven waste reduction superiority, and ability to maintain exceptional recovery profiles while supporting long-term cost optimization during high-volume manufacturing experiences. Positioned as essential equipment for discerning pharmaceutical operations, manufacturing offerings provide both economic excellence and efficiency advantages.
The segment is supported by continuous improvement in automated processing technology and the widespread availability of established manufacturing infrastructure that enables quality assurance and premium positioning at the production level. Additionally, equipment manufacturers are optimizing separation processing methods to support market differentiation and accessible premium pricing. As processing technology continues to advance and facilities seek superior recovery solutions, pharmaceutical manufacturing applications will continue to drive market growth while supporting medication optimization and professional handling strategies.
The deblistering machines market is advancing rapidly due to increasing pharmaceutical cost consciousness and growing need for automated recovery choices that emphasize superior processing outcomes across healthcare segments and pharmaceutical applications. However, the market faces challenges, including higher initial investment costs, maintenance requirements for automated systems, and regulatory complexities affecting operational implementation. Innovation in processing technologies and specialized equipment development continues to influence market development and expansion patterns.
The growing adoption of deblistering machines in specialized pharmaceutical programs and medication-intensive applications is enabling facilities to develop recovery patterns that provide distinctive cost benefits while commanding premium positioning and enhanced efficiency characteristics. Pharmaceutical applications provide superior processing density while allowing more sophisticated waste management across various healthcare categories. Facilities are increasingly recognizing the competitive advantages of deblistering machine positioning for premium medication recovery and cost-conscious operational integration.
Modern deblistering machine manufacturers are incorporating advanced automation systems, separation technologies, and quality management protocols to enhance processing capabilities, improve operational outcomes, and meet pharmaceutical demands for medication-specific recovery solutions. These systems improve equipment effectiveness while enabling new applications, including integrated monitoring and specialized configuration programs. Advanced automation integration also allows manufacturers to support premium market positioning and processing leadership beyond traditional recovery operations.
| Country | CAGR (2025-2035) |
|---|---|
| USA | 9.6% |
| Germany | 9.3% |
| UK | 8.9% |
| China | 10.8% |
| Japan | 8.7% |
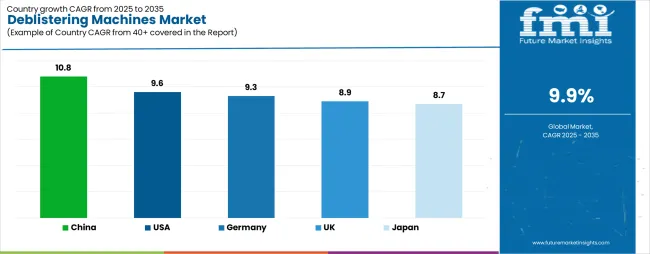
The deblistering machines market is experiencing robust growth globally, with China leading at a 10.8% CAGR through 2035, driven by the expanding pharmaceutical manufacturing sector, growing healthcare infrastructure development, and increasing adoption of medication recovery systems. The USA follows at 9.6%, supported by rising healthcare cost management initiatives, expanding pharmaceutical operations, and growing acceptance of waste reduction solutions. Germany shows growth at 9.3%, emphasizing established pharmaceutical markets and comprehensive manufacturing development. The UK records 8.9%, focusing on premium processing equipment and healthcare efficiency expansion. Japan demonstrates 8.7% growth, prioritizing quality recovery solutions and innovation.
The report covers an in-depth analysis of 40+ countries, with top-performing countries highlighted below.
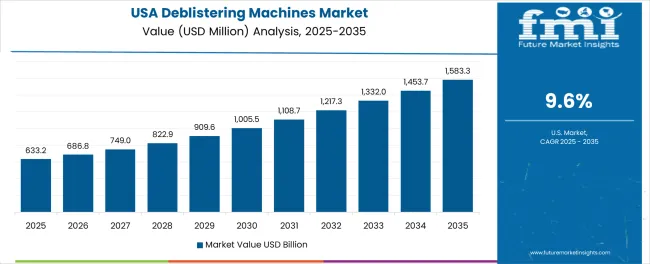
Revenue from deblistering machines consumption and sales in the USA is projected to exhibit exceptional growth with a CAGR of 9.6% through 2035, driven by the country's rapidly expanding pharmaceutical sector, favorable healthcare attitudes toward cost management solutions, and initiatives promoting medication recovery optimization across major healthcare regions. The USA's position as a leading pharmaceutical market and increasing focus on waste reduction development are creating substantial demand for high-quality deblistering machines in both hospital and manufacturing markets. Major equipment suppliers and specialty pharmaceutical equipment providers are establishing comprehensive distribution capabilities to serve growing facility demand and emerging efficiency opportunities.
Demand for deblistering machines in Germany is expanding at a CAGR of 9.3%, supported by rising pharmaceutical sophistication, growing manufacturing precision, and expanding medication recovery infrastructure. The country's developing pharmaceutical capabilities and increasing facility investment in quality equipment are driving demand for deblistering machines across both imported and domestically produced applications. International equipment companies and domestic manufacturers are establishing comprehensive distribution networks to address growing market demand for quality deblistering machines and recovery solutions.
The sale of deblistering machines products in the UK is projected to grow at a CAGR of 8.9% through 2035, supported by the country's mature pharmaceutical market, established healthcare efficiency culture, and leadership in quality standards. Britain's sophisticated healthcare infrastructure and strong support for cost management are creating steady demand for both traditional and innovative deblistering machine varieties. Leading equipment suppliers and specialty pharmaceutical equipment providers are establishing comprehensive operational strategies to serve both domestic markets and growing export opportunities.
Revenue from deblistering machines products in China is anticipated to expand at a CAGR of 10.8% through 2035, driven by the country's emphasis on pharmaceutical expansion, manufacturing leadership, and sophisticated production capabilities for medications requiring specialized recovery varieties. Chinese manufacturers and healthcare facilities consistently seek professional-grade equipment that enhances medication recovery and supports pharmaceutical operations for both traditional and innovative manufacturing applications. The country's position as an Asian pharmaceutical leader continues to drive innovation in specialty deblistering machine applications and professional equipment standards.
Demand for deblistering machines products in Japan is expected to grow at a CAGR of 8.7% through 2035, supported by the country's emphasis on quality pharmaceutical manufacturing, healthcare efficiency standards, and advanced technology integration requiring efficient recovery solutions. Japanese healthcare facilities and pharmaceutical handlers prioritize quality performance and precision processing, making deblistering machines essential equipment for both traditional and modern pharmaceutical applications. The country's comprehensive pharmaceutical excellence and advancing healthcare patterns support continued market expansion.
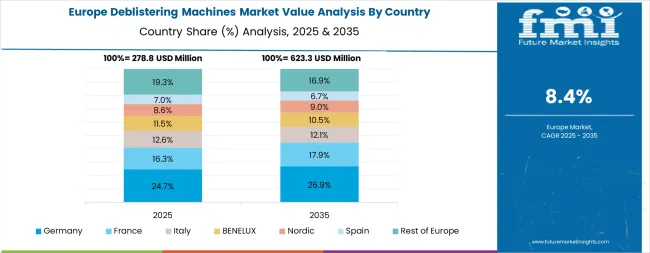
The Europe deblistering machines market is projected to grow from USD 0.4 billion in 2025 to USD 0.9 billion by 2035, recording a CAGR of 8.4% over the forecast period. Germany leads the region with a 34.0% share in 2025, moderating slightly to 33.5% by 2035, supported by its strong pharmaceutical manufacturing culture and demand for premium, professionally engineered deblistering machines. The United Kingdom follows with 22.0% in 2025, easing to 21.5% by 2035, driven by a sophisticated healthcare market and emphasis on quality and efficiency standards. France accounts for 19.5% in 2025, rising to 20.0% by 2035, reflecting steady adoption of medication recovery solutions and pharmaceutical consciousness. Italy holds 10.5% in 2025, expanding to 11.2% by 2035 as pharmaceutical modernization and specialty healthcare applications grow. Spain contributes 6.5% in 2025, growing to 7.0% by 2035, supported by expanding pharmaceutical operations and professional medication handling. The Nordic countries rise from 5.5% in 2025 to 6.0% by 2035 on the back of strong quality adoption and advanced healthcare integration. BENELUX remains at 2.0% share across both 2025 and 2035, reflecting mature, premium-focused markets.
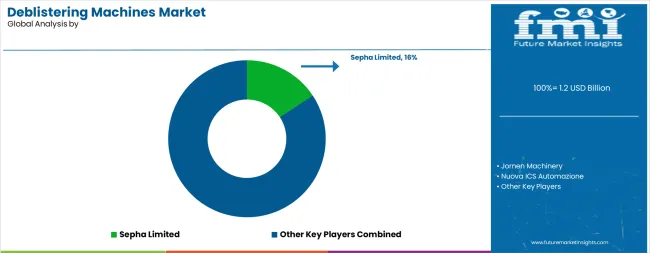
The deblistering machines market is characterized by competition among established pharmaceutical equipment companies, specialized machine manufacturers, and integrated recovery solution providers. Companies are investing in automation technologies, advanced processing systems, product innovation capabilities, and comprehensive distribution networks to deliver consistent, high-quality, and efficient deblistering machines. Innovation in separation enhancement, automated processing methods, and application-specific equipment development is central to strengthening market position and customer satisfaction.
Sepha Limited leads the market with a strong focus on pharmaceutical equipment innovation and comprehensive deblistering solutions, offering premium machines with emphasis on processing excellence and pharmaceutical heritage. Jornen Machinery provides specialized manufacturing capabilities with a focus on Asian market applications and custom design networks. Nuova ICS Automazione delivers integrated recovery solutions with a focus on quality positioning and operational efficiency. RBP Bauer specializes in comprehensive pharmaceutical equipment with an emphasis on automated applications. Uhlmann Pac-Systeme focuses on comprehensive pharmaceutical solutions with advanced engineering and premium positioning capabilities.
The success of deblistering machines in meeting pharmaceutical recovery demands, medication-driven efficiency requirements, and quality assurance integration will not only enhance operational outcomes but also strengthen global healthcare capabilities. It will consolidate emerging regions' positions as hubs for efficient pharmaceutical equipment manufacturing and align advanced economies with professional medication recovery systems. This calls for a concerted effort by all stakeholders -- governments, industry bodies, suppliers, distributors, and investors. Each can be a crucial enabler in preparing the market for its next phase of growth.
How Governments Could Spur Local Production and Adoption?
How Industry Bodies Could Support Market Development?
How Distributors and Pharmaceutical Equipment Players Could Strengthen the Ecosystem?
How Suppliers Could Navigate the Shift?
| Items | Values |
|---|---|
| Quantitative Units (2025) | USD 1.2 billion |
| Machine Type | Semi-Automatic Deblistering Machines, Fully Automatic Deblistering Machines, Manual Deblistering Machines |
| Capacity | Low Capacity, Medium Capacity, High Capacity |
| End-Use Industry | Pharmaceutical Manufacturing, Hospital Pharmacies, Retail Pharmacies, Clinical Research Organizations, Contract Packaging Organizations, Other Industries |
| Regions Covered | North America, Europe, Asia Pacific, Latin America, Middle East & Africa, Other Regions |
| Countries Covered | United States, Germany, United Kingdom, China, Japan, and 40+ countries |
| Key Companies Profiled | Sepha Limited, Jornen Machinery, Nuova ICS Automazione, RBP Bauer, Uhlmann Pac-Systeme, and other leading deblistering machine companies |
| Additional Attributes | Dollar sales by machine type, capacity, end-use industry, and region; regional demand trends, competitive landscape, innovations bin automation engineering, processing optimization initiatives, quality enhancement programs, and premium equipment development strategies |
The global deblistering machines market is estimated to be valued at USD 1.2 billion in 2025.
The market size for the deblistering machines market is projected to reach USD 3.1 billion by 2035.
The deblistering machines market is expected to grow at a 9.9% CAGR between 2025 and 2035.
The key product types in deblistering machines market are semi-automatic deblistering machines, fully automatic deblistering machines and manual deblistering machines.
In terms of end-use industry, pharmaceutical manufacturing segment to command 67.0% share in the deblistering machines market in 2025.


Full Research Suite comprises of:
Market outlook & trends analysis
Interviews & case studies
Strategic recommendations
Vendor profiles & capabilities analysis
5-year forecasts
8 regions and 60+ country-level data splits
Market segment data splits
12 months of continuous data updates
DELIVERED AS:
PDF EXCEL ONLINE
Market Share Breakdown of Leading Deblistering Machine Providers
Lathe Machines Market
Sorter Machines Market Demand & Automation Innovations 2024 to 2034
Virtual Machines Market by Type, by Enterprise Size, by Industry & Region Forecast till 2035
Bandsaw Machines Market Growth - Trends & Forecast 2025 to 2035
Sleeving Machines Market Size and Share Forecast Outlook 2025 to 2035
Drilling Machines Market Size and Share Forecast Outlook 2025 to 2035
Spinning Machines Market Size and Share Forecast Outlook 2025 to 2035
Knitting Machines Market Size and Share Forecast Outlook 2025 to 2035
Stamping Machines Market Growth and Outlook 2025 to 2035
Twist Tie Machines Market Size and Share Forecast Outlook 2025 to 2035
Cartoning Machines Market from 2025 to 2035
Flow Wrap Machines Market by Horizontal & Vertical Systems Through 2025 to 2035
Flake Ice Machines Market - Industry Growth & Market Demand 2025 to 2035
Flow Wrap Machines Market Analysis – Size, Share & Industry Trends 2025-2035
Ice Maker Machines Market
Granulator Machines Market Size and Share Forecast Outlook 2025 to 2035
Laminating Machines Market Size and Share Forecast Outlook 2025 to 2035
Anesthesia Machines Market - Size, Share, and Forecast 2025-2035
Nugget Ice Machines Market – Market Innovations & Future Trends 2025 to 2035

Thank you!
You will receive an email from our Business Development Manager. Please be sure to check your SPAM/JUNK folder too.
Chat With
MaRIA