Dementia Management Market Snapshot (2023 to 2033)

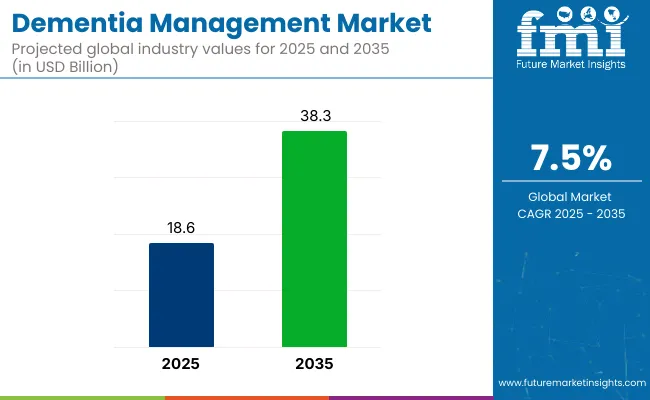
The global Dementia Management Market is expected to garner a market value of US$ 35 Million in 2023 and is expected to accumulate a market value of US$ 75.56 Million by registering a CAGR of 8% in the forecast period 2023 to 2033. The market for Dementia Management registered a CAGR of 5% in the historical period 2018 to 2022.

The Dementia Management market is a segment of the healthcare industry that deals with the effective management of dementia. The Dementia Management market offers a range of products and services for the management and treatment of dementia. This market includes products and services such as drugs for symptom management, assistive technology devices, in-home care services, and memory care facilities.

Report Attribute Details
Expected Market Value (2023) US$ 35 Million
Anticipated Forecast Value (2033) US$ 75.56 Million
Projected Growth Rate (2023 to 2033) 8% CAGR

Don't pay for what you don't need

Customize your report by selecting specific countries or regions and save 30%!

2018 to 2022 Dementia Management Market Demand Analysis vs. Forecast 2023 to 2033

According to market research and competitive intelligence provider Future Market Insights- the market for Dementia Management reflected a value of 5% during the historical period, 2018 to 2022.

As the global population continues to age and the incidence of dementia increases, the demand for effective and innovative solutions for dementia management is expected to grow. A series of international level collaborations involving healthcare stakeholders across various institutional settings are fueling further clinical trials and research studies dedicated to discovering effective ways for Dementia Management.

According to the World Health Organization, in September 2022, around 55 million individuals worldwide had dementia, with more than 60% residing in low- and middle-income countries. As the proportion of the population over the age of 65 years rises in practically every country, this figure is predicted to climb to 78 million in 2030 and 139 million in 2050. Thus, the growing prevalence of dementia worldwide is expected to boost the market's growth.

In its new study, ESOMAR-certified market research and consulting firm Future Market Insights (FMI) offers insights about key factors driving demand for Dementia Management. In the years to come, increasing focus by government organizations and private agencies like WHO and pharmaceutical companies to create awareness of Dementia Managements is fuelling the market growth. Thus, the market for Dementia Management is expected to register a CAGR of 8% in the forecast period 2023 to 2033.

Which are Some Prominent Drivers of the Dementia Management Market?

Increased Prevalence of Dementia to Push the Market Growth

The global market for dementia management is driven by the growing geriatric population and the increasing number of people suffering from dementia. The prevalence of dementia is high in low and middle-income countries, offering a significant market opportunity for companies to expand their product offerings.

In October 2022, Lecanemab was released as a promising drug for the treatment of dementia that is characterized by a progressive decline in cognitive function. In clinical trials, the drug has been shown to slow the progression of the disease by attacking the protein clumps in the brain that are thought to be responsible for the disease. Although the benefits of the drug were found to be small and accompanied by significant side effects, this is still a major step forward in the treatment of Alzheimer's. With the number of dementia cases expected to rise, the search for effective treatments and preventions is ongoing, and the development of lecanemab is a promising sign.

Sabyasachi Ghosh
Sabyasachi Ghosh

Principal Consultant

Talk to Analyst

Find your sweet spots for generating winning opportunities in this market.

What are the Challenges Faced by the Dementia Management Market?

Expensive Cost of Treatment to restrict Market Growth

The market is projected to get significantly affected by the challenging factors such as limited availability and high cost of advanced Dementia Management products, lack of trained healthcare professionals in Dementia Management, limited access to quality dementia care facilities in developing countries, and stringent government regulations for approval of Dementia Management products. Furthermore, lack of health remuneration policies, rise in cost, and side effects associated with certain treatments is expected to hinder the market growth.

Region-Wise Insights

How is the Dementia Management Market Turning Out in the Asia Pacific Region?

Improvement in healthcare spending propelling growth of Dementia Management in Asia Pacific

The Asia Pacific is expected to exhibit the significant growth rate of all regions over the forecast period, with a CAGR of 25% during the forecast period. The growth is owed to increased awareness, significant increases in healthcare spending, and a rising frequency of Dementia Management Market in the region. Asia Pacific is an emerging market due to the increase in point of care approach to health & care. Increasing number of hospitals in India and China makes a promising market for the market worldwide.

According to the National Library of Medicine, the number of people with dementia will increase from 27 million in 2020 to almost 71 million by 2050 in the Asia Pacific region. That means by 2050 more than half of the people with dementia globally (135 million) will reside in this region. There have been several developments in the region, including country-specific initiatives by governments and Alzheimer's associations; this, in turn, led to the upsurge demand for dementia management in the APAC region.

Recently, "The Safe Bracelet Project" was introduced in Wenzhou to cheer the safety of people suffering from AD. Patients were handed GPS-enabled bracelets, which have assisted in locating numerous people affected by dementia after they strolled off to distant areas.

What are the Factors Boosting the Market for Dementia Management in North America?

Technological Advancements Shaping Landscape for Dementia Management in North America

North America is anticipated to acquire a market share of about 40% in the forecast period. This growth is attributable to the rising prevalence of the condition in the region.

According to the Centre for Disease Control and Prevention (CDC) report, in 2020, an estimated 5.8 million Americans aged 65 years or older had Alzheimer's disease. This number is projected to nearly triple to 14 million people by 2060. Thus, focusing on an increasing count of patients suffering from Dementia in countries like the United States and Canada, the demand for dementia management has gradually increased.

Additionally, the increasing number of research partnerships and favorable regulatory policies also play a significant role in driving the growth of the market.

Get the data you need at a Fraction of the cost

Personalize your report by choosing insights you need
and save 40%!

Category-Wise Insights

By Type, Which Segment is Likely to Account for a Prominent Share?

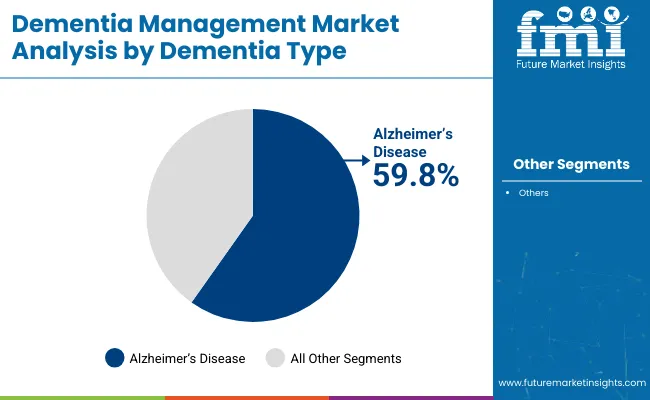
Alzheimer's disease segment is expected to hold a major market share

As per the Alzheimer’s Association 2021 report, the United States Food and Drug Administration (FDA) approved five drugs for treating Alzheimer’s, namely rivastigmine, galantamine, donepezil, memantine, and memantine combined with donepezil. The study further reported, the vast majority of people who develop Alzheimer’s dementia are aged 65 years or older. This is called late-onset Alzheimer’s.

In addition to this, in the United States, nearly 5.3% of people aged 65 to 74 years, 13.8% of people aged 75 to 84 years, and 34.6% of people aged 85 years or older have Alzheimer’s dementia. Additionally, an estimated 6.2 million Americans aged 65 years and older were living with Alzheimer’s dementia in 2021 and are projected to reach 13.5 million by 2050.

Considering these figures, the Alzheimer type of dementia is projected to push the market growth. Such a high prevalence of the disease is anticipated to bolster the demand for dementia management among the patient population over the coming years.

By Therapy, Which Segment is Likely to Account for a Significant Share?

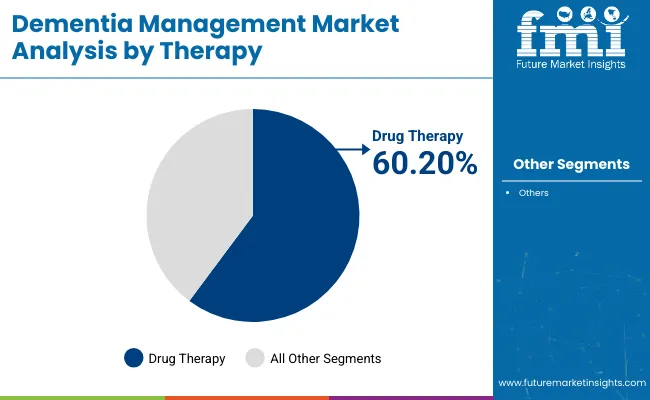
Cognitive Behavioral Therapy to take the lead and drive market growth

According to a study, Cognitive Behavioral Therapy (CBT) is a talking therapy that aims to help people understand these links between their thoughts, feelings and behaviors and use this understanding to make positive changes. CBT doesn’t work for everyone but it has become a popular way of helping people to cope with anxiety, depression and other mental health problems.

Therefore, the market segment is expected to be driven by cognitive behavioral therapy.

Startup Scenario

Key startups in the dementia management market include

  • Canadian startup RetiSpec develops a tool for the early detection of Alzheimer’s disease biomarkers in the eye. The startup’s patented technology leverages machine learning and hyperspectral imaging to identify specific biomarkers in the retina. This solution is rapid, low-cost, and also simple by design enabling medical professionals to identify signs of Alzheimer’s early on.
  • Spanish startup ADmit Therapeutics develops a diagnostic test and corresponding in vivo diagnostic device (release in 2023) to identify biomarkers not related to beta-amyloid or tau. Instead, the startup’s test is based on epigenetic diagnostics. A simple blood sample covers the analysis of a large number of methyl-cytosines in mtDNA through next-gen sequencing. Because systemic mitochondrial dysfunction appears just before cerebral abnormalities, the test is an indicator for early-onset AD.

Market Competition

Key players in the market include pharmaceutical companies such as Pfizer, Inc., Novartis AG, and Eli Lilly and Company, as well as healthcare providers and technology companies such as Teva Pharmaceutical Industries Ltd., GE Healthcare, and BrainScope among other global players.

  • In April 2022, NovaMedica developed and registered an innovative combination of Donepezil and Memantine molecules, the primary therapies for dementia associated with Alzheimer's disease. The drug is registered under the name MIOREOL. This is one of the combinations in the Russian market and the markets of the Eurasian Economic Union members and Europe.
  • In March 2022, Corium, Inc. received United States FDA approval for ADLARITY (donepezil transdermal system) as a treatment for patients with mild, moderate, or severe dementia of Alzheimer's type.

Report Scope

Report Attribute Details
Market Value in 2023 US$ 35 Million
Market Value in 2033 US$ 75.56 Million
Growth Rate CAGR of 8% from 2023 to 2033
Base Year for Estimation 2022
Historical Data 2018 to 2022
Forecast Period 2023 to 2033
Quantitative Units Revenue in USD Million and CAGR from 2023 to 2033
Report Coverage Revenue Forecast, Volume Forecast, Company Ranking, Competitive Landscape, Growth Factors, Trends and Pricing Analysis
Segments Covered
  • Type
  • Therapy
  • Route of Administration
  • Distribution Channel
  • Drug class
  • Region
Regions Covered
  • North America
  • Latin America
  • Europe
  • South Asia
  • East Asia
  • Middle East & Africa
  • Oceania
Key Countries Profiled
  • USA
  • Canada
  • Brazil
  • Argentina
  • Germany
  • United Kingdom
  • France
  • Spain
  • Italy
  • Nordics
  • BENELUX
  • Australia & New Zealand
  • China
  • India
  • Association of Southeast Asian Nations
  • Gulf Cooperation Council
  • South Africa
Key Companies Profiled Pfizer, Inc., Novartis AG, and Eli Lilly and Company, Teva Pharmaceutical Industries Ltd., GE Healthcare, and BrainScope
Customization Available Upon Request

Key Segments Profiled in the Dementia Management Industry Survey

Type:

  • Alzheimer's Disease Dementia
  • Vascular Dementia
  • Dementia With Lewy Bodies (Dlb)
  • Parkinson's Disease Dementia
  • Frontotemporal Dementia

Drug Class:

  • MAO Inhibitors
  • Glutamate Inhibitors
  • Cholinesterase Inhibitors

Therapy:

  • Cognitive Stimulation Therapy
  • Cognitive Behavioural Therapy

Route of Administration:

  • Oral
  • Parental

Distribution Channel:

  • Online Pharmacies
  • Retail Pharmacies
  • Hospital Pharmacies

Region:

  • North America
  • Latin America
  • Europe
  • South Asia
  • East Asia
  • Middle East & Africa
  • Oceania

Frequently Asked Questions

What is the Current Market Valuation?

The market is estimated to secure a valuation of US$ 35 million in 2023.

What is the Growth Forecast for the Dementia Management Market?

The market is forecast to register a CAGR of 8% through 2033.

How is the Historical Performance of the Market?

During 2018 to 2022, the market surged at a CAGR of 5%

Which is the Top Trend in the Market?

The increased prevalence of dementia pushes the market growth.

What is the Projected Size of the Market by 2033?

The global market size is expected to reach US$ 75.56 million by 2033.

Table of Content
1. Executive Summary | Dementia Management Market

    1.1. Global Market Outlook

    1.2. Demand-side Trends

    1.3. Supply-side Trends

    1.4. Technology Roadmap Analysis

    1.5. Analysis and Recommendations

2. Market Overview

    2.1. Market Coverage / Taxonomy

    2.2. Market Definition / Scope / Limitations

3. Market Background

    3.1. Market Dynamics

        3.1.1. Drivers

        3.1.2. Restraints

        3.1.3. Opportunity

        3.1.4. Trends

    3.2. Scenario Forecast

        3.2.1. Demand in Optimistic Scenario

        3.2.2. Demand in Likely Scenario

        3.2.3. Demand in Conservative Scenario

    3.3. Opportunity Map Analysis

    3.4. Investment Feasibility Matrix

    3.5. PESTLE and Porter’s Analysis

    3.6. Regulatory Landscape

        3.6.1. By Key Regions

        3.6.2. By Key Countries

    3.7. Regional Parent Market Outlook

4. Global Market Analysis 2018 to 2022 and Forecast, 2023 to 2033

    4.1. Historical Market Size Value (US$ Million) Analysis, 2018 to 2022

    4.2. Current and Future Market Size Value (US$ Million) Projections, 2023 to 2033

        4.2.1. Y-o-Y Growth Trend Analysis

        4.2.2. Absolute $ Opportunity Analysis

5. Global Market Analysis 2018 to 2022 and Forecast 2023 to 2033, By Type

    5.1. Introduction / Key Findings

    5.2. Historical Market Size Value (US$ Million) Analysis By Type, 2018 to 2022

    5.3. Current and Future Market Size Value (US$ Million) Analysis and Forecast By Type, 2023 to 2033

        5.3.1. Alzheimer's Disease Dementia

        5.3.2. Vascular Dementia

        5.3.3. Dementia With Lewy Bodies (Dlb)

        5.3.4. Parkinson's Disease Dementia

        5.3.5. Frontotemporal Dementia

    5.4. Y-o-Y Growth Trend Analysis By Type, 2018 to 2022

    5.5. Absolute $ Opportunity Analysis By Type, 2023 to 2033

6. Global Market Analysis 2018 to 2022 and Forecast 2023 to 2033, By Drug Class

    6.1. Introduction / Key Findings

    6.2. Historical Market Size Value (US$ Million) Analysis By Drug Class, 2018 to 2022

    6.3. Current and Future Market Size Value (US$ Million) Analysis and Forecast By Drug Class, 2023 to 2033

        6.3.1. MAO Inhibitors

        6.3.2. Glutamate Inhibitors

        6.3.3. Cholinesterase Inhibitors

    6.4. Y-o-Y Growth Trend Analysis By Drug Class, 2018 to 2022

    6.5. Absolute $ Opportunity Analysis By Drug Class, 2023 to 2033

7. Global Market Analysis 2018 to 2022 and Forecast 2023 to 2033, By Therapy

    7.1. Introduction / Key Findings

    7.2. Historical Market Size Value (US$ Million) Analysis By Therapy , 2018 to 2022

    7.3. Current and Future Market Size Value (US$ Million) Analysis and Forecast By Therapy , 2023 to 2033

        7.3.1. Cognitive Stimulation Therapy

        7.3.2. Cognitive Behavioural Therapy

    7.4. Y-o-Y Growth Trend Analysis By Therapy , 2018 to 2022

    7.5. Absolute $ Opportunity Analysis By Therapy , 2023 to 2033

8. Global Market Analysis 2018 to 2022 and Forecast 2023 to 2033, By Route of Administration

    8.1. Introduction / Key Findings

    8.2. Historical Market Size Value (US$ Million) Analysis By Route of Administration, 2018 to 2022

    8.3. Current and Future Market Size Value (US$ Million) Analysis and Forecast By Route of Administration, 2023 to 2033

        8.3.1. Oral

        8.3.2. Parenteral

    8.4. Y-o-Y Growth Trend Analysis By Route of Administration, 2018 to 2022

    8.5. Absolute $ Opportunity Analysis By Route of Administration, 2023 to 2033

9. Global Market Analysis 2018 to 2022 and Forecast 2023 to 2033, By Distribution Channel

    9.1. Introduction / Key Findings

    9.2. Historical Market Size Value (US$ Million) Analysis By Distribution Channel, 2018 to 2022

    9.3. Current and Future Market Size Value (US$ Million) Analysis and Forecast By Distribution Channel, 2023 to 2033

        9.3.1. Online pharmacies

        9.3.2. Hospital pharmacies

        9.3.3. Retail pharmacies

    9.4. Y-o-Y Growth Trend Analysis By Distribution Channel, 2018 to 2022

    9.5. Absolute $ Opportunity Analysis By Distribution Channel, 2023 to 2033

10. Global Market Analysis 2018 to 2022 and Forecast 2023 to 2033, By Region

    10.1. Introduction

    10.2. Historical Market Size Value (US$ Million) Analysis By Region, 2018 to 2022

    10.3. Current Market Size Value (US$ Million) Analysis and Forecast By Region, 2023 to 2033

        10.3.1. North America

        10.3.2. Latin America

        10.3.3. Europe

        10.3.4. South Asia

        10.3.5. East Asia

        10.3.6. Oceania

        10.3.7. MEA

    10.4. Market Attractiveness Analysis By Region

11. North America Market Analysis 2018 to 2022 and Forecast 2023 to 2033, By Country

    11.1. Historical Market Size Value (US$ Million) Trend Analysis By Market Taxonomy, 2018 to 2022

    11.2. Market Size Value (US$ Million) Forecast By Market Taxonomy, 2023 to 2033

        11.2.1. By Country

            11.2.1.1. USA

            11.2.1.2. Canada

        11.2.2. By Type

        11.2.3. By Drug Class

        11.2.4. By Therapy

        11.2.5. By Route of Administration

        11.2.6. By Distribution Channel

    11.3. Market Attractiveness Analysis

        11.3.1. By Country

        11.3.2. By Type

        11.3.3. By Drug Class

        11.3.4. By Therapy

        11.3.5. By Route of Administration

        11.3.6. By Distribution Channel

    11.4. Key Takeaways

12. Latin America Market Analysis 2018 to 2022 and Forecast 2023 to 2033, By Country

    12.1. Historical Market Size Value (US$ Million) Trend Analysis By Market Taxonomy, 2018 to 2022

    12.2. Market Size Value (US$ Million) Forecast By Market Taxonomy, 2023 to 2033

        12.2.1. By Country

            12.2.1.1. Brazil

            12.2.1.2. Mexico

            12.2.1.3. Rest of Latin America

        12.2.2. By Type

        12.2.3. By Drug Class

        12.2.4. By Therapy

        12.2.5. By Route of Administration

        12.2.6. By Distribution Channel

    12.3. Market Attractiveness Analysis

        12.3.1. By Country

        12.3.2. By Type

        12.3.3. By Drug Class

        12.3.4. By Therapy

        12.3.5. By Route of Administration

        12.3.6. By Distribution Channel

    12.4. Key Takeaways

13. Europe Market Analysis 2018 to 2022 and Forecast 2023 to 2033, By Country

    13.1. Historical Market Size Value (US$ Million) Trend Analysis By Market Taxonomy, 2018 to 2022

    13.2. Market Size Value (US$ Million) Forecast By Market Taxonomy, 2023 to 2033

        13.2.1. By Country

            13.2.1.1. Germany

            13.2.1.2. United kingdom

            13.2.1.3. France

            13.2.1.4. Spain

            13.2.1.5. Italy

            13.2.1.6. Rest of Europe

        13.2.2. By Type

        13.2.3. By Drug Class

        13.2.4. By Therapy

        13.2.5. By Route of Administration

        13.2.6. By Distribution Channel

    13.3. Market Attractiveness Analysis

        13.3.1. By Country

        13.3.2. By Type

        13.3.3. By Drug Class

        13.3.4. By Therapy

        13.3.5. By Route of Administration

        13.3.6. By Distribution Channel

    13.4. Key Takeaways

14. South Asia Market Analysis 2018 to 2022 and Forecast 2023 to 2033, By Country

    14.1. Historical Market Size Value (US$ Million) Trend Analysis By Market Taxonomy, 2018 to 2022

    14.2. Market Size Value (US$ Million) Forecast By Market Taxonomy, 2023 to 2033

        14.2.1. By Country

            14.2.1.1. India

            14.2.1.2. Malaysia

            14.2.1.3. Singapore

            14.2.1.4. Thailand

            14.2.1.5. Rest of South Asia

        14.2.2. By Type

        14.2.3. By Drug Class

        14.2.4. By Therapy

        14.2.5. By Route of Administration

        14.2.6. By Distribution Channel

    14.3. Market Attractiveness Analysis

        14.3.1. By Country

        14.3.2. By Type

        14.3.3. By Drug Class

        14.3.4. By Therapy

        14.3.5. By Route of Administration

        14.3.6. By Distribution Channel

    14.4. Key Takeaways

15. East Asia Market Analysis 2018 to 2022 and Forecast 2023 to 2033, By Country

    15.1. Historical Market Size Value (US$ Million) Trend Analysis By Market Taxonomy, 2018 to 2022

    15.2. Market Size Value (US$ Million) Forecast By Market Taxonomy, 2023 to 2033

        15.2.1. By Country

            15.2.1.1. China

            15.2.1.2. Japan

            15.2.1.3. South Korea

        15.2.2. By Type

        15.2.3. By Drug Class

        15.2.4. By Therapy

        15.2.5. By Route of Administration

        15.2.6. By Distribution Channel

    15.3. Market Attractiveness Analysis

        15.3.1. By Country

        15.3.2. By Type

        15.3.3. By Drug Class

        15.3.4. By Therapy

        15.3.5. By Route of Administration

        15.3.6. By Distribution Channel

    15.4. Key Takeaways

16. Oceania Market Analysis 2018 to 2022 and Forecast 2023 to 2033, By Country

    16.1. Historical Market Size Value (US$ Million) Trend Analysis By Market Taxonomy, 2018 to 2022

    16.2. Market Size Value (US$ Million) Forecast By Market Taxonomy, 2023 to 2033

        16.2.1. By Country

            16.2.1.1. Australia

            16.2.1.2. New Zealand

        16.2.2. By Type

        16.2.3. By Drug Class

        16.2.4. By Therapy

        16.2.5. By Route of Administration

        16.2.6. By Distribution Channel

    16.3. Market Attractiveness Analysis

        16.3.1. By Country

        16.3.2. By Type

        16.3.3. By Drug Class

        16.3.4. By Therapy

        16.3.5. By Route of Administration

        16.3.6. By Distribution Channel

    16.4. Key Takeaways

17. MEA Market Analysis 2018 to 2022 and Forecast 2023 to 2033, By Country

    17.1. Historical Market Size Value (US$ Million) Trend Analysis By Market Taxonomy, 2018 to 2022

    17.2. Market Size Value (US$ Million) Forecast By Market Taxonomy, 2023 to 2033

        17.2.1. By Country

            17.2.1.1. GCC Countries

            17.2.1.2. South Africa

            17.2.1.3. Israel

            17.2.1.4. Rest of MEA

        17.2.2. By Type

        17.2.3. By Drug Class

        17.2.4. By Therapy

        17.2.5. By Route of Administration

        17.2.6. By Distribution Channel

    17.3. Market Attractiveness Analysis

        17.3.1. By Country

        17.3.2. By Type

        17.3.3. By Drug Class

        17.3.4. By Therapy

        17.3.5. By Route of Administration

        17.3.6. By Distribution Channel

    17.4. Key Takeaways

18. Key Countries Market Analysis

    18.1. USA

        18.1.1. Pricing Analysis

        18.1.2. Market Share Analysis, 2022

            18.1.2.1. By Type

            18.1.2.2. By Drug Class

            18.1.2.3. By Therapy

            18.1.2.4. By Route of Administration

            18.1.2.5. By Distribution Channel

    18.2. Canada

        18.2.1. Pricing Analysis

        18.2.2. Market Share Analysis, 2022

            18.2.2.1. By Type

            18.2.2.2. By Drug Class

            18.2.2.3. By Therapy

            18.2.2.4. By Route of Administration

            18.2.2.5. By Distribution Channel

    18.3. Brazil

        18.3.1. Pricing Analysis

        18.3.2. Market Share Analysis, 2022

            18.3.2.1. By Type

            18.3.2.2. By Drug Class

            18.3.2.3. By Therapy

            18.3.2.4. By Route of Administration

            18.3.2.5. By Distribution Channel

    18.4. Mexico

        18.4.1. Pricing Analysis

        18.4.2. Market Share Analysis, 2022

            18.4.2.1. By Type

            18.4.2.2. By Drug Class

            18.4.2.3. By Therapy

            18.4.2.4. By Route of Administration

            18.4.2.5. By Distribution Channel

    18.5. Germany

        18.5.1. Pricing Analysis

        18.5.2. Market Share Analysis, 2022

            18.5.2.1. By Type

            18.5.2.2. By Drug Class

            18.5.2.3. By Therapy

            18.5.2.4. By Route of Administration

            18.5.2.5. By Distribution Channel

    18.6. United kingdom

        18.6.1. Pricing Analysis

        18.6.2. Market Share Analysis, 2022

            18.6.2.1. By Type

            18.6.2.2. By Drug Class

            18.6.2.3. By Therapy

            18.6.2.4. By Route of Administration

            18.6.2.5. By Distribution Channel

    18.7. France

        18.7.1. Pricing Analysis

        18.7.2. Market Share Analysis, 2022

            18.7.2.1. By Type

            18.7.2.2. By Drug Class

            18.7.2.3. By Therapy

            18.7.2.4. By Route of Administration

            18.7.2.5. By Distribution Channel

    18.8. Spain

        18.8.1. Pricing Analysis

        18.8.2. Market Share Analysis, 2022

            18.8.2.1. By Type

            18.8.2.2. By Drug Class

            18.8.2.3. By Therapy

            18.8.2.4. By Route of Administration

            18.8.2.5. By Distribution Channel

    18.9. Italy

        18.9.1. Pricing Analysis

        18.9.2. Market Share Analysis, 2022

            18.9.2.1. By Type

            18.9.2.2. By Drug Class

            18.9.2.3. By Therapy

            18.9.2.4. By Route of Administration

            18.9.2.5. By Distribution Channel

    18.10. India

        18.10.1. Pricing Analysis

        18.10.2. Market Share Analysis, 2022

            18.10.2.1. By Type

            18.10.2.2. By Drug Class

            18.10.2.3. By Therapy

            18.10.2.4. By Route of Administration

            18.10.2.5. By Distribution Channel

    18.11. Malaysia

        18.11.1. Pricing Analysis

        18.11.2. Market Share Analysis, 2022

            18.11.2.1. By Type

            18.11.2.2. By Drug Class

            18.11.2.3. By Therapy

            18.11.2.4. By Route of Administration

            18.11.2.5. By Distribution Channel

    18.12. Singapore

        18.12.1. Pricing Analysis

        18.12.2. Market Share Analysis, 2022

            18.12.2.1. By Type

            18.12.2.2. By Drug Class

            18.12.2.3. By Therapy

            18.12.2.4. By Route of Administration

            18.12.2.5. By Distribution Channel

    18.13. Thailand

        18.13.1. Pricing Analysis

        18.13.2. Market Share Analysis, 2022

            18.13.2.1. By Type

            18.13.2.2. By Drug Class

            18.13.2.3. By Therapy

            18.13.2.4. By Route of Administration

            18.13.2.5. By Distribution Channel

    18.14. China

        18.14.1. Pricing Analysis

        18.14.2. Market Share Analysis, 2022

            18.14.2.1. By Type

            18.14.2.2. By Drug Class

            18.14.2.3. By Therapy

            18.14.2.4. By Route of Administration

            18.14.2.5. By Distribution Channel

    18.15. Japan

        18.15.1. Pricing Analysis

        18.15.2. Market Share Analysis, 2022

            18.15.2.1. By Type

            18.15.2.2. By Drug Class

            18.15.2.3. By Therapy

            18.15.2.4. By Route of Administration

            18.15.2.5. By Distribution Channel

    18.16. South Korea

        18.16.1. Pricing Analysis

        18.16.2. Market Share Analysis, 2022

            18.16.2.1. By Type

            18.16.2.2. By Drug Class

            18.16.2.3. By Therapy

            18.16.2.4. By Route of Administration

            18.16.2.5. By Distribution Channel

    18.17. Australia

        18.17.1. Pricing Analysis

        18.17.2. Market Share Analysis, 2022

            18.17.2.1. By Type

            18.17.2.2. By Drug Class

            18.17.2.3. By Therapy

            18.17.2.4. By Route of Administration

            18.17.2.5. By Distribution Channel

    18.18. New Zealand

        18.18.1. Pricing Analysis

        18.18.2. Market Share Analysis, 2022

            18.18.2.1. By Type

            18.18.2.2. By Drug Class

            18.18.2.3. By Therapy

            18.18.2.4. By Route of Administration

            18.18.2.5. By Distribution Channel

    18.19. GCC Countries

        18.19.1. Pricing Analysis

        18.19.2. Market Share Analysis, 2022

            18.19.2.1. By Type

            18.19.2.2. By Drug Class

            18.19.2.3. By Therapy

            18.19.2.4. By Route of Administration

            18.19.2.5. By Distribution Channel

    18.20. South Africa

        18.20.1. Pricing Analysis

        18.20.2. Market Share Analysis, 2022

            18.20.2.1. By Type

            18.20.2.2. By Drug Class

            18.20.2.3. By Therapy

            18.20.2.4. By Route of Administration

            18.20.2.5. By Distribution Channel

    18.21. Israel

        18.21.1. Pricing Analysis

        18.21.2. Market Share Analysis, 2022

            18.21.2.1. By Type

            18.21.2.2. By Drug Class

            18.21.2.3. By Therapy

            18.21.2.4. By Route of Administration

            18.21.2.5. By Distribution Channel

19. Market Structure Analysis

    19.1. Competition Dashboard

    19.2. Competition Benchmarking

    19.3. Market Share Analysis of Top Players

        19.3.1. By Regional

        19.3.2. By Type

        19.3.3. By Drug Class

        19.3.4. By Therapy

        19.3.5. By Route of Administration

        19.3.6. By Distribution Channel

20. Competition Analysis

    20.1. Competition Deep Dive

        20.1.1. Eli Lilly and Company

            20.1.1.1. Overview

            20.1.1.2. Product Portfolio

            20.1.1.3. Profitability by Market Segments

            20.1.1.4. Sales Footprint

            20.1.1.5. Strategy Overview

                20.1.1.5.1. Marketing Strategy

        20.1.2. Eisai Co., Ltd.

            20.1.2.1. Overview

            20.1.2.2. Product Portfolio

            20.1.2.3. Profitability by Market Segments

            20.1.2.4. Sales Footprint

            20.1.2.5. Strategy Overview

                20.1.2.5.1. Marketing Strategy

        20.1.3. Novartis AG

            20.1.3.1. Overview

            20.1.3.2. Product Portfolio

            20.1.3.3. Profitability by Market Segments

            20.1.3.4. Sales Footprint

            20.1.3.5. Strategy Overview

                20.1.3.5.1. Marketing Strategy

        20.1.4. Cipla Inc

            20.1.4.1. Overview

            20.1.4.2. Product Portfolio

            20.1.4.3. Profitability by Market Segments

            20.1.4.4. Sales Footprint

            20.1.4.5. Strategy Overview

                20.1.4.5.1. Marketing Strategy

        20.1.5. Aurobindo Pharma

            20.1.5.1. Overview

            20.1.5.2. Product Portfolio

            20.1.5.3. Profitability by Market Segments

            20.1.5.4. Sales Footprint

            20.1.5.5. Strategy Overview

                20.1.5.5.1. Marketing Strategy

        20.1.6. Sun Pharmaceutical Industries Ltd

            20.1.6.1. Overview

            20.1.6.2. Product Portfolio

            20.1.6.3. Profitability by Market Segments

            20.1.6.4. Sales Footprint

            20.1.6.5. Strategy Overview

                20.1.6.5.1. Marketing Strategy

        20.1.7. Mylan N.V.

            20.1.7.1. Overview

            20.1.7.2. Product Portfolio

            20.1.7.3. Profitability by Market Segments

            20.1.7.4. Sales Footprint

            20.1.7.5. Strategy Overview

                20.1.7.5.1. Marketing Strategy

        20.1.8. Dr. Reddy’s Laboratories Ltd

            20.1.8.1. Overview

            20.1.8.2. Product Portfolio

            20.1.8.3. Profitability by Market Segments

            20.1.8.4. Sales Footprint

            20.1.8.5. Strategy Overview

                20.1.8.5.1. Marketing Strategy

        20.1.9. Zydus Cadila

            20.1.9.1. Overview

            20.1.9.2. Product Portfolio

            20.1.9.3. Profitability by Market Segments

            20.1.9.4. Sales Footprint

            20.1.9.5. Strategy Overview

                20.1.9.5.1. Marketing Strategy

        20.1.10. LUPIN

            20.1.10.1. Overview

            20.1.10.2. Product Portfolio

            20.1.10.3. Profitability by Market Segments

            20.1.10.4. Sales Footprint

            20.1.10.5. Strategy Overview

                20.1.10.5.1. Marketing Strategy

        20.1.11. Torrent Pharmaceuticals Ltd

            20.1.11.1. Overview

            20.1.11.2. Product Portfolio

            20.1.11.3. Profitability by Market Segments

            20.1.11.4. Sales Footprint

            20.1.11.5. Strategy Overview

                20.1.11.5.1. Marketing Strategy

        20.1.12. Johnson & Johnson Services, Inc

            20.1.12.1. Overview

            20.1.12.2. Product Portfolio

            20.1.12.3. Profitability by Market Segments

            20.1.12.4. Sales Footprint

            20.1.12.5. Strategy Overview

                20.1.12.5.1. Marketing Strategy

        20.1.13. Pharmaceuticals PLC

            20.1.13.1. Overview

            20.1.13.2. Product Portfolio

            20.1.13.3. Profitability by Market Segments

            20.1.13.4. Sales Footprint

            20.1.13.5. Strategy Overview

                20.1.13.5.1. Marketing Strategy

21. Assumptions & Acronyms Used

22. Research Methodology
Recommendations

Healthcare

Dementia Care Products Market

October 2017

REP-GB-5227

August 2023

315 pages

Healthcare

Alzheimer’s Therapeutics Market

April 2022

REP-GB-14497

April 2023

324 pages

Healthcare

Frontotemporal Dementia Management Market

January 2023

REP-GB-16489

310 pages

Explore Healthcare Insights

View Reports
Future Market Insights

Dementia Management Market