Reports

- Global Locations -

Headquarters

Future Market Insights, Inc.

Christiana Corporate, 200
Continental Drive, Suite 401,
Newark, Delaware - 19713,
United States

T: +1-845-579-5705

Americas

Future Market Insights, Inc.

616 Corporate Way, Suite 2-9018,
Valley Cottage, NY 10989, United States

T: +1-347-918-3531

MEA

Future Market Insights

1602-6 Jumeirah Bay X2 Tower, Plot No: JLT-PH2-X2A,
Jumeirah Lakes Towers, Dubai,
United Arab Emirates

Europe

Future Market Insights

3rd Floor, 207 Regent Street,
W1B 3HH London
United Kingdom

T: + 44 (0) 20 8123 9659
D: +44 (0) 20 3287 4268

Asia Pacific

Future Market Insights

IndiaLand Global Tech Park, Unit UG-1, Behind Grand HighStreet, Phase 1, Hinjawadi, MH, Pune – 411057, India

Destructive Testing Market

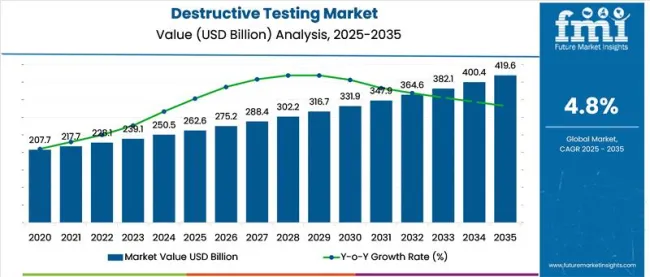
In 2021, the destructive testing market grew by 4.8% year on year. Across the entire globe, the overall sales of equipment in destructive testing market is expected to surpass 355,908 units by 2031. As a result of soaring concerns pertaining to food safety and resultant integration of advanced technologies in production will enable growth in the market at 6% CAGR between 2021 and 2031.

Key Points Covered in Destructive Testing Market Survey

  • Destructive Testing Market Demand Outlook 2021-2031
  • Assessment of Historic Growth Trajectory for 2016-2020
  • Destructive Testing Market Size and Sales Estimation
  • Key Trend Analysis and Risk Assessment
  • Category-wise Assessment
  • Competition Assessment Amongst Key Destructive Testing Market Players
  • Pre and Post-COVID-19 Market Performance

Destructive Testing Market Demand Outlook Comparison Between 2016-2020 and 2021-2031

The demand for destructive testing has hit all-time high, thanks to focus on food security. Industry players have upped their game with the introduction of cutting-edge technologies to prevent food contamination and microbiological hazards.

Food analysts are showing greater interest for obtaining information about diverse properties of food. Destructive testing offers data on various aspects of a food item, including their composition, structure, physiochemical properties and sensory attributes.

Focus on making tested good available in the market at a shorter time will encourage investment in destructive testing. Future Market Insights (FMI) identifies this as growth opportunity for the market.

Destructive Testing Market

Since the last five years, manufacturers have begun implementing Industry 4.0 norms. This will enable integration of smart digital technologies, machine learning, and big data in physical production and operations in the food industry. This also will offer a more holistic and better connected ecosystem for companies that focus on manufacturing and supply chain management.

Spurred by this, the demand for destructive testing is expected to increase at 6% CAGR in 2021-2031, in comparison to 5.4% CAGR registered in 2016-2020.

What Is the Impact of COVID-19 Crisis on Global Destructive Testing Market?

The destructive testing market growth is expected to be affected by the COVID-19 crisis and is expected to witness a substantial drop in demand in 2020. During this time capital expenditures in research and development of new products for almost entire food industry, including packed food, dairy, and other sectors were suspended which is expected to result in a significant drop in Y-O-Y growth. However, growth is projected to witness a V-shape recovery rate as the economic activity gets back to pre-crisis levels post the containment of pandemic.

Country-wise Insights

What % of Destructive Testing Sales will be based out of U.S.?

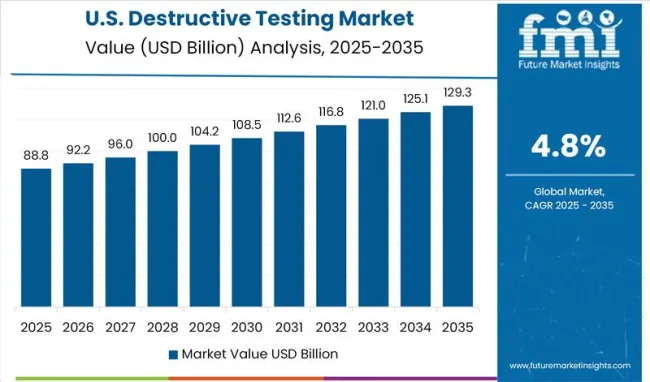
FMI has projected the U.S. to remain one of the lucrative markets throughout the course of the forecast period. One of the key factors supporting expansion in the U.S. is the growth in demand for dairy, pet foods, and packaged foods in the retail and foodservice sectors of the country.

Demand in the U.S. is expected to increase at little below 7% CAGR in the forthcoming years. As an established market for destructive testing, the U.S. is expected retain dominance in North America.

This is attributed to burgeoning retail and hospitality/ aviation based foodservice industry which has been clocking a healthy growth rate coupled with stringent quality and hygiene standards implemented by the U.S. Food and Drugs Administration and complied by processed/ packaged food manufacturers.

What are Prospects for Destructive Testing Market Growth in Japan?

Being the second leading shareholder in Asia, Japan destructive testing market is pegged to grow at over 6% CAGR during the period 2021-2031. In recent years, manufacturers are pursuing omni-channel sales, creating pool of new customers in the nation

Growth in fast food outlets and pet food and hospitality based packaged food markets in the country will support the market growth.
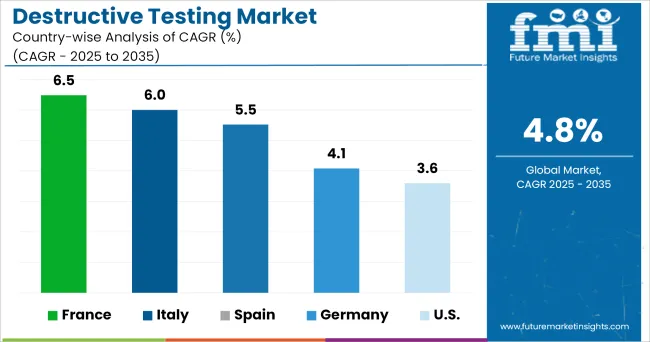
What’s the Growth Outlook of Destructive Testing Market in France?

France destructive testing market is estimated to be the second leading in Europe and is projected to register highest growth during the forecast period. Pet foods and dairy industries have emerged as key end users of destructive testing technology and equipment in France.

EU regulations on food law covers definitions, procedural rules, and product-specific rules. Implementation of stringent regulations has bode well for the processed food industry based in France.

It defines general food safety and health protection rules, addresses labeling requirements, regulates inspection, detention, and seizure rules for suspect food. Other legislations within Europe state similar regulations for ensuring the safety of food, presentation, traceability, import, exports, etc.

Implementation of stringent food security laws will create scope for destructing testing application in the country.

Nikhil Kaitwade
Nikhil Kaitwade

Principal Consultant

Talk to Analyst

Find your sweet spots for generating winning opportunities in this market.

Category-wise Insights

Which is the Preferred Configuration for Destructive Testing?

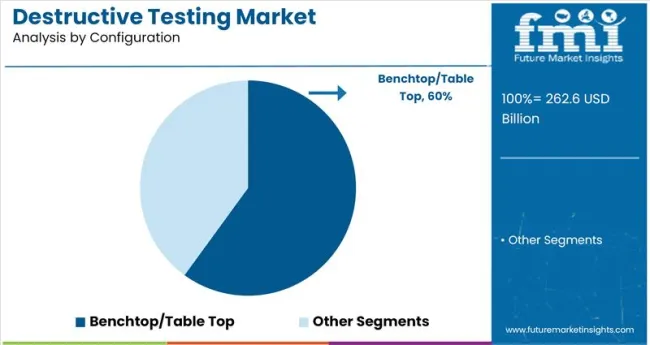
Benchtop based destructive testing units are likely to be preferred by end users on account of mobility in remote places and lightweight ergonomics in wake of smart devices. Therefore, the segment is expected to record increase in sales with substantial growth in the forecast period over its counterpart.

Which Operating type of Destructive Testing is most likely to be Preferred?

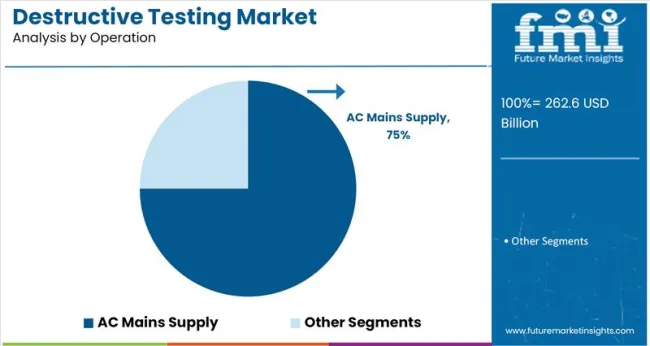
Battery operated or wireless based destructive testing device is expected to account for over (40%) of the bulk of demand for destructive testing equipment by the end of forecast period. This is due to the fact that several food and beverage companies strive for the speed with which they deliver finished and tested goods to the end-use markets.

Battery operated devices will enable instantaneous response which can be achieved using extended wireless networks, delivering end-results of tests directly to the computer/mobile phone/ laptop in no-time.

Which are top 3 End Users of Destructive Testing?

Dairy, packaged food and pet food segments are expected to be remain leading end users of destructive testing and are estimated to nearly half of market share. The cumulative average growth rate for the aforementioned segments is projected to be 5.6% during the forecast period.
Competitive Landscape

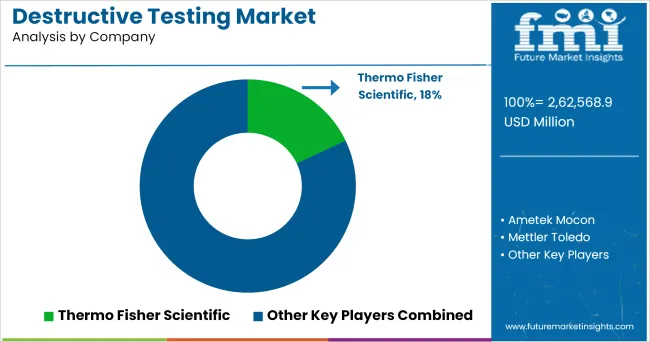
The destructive testing market is fairly consolidated, with weighted presence of tier-1 players operating in the market. The market has robust partnerships throughout the value chain and players exhibit high focus on innovations.

Compact destructive testing equipment is being used by manufacturers to improve operations and reduce liability. Manufacturers are developing equipment that may be used in a wide range of sectors. They also are designing multi-functional solutions to decrease the overall cost.

Get the data you need at a Fraction of the cost

Personalize your report by choosing insights you need
and save 40%!

Scope of Report

Attribute Details
Forecast Period 2021 to 2031
Historical Data Available for 2016 to 2020
Market Analysis USD Million for Value and Volume by Units
Key Regions Covered North America, Latin America, Europe, East Asia, South Asia & Pacific, Middle East & Africa
Key Countries Covered USA, Canada, Brazil, Mexico, Germany, Italy, France, UK, Spain, BENELUX, Russia, NORDICS, China, Japan, South Korea, India, ASEAN, ANZ, GCC Countries, Turkey, and South Africa
Key Segments Covered Device Type,  Configuration,  Operation,  End Use, and Region.
Key Companies Profiled
  • Thermo Fisher Scientific
  • Ametek Mocon
  • Mettler Toledo
  • METER Group, Inc.
  • Anéolia
  • WITT-GASETECHNIK GmbH & Co KG  (Oxybaby)
  • Metrohm
  • PCE  Deutschland  GmbH
  • Sartorius AG
  • KERN & SOHN GmbH
  • OHAUS
  • Xylem, Inc.
  • Shimadzu Corporation
  • IMADA Co., ltd.
  • Bestech Australia
  • Hanna Instruments, Inc.
  • Texture Technologies Corp.
  • S.I. Instruments
Report Coverage Market Forecast, Company Share Analysis, Competition Intelligence, DROT Analysis, Market Dynamics and Challenges, and Strategic Growth Initiatives
Customization & Pricing Available upon Request

Key Highlights from Report

  • Which is the most Lucrative Regional Market for Destructive Testing?

    North America is expected to spearhead the growth as well as consumption in the global market for destructive testing. The U.S. will emerge as the leading market in North America.

  • Which Device Type is Deemed Top-selling Segment in Destructive Testing Market?

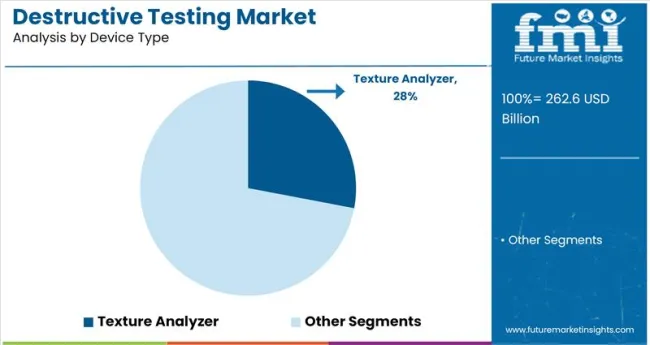
    Texture Analyzer is expected to remain top-selling device type in the market.

  • Who Is the Leading End User For Destructive Testing Devices?

    Pet Food is expected to remain a highly lucrative end-use vertical for destructive testing, registering impressive growth through 2031.

  • Which Are Some Of The Leading Companies Offering Destructive Testing Devices?

    Top players in the market are Thermo Fisher Scientific Inc., Ametek Mocon, Shimadzu Corporation, Xylem Inc. and Sartorius AG. These companies are expected to account for over 67% of sales in the market in 2021.

  • What Is The Destructive Testing Market Demand Outlook?

    The demand for destructive testing within the food sector is expected to rise at 6% CAGR between 2021 and 2031.

  • What Is The Projected Destructive Testing Market Value?

    The overall market valuation is expected to surpass US$ 3.1 Bn by 2031.

  • Who Are The Key Exporters Of Destructive Testing Equipment?

    The U.S. and Germany are key exporters of destructive testing equipment.

  • What Is The Demand Outlook For Destructive Testing Market In North America?

    The demand for destructive testing equipment will increase at 7% CAGR in North America through 2031.

  • At What Rate Will The Demand For Destructive Testing Rise In Europe?

    The demand for destructive testing is expected to increase at 6.3% CAGR in Europe between 2021 and 2031.

  • What Is South Korea’s And Japan’s Contribution towards Global Sales of Destructive Testing Equipment?

    Japan and South Korea are expected to account for 10% of global sales in 2021.

Global Destructive Testing Market by Category

By Device Type:

  • Texture Analyzer
  • Moisture Analyzer 
  • Corrosion Detector/ Tester
  • Pressure/ Burst Tester
  • Karl Fischer Titrator

By Configuration:

  • Benchtop/ Table top
  • Stationed Units

By Operation:

  • AC Mains Supply
  • Battery Operated

By End Use:

  • Packaged Food
  • Dairy
  • Confectionery
  •  Bakery
  • Pet Foods
  • Frozen Food 
  • Edible Oil
  • Snacks

By Region:

  • North America
  • Latin America
  • Europe
  • East Asia
  • South Asia Pacific
  • Middle East and Africa

Frequently Asked Questions

What is the Demand Analysis for Destructive Testing?

Demand for destructive testing is likely to grow at a CAGR of 6% through 2032.

How much Adoption of Destructive Testing can be anticipated by 2032?

Sales of destructive testing is likely to exceed a valuation of US$ 32.2 Billion by 2032.

What is the Adoption Potential of Destructive Testing?

Adoption of destructive testing is likely to reach a valuation of US$ 18 Billion in 2022.

Which Region is the Key Destructive Testing Market Contributor?

US is the key destructive testing market contributor.

Table of Content

1. Executive Summary

    1.1. Global Market Outlook

    1.2. Demand Side Trends

    1.3. Supply Side Trends

    1.4. Technology Roadmap

    1.5. Analysis and Recommendations

2. Market Overview

    2.1. Market Coverage / Taxonomy

    2.2. Market Definition / Scope / Limitations

    2.3. Overview of User Display Interface and Connectivity Options

    2.4.  Overview of physical and chemical characteristics measured

3. Key Market Trends

    3.1. Key Trends Impacting the Market

    3.2. Product Innovation / Development Trends

4. Key Success Factors

5. Global Destructive Testing Market Demand Analysis 2016-2020 and Forecast, 2021-2031

    5.1. Historical Market Volume (Units) Analysis, 2016-2020

    5.2. Current and Future Market Volume (Units) Projections, 2021-2031

    5.3. Y-o-Y Growth Trend Analysis

6. Global Destructive Testing Market - Pricing Analysis

7. Global Destructive Testing Market Demand (in Value or Size in US$ Mn) Analysis 2016-2020 and Forecast, 2021-2031

    7.1. Historical Market Value (US$ Mn) Analysis, 2016-2020

    7.2. Current and Future Market Value (US$ Mn) Projections, 2021-2031

        7.2.1. Y-o-Y Growth Trend Analysis

        7.2.2. Absolute $ Opportunity Analysis

8. Market Background

    8.1. Macro-Economic Factors

        8.1.1. Global Economic Outlook & GDP Growth Overview by Prominent Nations

        8.1.2. Global Retail based Food & beverages Market Overview

    8.2. Forecast Factors - Relevance & Impact

        8.2.1. Inspection Machines Market Growth

        8.2.2. NDT Services Market

        8.2.3. Processed Food Industry Growth Rate

        8.2.4. Pet Food Industry Growth Rate

        8.2.5. Investments in R&D and Quality Management by Stakeholders

        8.2.6. Product Awareness and Adoption rate by Region

    8.3. Value Chain Analysis

        8.3.1. List of Component Suppliers

        8.3.2. List of Software Service Vendors

        8.3.3. Aftermarket Service and Accessories Providers

    8.4. Overview of Food Quality & Safety Standards by Regional Administrative Authorities

    8.5. Market Dynamics

        8.5.1. Drivers

        8.5.2. Restraints

        8.5.3. Opportunity Analysis

    8.6. COVID - 19 Crisis: Impact Assessment

        8.6.1. Current Statistics

        8.6.2. Short-Mid-Long Term Outlook

        8.6.3. Likely Rebound

9. Global Destructive Testing Market Analysis 2016-2020 and Forecast 2021-2031, By Device Type

    9.1. Introduction / Key Findings

    9.2. Historical Market Size (US$ Mn) and Volume Analysis By Device Type, 2016 - 2020

    9.3. Current and Future Market Size (US$ Mn) and Volume Analysis and Forecast By Device Type, 2021 - 2031

        9.3.1. Texture Analyzer

        9.3.2. Moisture Analyzer

        9.3.3. Corrosion Detector/ Tester

        9.3.4. Pressure/ Burst Tester

        9.3.5. Karl Fischer Titrator

    9.4. Market Attractiveness Analysis by Device Type

10. Global Destructive Testing Market Analysis 2016-2020 and Forecast 2021-2031, By Configuration

    10.1. Introduction / Key Findings

    10.2. Historical Market Size (US$ Mn) and Volume Analysis By Configuration,2016 - 2020

    10.3. Current and Future Market Size (US$ Mn) and Volume Analysis and Forecast By Configuration, 2021 - 2031

        10.3.1. Benchtop/ Tabletop

        10.3.2. Stationed Units

    10.4. Market Attractiveness Analysis by Configuration

11. Global Destructive Testing Market Analysis 2016-2020 and Forecast 2021-2031, By Operation

    11.1. Introduction / Key Findings

    11.2. Historical Market Size (US$ Mn) and Volume Analysis By Operation, 2016 - 2020

    11.3. Current and Future Market Size (US$ Mn) and Volume Analysis and Forecast By Operation, 2021 - 2031

        11.3.1. AC Mains Supply

        11.3.2. Battery Operated

    11.4. Market Attractiveness Analysis by Operation

12. Global Destructive Testing Market Analysis 2016-2020 and Forecast 2021-2031, By End Use 

    12.1. Introduction / Key Findings

    12.2. Historical Market Size (US$ Mn) and Volume Analysis By End Use , 2016 - 2020

    12.3. Current and Future Market Size (US$ Mn) and Volume Analysis and Forecast By End Use , 2021 - 2031

        12.3.1. Packaged Food

        12.3.2. Dairy

        12.3.3. Confectionery

        12.3.4. Bakery

        12.3.5. Pet Foods

        12.3.6. Frozen Food

        12.3.7. Edible Oil

        12.3.8. Snacks

    12.4. Market Attractiveness Analysis By End Use

13. Global Destructive Testing Market Analysis 2016-2020 and Forecast 2021-2031, By Region

    13.1. Introduction / Key Findings

    13.2. Historical Market Size (US$ Mn) and Volume Analysis By Region, 2016 - 2020

    13.3. Current and Future Market Size (US$ Mn) and Volume Analysis and Forecast By Region, 2021 - 2031

        13.3.1. North America

        13.3.2. Latin America

        13.3.3. Europe

        13.3.4. East Asia

        13.3.5. South Asia Pacific

        13.3.6. Middle East and Africa

    13.4. Market Attractiveness Analysis by Device Type

14. North America Destructive Testing Market Analysis 2016-2020 and Forecast 2021-2031

    14.1. Introduction

    14.2. Pricing Analysis

    14.3. Historical Market Size (US$ Mn) and Volume Trend Analysis By Market Taxonomy, 2016 - 2020

    14.4. Market Size (US$ Mn) and Volume Forecast By Market Taxonomy, 2021 - 2031

        14.4.1. By Country

            14.4.1.1. U.S.

            14.4.1.2. Canada

        14.4.2. By Device Type

        14.4.3. By Configuration

        14.4.4. By Operation

        14.4.5. By End Use

    14.5. Market Attractiveness Analysis

        14.5.1. By Country

        14.5.2. By Device Type

        14.5.3. By Configuration

        14.5.4. By Operation

        14.5.5. By End Use

15. Latin America Destructive Testing Market Analysis 2016-2020 and Forecast 2021-2031

    15.1. Introduction

    15.2. Pricing Analysis

    15.3. Historical Market Size (US$ Mn) and Volume Trend Analysis By Market Taxonomy, 2016 - 2020

    15.4. Market Size (US$ Mn) and Volume Forecast By Market Taxonomy, 2021 - 2031

        15.4.1. By Country

            15.4.1.1. Brazil

            15.4.1.2. Mexico

            15.4.1.3. Rest of LATAM 

        15.4.2. By Device Type

        15.4.3. By Configuration

        15.4.4. By Operation

        15.4.5. By End Use

    15.5. Market Attractiveness Analysis

        15.5.1. By Country

        15.5.2. By Device Type

        15.5.3. By Configuration

        15.5.4. By Operation

        15.5.5. By End Use

16. Europe Destructive Testing Market Analysis 2016-2020 and Forecast 2021-2031

    16.1. Introduction

    16.2. Pricing Analysis

    16.3. Historical Market Size (US$ Mn) and Volume Trend Analysis By Market Taxonomy, 2016 - 2020

    16.4. Market Size (US$ Mn) and Volume Forecast By Market Taxonomy, 2021 - 2031

        16.4.1. By Country

            16.4.1.1. Germany

            16.4.1.2. Italy

            16.4.1.3. France

            16.4.1.4. UK

            16.4.1.5. Spain

            16.4.1.6. BENELUX

            16.4.1.7. NORDICS

            16.4.1.8. Russia

            16.4.1.9. Rest of Europe 

        16.4.2. By Device Type

        16.4.3. By Configuration

        16.4.4. By Operation

        16.4.5. By End Use

    16.5. Market Attractiveness Analysis

        16.5.1. By Country

        16.5.2. By Device Type

        16.5.3. By Configuration

        16.5.4. By Operation

        16.5.5. By End Use

17. East Asia Destructive Testing Market Analysis 2016-2020 and Forecast 2021-2031

    17.1. Introduction

    17.2. Pricing Analysis

    17.3. Historical Market Size (US$ Mn) and Volume Trend Analysis By Market Taxonomy, 2016 - 2020

    17.4. Market Size (US$ Mn) and Volume Forecast By Market Taxonomy, 2021 - 2031

        17.4.1. By Country

            17.4.1.1. China

            17.4.1.2. Japan

            17.4.1.3. South Korea

        17.4.2. By Device Type

        17.4.3. By Configuration

        17.4.4. By Operation

        17.4.5. By End Use

    17.5. Market Attractiveness Analysis

        17.5.1. By Country

        17.5.2. By Device Type

        17.5.3. By Configuration

        17.5.4. By Operation

        17.5.5. By End Use

18. South Asia Pacific Destructive Testing Market Analysis 2016-2020 and Forecast 2021-2031

    18.1. Introduction

    18.2. Pricing Analysis

    18.3. Historical Market Size (US$ Mn) and Volume Trend Analysis By Market Taxonomy, 2016 - 2020

    18.4. Market Size (US$ Mn) and Volume Forecast By Market Taxonomy, 2021 - 2031

        18.4.1. By Country

            18.4.1.1. India

            18.4.1.2. ASEAN

            18.4.1.3. ANZ

            18.4.1.4. Rest of SAP

        18.4.2. By Device Type

        18.4.3. By Configuration

        18.4.4. By Operation

        18.4.5. By End Use

    18.5. Market Attractiveness Analysis

        18.5.1. By Country

        18.5.2. By Device Type

        18.5.3. By Configuration

        18.5.4. By Operation

        18.5.5. By End Use

19. Middle East and Africa Destructive Testing Market Analysis 2016-2020 and Forecast 1921-1931

    19.1. Introduction

    19.2. Pricing Analysis

    19.3. Historical Market Size (US$ Mn) and Volume Trend Analysis By Market Taxonomy, 2016-2020

    19.4. Market Size (US$ Mn) and Volume Forecast By Market Taxonomy, 2021 - 2031

        19.4.1. By Country

            19.4.1.1. GCC Countries

            19.4.1.2. Turkey

            19.4.1.3. South Africa

            19.4.1.4. Rest of MEA

        19.4.2. By Device Type

        19.4.3. By Configuration

        19.4.4. By Operation

        19.4.5. By End Use

    19.5. Market Attractiveness Analysis

        19.5.1. By Country

        19.5.2. By Device Type

        19.5.3. By Configuration

        19.5.4. By Operation

        19.5.5. By End Use

20. Key and Emerging Countries for Destructive Testing Market Analysis

    20.1. Introduction

        20.1.1. Market Value Proportion Analysis, By Key Countries

        20.1.2. Global V.S. Country Growth Comparison

    20.2. U.S. Destructive Testing Market Analysis

        20.2.1. By Device Type

        20.2.2. By Configuration

        20.2.3. By Operation

        20.2.4. By End Use

    20.3. Canada Destructive Testing Market Analysis

        20.3.1. By Device Type

        20.3.2. By Configuration

        20.3.3. By Operation

        20.3.4. By End Use

    20.4. Brazil Destructive Testing Market Analysis

        20.4.1. By Device Type

        20.4.2. By Configuration

        20.4.3. By Operation

        20.4.4. By End Use

    20.5. Mexico Destructive Testing Market Analysis

        20.5.1. By Device Type

        20.5.2. By Configuration

        20.5.3. By Operation

        20.5.4. By End Use

    20.6. Germany Destructive Testing Market Analysis

        20.6.1. By Device Type

        20.6.2. By Configuration

        20.6.3. By Operation

        20.6.4. By End Use

    20.7. Italy Destructive Testing Market Analysis

        20.7.1. By Device Type

        20.7.2. By Configuration

        20.7.3. By Operation

        20.7.4. By End Use

    20.8. France Destructive Testing Market Analysis

        20.8.1. By Device Type

        20.8.2. By Configuration

        20.8.3. By Operation

        20.8.4. By End Use

    20.9. UK Destructive Testing Market Analysis

        20.9.1. By Device Type

        20.9.2. By Configuration

        20.9.3. By Operation

        20.9.4. By End Use

    20.10. Spain Destructive Testing Market Analysis

        20.10.1. By Device Type

        20.10.2. By Configuration

        20.10.3. By Operation

        20.10.4. By End Use

    20.11. BENELUX Destructive Testing Market Analysis

        20.11.1. By Device Type

        20.11.2. By Configuration

        20.11.3. By Operation

        20.11.4. By End Use

    20.12. Russia Destructive Testing Market Analysis

        20.12.1. By Device Type

        20.12.2. By Configuration

        20.12.3. By Operation

        20.12.4. By End Use

    20.13. China Destructive Testing Market Analysis

        20.13.1. By Device Type

        20.13.2. By Configuration

        20.13.3. By Operation

        20.13.4. By End Use

    20.14. Japan Destructive Testing Market Analysis

        20.14.1. By Device Type

        20.14.2. By Configuration

        20.14.3. By Operation

        20.14.4. By End Use

    20.15. South Korea Destructive Testing Market Analysis

        20.15.1. By Device Type

        20.15.2. By Configuration

        20.15.3. By Operation

        20.15.4. By End Use

    20.16. India Destructive Testing Market Analysis

        20.16.1. By Device Type

        20.16.2. By Configuration

        20.16.3. By Operation

        20.16.4. By End Use

    20.17. ASEAN Destructive Testing Market Analysis

        20.17.1. By Device Type

        20.17.2. By Configuration

        20.17.3. By Operation

        20.17.4. By End Use

    20.18. ANZ Destructive Testing Market Analysis

        20.18.1. By Device Type

        20.18.2. By Configuration

        20.18.3. By Operation

        20.18.4. By End Use

    20.19. GCC Countries Destructive Testing Market Analysis

        20.19.1. By Device Type

        20.19.2. By Configuration

        20.19.3. By Operation

        20.19.4. By End Use

    20.20. Turkey Destructive Testing Market Analysis

        20.20.1. By Device Type

        20.20.2. By Configuration

        20.20.3. By Operation

        20.20.4. By End Use

    20.21. Northern  Africa Destructive Testing Market Analysis

        20.21.1. By Device Type

        20.21.2. By Configuration

        20.21.3. By Operation

        20.21.4. By End Use

    20.22. South Africa Destructive Testing Market Analysis

        20.22.1. By Device Type

        20.22.2. By Configuration

        20.22.3. By Operation

        20.22.4. By End Use

21. Market Structure Analysis

    21.1. Market Analysis by Tier of Companies (Global Destructive Testing Market)

    21.2. Market Concentration

    21.3. Market Share Analysis of Top Players

    21.4. Market Presence Analysis

22. Competition Analysis

    22.1. Competition Dashboard

    22.2. Competition Benchmarking

    22.3. Company Profile

        22.3.1. Thermo Fisher Scientific

            22.3.1.1. Overview

            22.3.1.2. Product Portfolio

            22.3.1.3. Profitability by Market Segments (Product/ Region)

            22.3.1.4. Sales Footprint

            22.3.1.5. Strategy Overview

        22.3.2. Ametek Mocon

            22.3.2.1. Overview

            22.3.2.2. Product Portfolio

            22.3.2.3. Profitability by Market Segments (Product/ Region)

            22.3.2.4. Sales Footprint

            22.3.2.5. Strategy Overview

        22.3.3. Mettler Toledo

            22.3.3.1. Overview

            22.3.3.2. Product Portfolio

            22.3.3.3. Profitability by Market Segments (Product/ Region)

            22.3.3.4. Sales Footprint

            22.3.3.5. Strategy Overview

        22.3.4. METER Group, Inc.

            22.3.4.1. Overview

            22.3.4.2. Product Portfolio

            22.3.4.3. Profitability by Market Segments (Product/ Region)

            22.3.4.4. Sales Footprint

            22.3.4.5. Strategy Overview

        22.3.5. Anéolia

            22.3.5.1. Overview

            22.3.5.2. Product Portfolio

            22.3.5.3. Profitability by Market Segments (Product/ Region)

            22.3.5.4. Sales Footprint

            22.3.5.5. Strategy Overview

        22.3.6. WITT-GASETECHNIK GmbH & Co KG  (Oxybaby)

            22.3.6.1. Overview

            22.3.6.2. Product Portfolio

            22.3.6.3. Profitability by Market Segments (Product/ Region)

            22.3.6.4. Sales Footprint

            22.3.6.5. Strategy Overview

        22.3.7. Metrohm

            22.3.7.1. Overview

            22.3.7.2. Product Portfolio

            22.3.7.3. Profitability by Market Segments (Product/ Region)

            22.3.7.4. Sales Footprint

            22.3.7.5. Strategy Overview

        22.3.8. PCE  Deutschland  GmbH

            22.3.8.1. Overview

            22.3.8.2. Product Portfolio

            22.3.8.3. Profitability by Market Segments (Product/ Region)

            22.3.8.4. Sales Footprint

            22.3.8.5. Strategy Overview

        22.3.9. Sartorius AG

            22.3.9.1. Overview

            22.3.9.2. Product Portfolio

            22.3.9.3. Profitability by Market Segments (Product/ Region)

            22.3.9.4. Sales Footprint

            22.3.9.5. Strategy Overview

        22.3.10.   KERN & SOHN GmbH

            22.3.10.1. Overview

            22.3.10.2. Product Portfolio

            22.3.10.3. Profitability by Market Segments (Product/ Region)

            22.3.10.4. Sales Footprint

            22.3.10.5. Strategy Overview

        22.3.11.   OHAUS

            22.3.11.1. Overview

            22.3.11.2. Product Portfolio

            22.3.11.3. Profitability by Market Segments (Product/ Region)

            22.3.11.4. Sales Footprint

            22.3.11.5. Strategy Overview

        22.3.12.   Xylem, Inc.

            22.3.12.1. Overview

            22.3.12.2. Product Portfolio

            22.3.12.3. Profitability by Market Segments (Product/ Region)

            22.3.12.4. Sales Footprint

            22.3.12.5. Strategy Overview

        22.3.13.   Shimadzu Corporation

            22.3.13.1. Overview

            22.3.13.2. Product Portfolio

            22.3.13.3. Profitability by Market Segments (Product/ Region)

            22.3.13.4. Sales Footprint

            22.3.13.5. Strategy Overview

        22.3.14.   IMADA Co., ltd.

            22.3.14.1. Overview

            22.3.14.2. Product Portfolio

            22.3.14.3. Profitability by Market Segments (Product/ Region)

            22.3.14.4. Sales Footprint

            22.3.14.5. Strategy Overview

        22.3.15.   Bestech Australia

            22.3.15.1. Overview

            22.3.15.2. Product Portfolio

            22.3.15.3. Profitability by Market Segments (Product/ Region)

            22.3.15.4. Sales Footprint

            22.3.15.5. Strategy Overview

        22.3.16.   Hanna Instruments, Inc.

            22.3.16.1. Overview

            22.3.16.2. Product Portfolio

            22.3.16.3. Profitability by Market Segments (Product/ Region)

            22.3.16.4. Sales Footprint

            22.3.16.5. Strategy Overview

        22.3.17.   Texture Technologies Corp.

            22.3.17.1. Overview

            22.3.17.2. Product Portfolio

            22.3.17.3. Profitability by Market Segments (Product/ Region)

            22.3.17.4. Sales Footprint

            22.3.17.5. Strategy Overview

        22.3.18.   S.I. Instruments

            22.3.18.1. Overview

            22.3.18.2. Product Portfolio

            22.3.18.3. Profitability by Market Segments (Product/ Region)

            22.3.18.4. Sales Footprint

            22.3.18.5. Strategy Overview

23. Assumptions and Acronyms Used

24. Research Methodology

Don't pay for what you don't need

Customize your report by selecting specific countries or regions and save 30%!

List of Tables

Table 01: Global Destructive Testing Market Volume (Units) and Value (US$ Mn) Historical Data 2016-2020 and Forecast 2021-2031 By Device Type

Table 02: Global Destructive Testing Market Value (US$ Mn) and Volume (Units) Historical Data 2016-2020 and Forecast 2021-2031 by Configuration 

Table 03: Global Destructive Testing Market Value (US$ Mn) and Volume (Units) Historical Data 2016-2020 and Forecast 2021-2031 by Operation

Table 04: Global Destructive Testing Market Volume (Units) Historical Data 2016-2020 and Forecast 2021-2031 by End Use

Table 05: Global Destructive Testing Market Value (US$ Mn) & Volume (Units) Historical Data 2016-2020 and Forecast 2021-2031 by Region

Table 06: North America Destructive Testing Market Volume & Value (US$ Mn) Historical Data 2016 – 2020 and Forecast 2021 – 2031 by Country

Table 07: North America Destructive Testing Market Volume (‘000 Units) and Value (US$ Mn) Historical Data 2016-2020 and Forecast 2021-2031 By Device Type

Table 08: North America Destructive Testing Market Value (US$ Mn) and Volume ('000 Units) Historical Data 2016-2020 and Forecast 2021-2031 by Configuration 

Table 09: North America Destructive Testing Market Value (US$ Mn) and Volume ('000 Units) Historical Data 2016-2020 and Forecast 2021-2031 by Operation

Table 10: North America Destructive Testing Market Volume ('000 Units) Historical Data 2016-2020 and Forecast 2021-2031 by End Use

Table 11: Latin America Destructive Testing Market Volume & Value (US$ Mn) Historical Data 2016 – 2020 and Forecast 2021 – 2031 by Country

Table 12: Latin America Destructive Testing Market Volume (‘000 Units) and Value (US$ Mn) Historical Data 2016-2020 and Forecast 2021-2031 By Device Type

Table 13: Latin America Destructive Testing Market Value (US$ Mn) and Volume ('000 Units) Historical Data 2016-2020 and Forecast 2021-2031 by Configuration 

Table 14: Latin America Destructive Testing Market Value (US$ Mn) and Volume ('000 Units) Historical Data 2016-2020 and Forecast 2021-2031 by Operation

Table 15: Latin America Destructive Testing Market Volume ('000 Units) Historical Data 2016-2020 and Forecast 2021-2031 by End Use

Table 16: Europe Destructive Testing Market Volume & Value (US$ Mn) Historical Data 2016 – 2020 and Forecast 2021 – 2031 by Country

Table 17: Europe Destructive Testing Market Volume (‘000 Units) and Value (US$ Mn) Historical Data 2016-2020 and Forecast 2021-2031 By Device Type

Table 18: Europe Destructive Testing Market Value (US$ Mn) and Volume ('000 Units) Historical Data 2016-2020 and Forecast 2021-2031 by Configuration 

Table 19: Europe Destructive Testing Market Value (US$ Mn) and Volume ('000 Units) Historical Data 2016-2020 and Forecast 2021-2031 by Operation

Table 20: Europe Destructive Testing Market Volume ('000 Units) Historical Data 2016-2020 and Forecast 2021-2031 by End Use

Table 21: East Asia Destructive Testing Market Volume & Value (US$ Mn) Forecast by Country, 2016-2031

Table 22: East Asia Destructive Testing Market Volume (‘000 Units) and Value (US$ Mn) Historical Data 2016-2020 and Forecast 2021-2031 By Device Type

Table 23: East Asia Destructive Testing Market Value (US$ Mn) and Volume ('000 Units) Historical Data 2016-2020 and Forecast 2021-2031 by Configuration 

Table 24: East Asia Destructive Testing Market Value (US$ Mn) and Volume ('000 Units) Historical Data 2016-2020 and Forecast 2021-2031 by Operation

Table 25: East Asia Destructive Testing Market Volume ('000 Units) Historical Data 2016-2020 and Forecast 2021-2031 by End Use

Table 26: South Asia & Pacific Destructive Testing Market Volume & Value (US$ Mn) Forecast by Country, 2016-2031

Table 27: South Asia & Pacific Destructive Testing Market Volume (‘000 Units) and Value (US$ Mn) Historical Data 2016-2020 and Forecast 2021-2031 By Device Type

Table 28: South Asia & Pacific Destructive Testing Market Value (US$ Mn) and Volume ('000 Units) Historical Data 2016-2020 and Forecast 2021-2031 by Configuration 

Table 29: South Asia & Pacific Destructive Testing Market Value (US$ Mn) and Volume ('000 Units) Historical Data 2016-2020 and Forecast 2021-2031 by Operation

Table 30: South Asia & Pacific Destructive Testing Market Volume ('000 Units) Historical Data 2016-2020 and Forecast 2021-2031 by End Use

Table 31: Middle East & Africa Market Volume & Value (US$ Mn) Historical Data 2016 – 2020 and Forecast 2021 – 2031 by Country

Table 32: Middle East & Africa Destructive Testing Market Volume (‘000 Units) and Value (US$ Mn) Historical Data 2016-2020 and Forecast 2021-2031 By Device Type

Table 33: Middle East & Africa Destructive Testing Market Value (US$ Mn) and Volume ('000 Units) Historical Data 2016-2020 and Forecast 2021-2031 by Configuration 

Table 34: Middle East & Africa Destructive Testing Market Value (US$ Mn) and Volume ('000 Units) Historical Data 2016-2020 and Forecast 2021-2031 by Operation

Table 35: Middle East & Africa Destructive Testing Market Volume ('000 Units) and Value (US$ Mn) Historical Data 2016-2020 and Forecast 2021-2031 by End Use
Nikhil Kaitwade
Nikhil Kaitwade

Principal Consultant

Talk to Analyst

Find your sweet spots for generating winning opportunities in this market.

List of Charts

Figure 01: Global Destructive Testing Historical Market Volume, 2016–2020

Figure 02: Global Destructive Testing Market Volume Forecast, 2021–2031

Figure 03: Global Destructive Testing Market Pricing Analysis, (US$ per Unit,  2020)

Figure 04: Global Destructive Testing Market Historical Value (US$ Mn), 2016 – 2020

Figure 05: Global Destructive Testing Market Absolute $ Opportunity, 2021 – 2031

Figure 06: Global Destructive Testing Market Value (US$ Mn) Forecast, 2021 – 2031

Figure 07: Global Market Value Share Analysis By Device Type, 2021 & 2031  

Figure 08: Global Market Y-o-Y Growth Analysis By Device Type, 2020-2031

Figure 09: Global Destructive Testing Market Attractiveness Analysis By Device Type, 2021-2031

Figure 10: Global Market Incremental $ Opportunity By Device Type, 2021-2031

Figure 11: Global Destructive Testing Market Share & BPS Analysis by Configuration, 2021 & 2031

Figure 12: Global Destructive Testing Market Y-o-Y Growth Projection by Sales Configuration, 2020-2031

Figure 13: Global Destructive Testing Market Attractiveness Analysis by Sales Configuration, 2021-2031

Figure 14: Global Market Incremental $ Opportunity by Configuration, 2021-2031

Figure 15: Global Destructive Testing Market Share & BPS Analysis by Operation, 2021 & 2031

Figure 16: Global Destructive Testing Market Y-o-Y Growth Projection by Operation, 2020-2031

Figure 17: Global Destructive Testing Market Attractiveness Analysis by Operation, 2021-2031

Figure 18:  Global Market Incremental $ Opportunity by Operation, 2021-2031

Figure 19: Global Destructive Testing Market Share & BPS Analysis by End Use, 2021 & 2031

Figure 20: Global Destructive Testing Market Y-o-Y Growth Projection by End Use, 2020-2031

Figure 21: Global Destructive Testing Market Attractiveness Analysis by End Use, 2021-2031

Figure 22:  Global Market Incremental $ Opportunity by End Use, 2021-2031

Figure 23: Global Destructive Testing Market Share & BPS Analysis by Region, 2021 & 2031

Figure 24: Global Destructive Testing Market Y-o-Y Growth Projection by Region, 2020-2031

Figure 25: Global Destructive Testing Market Attractiveness Analysis by Region, 2021-2031

Figure 26: Global Market Incremental $ Opportunity by Region, 2021-2031

Figure 27: North America Destructive Testing Market Share and BPS Analysis by Country - 2021 & 2031

Figure 28: North America Destructive Testing Market Y-o-Y Growth by Country, 2020-2031

Figure 29: North America Destructive Testing Market Attractiveness Analysis by Country, 2021-2031

Figure 30: North America Market Incremental $ Opportunity by Country, 2021-2031

Figure 31: North America Market Value Share Analysis By Device Type, 2021 & 2031  

Figure 32: North America Market Y-o-Y Growth Analysis By Device Type, 2020-2031

Figure 33: North America Destructive Testing Market Attractiveness Analysis By Device Type, 2021-2031

Figure 34: North America Market Incremental $ Opportunity By Device Type, 2021-2031

Figure 35: North America Destructive Testing Market Share & BPS Analysis by Configuration, 2021 & 2031

Figure 36: North America Destructive Testing Market Y-o-Y Growth Projection by Sales Configuration, 2021-2031

Figure 37: North America Destructive Testing Market Attractiveness Analysis by Sales Configuration, 2021-2031

Figure 38: North America Market Incremental $ Opportunity by Configuration, 2021-2031

Figure 39: North America Destructive Testing Market Share & BPS Analysis by Operation, 2021 & 2031

Figure 40: North America Destructive Testing Market Y-o-Y Growth Projection by Operation, 2020-2031

Figure 41: North America Destructive Testing Market Attractiveness Analysis by Operation, 2021-2031

Figure 42:  North America Market Incremental $ Opportunity by Operation, 2021-2031

Figure 43: North America Destructive Testing Market Share & BPS Analysis by End Use, 2021 & 2031

Figure 44: North America Destructive Testing Market Y-o-Y Growth Projection by End Use, 2020-2031

Figure 45: North America Destructive Testing Market Attractiveness Analysis by End Use, 2021-2031

Figure 46:  North America Market Incremental $ Opportunity by End Use, 2021-2031

Figure 47: Latin America Destructive Testing Market Share and BPS Analysis by Country - 2021 & 2031

Figure 48: Latin America Destructive Testing Market Y-o-Y Growth by Country, 2020-2031

Figure 49: Latin America Destructive Testing Market Attractiveness Analysis by Country, 2021-2031

Figure 50: Latin America Market Incremental $ Opportunity by Country, 2021-2031

Figure 51: Latin America Market Value Share Analysis By Device Type, 2021 & 2031  

Figure 52: Latin America Market Y-o-Y Growth Analysis By Device Type, 2020-2031

Figure 53: Latin America Destructive Testing Market Attractiveness Analysis By Device Type, 2021-2031

Figure 54: Latin America Market Incremental $ Opportunity By Device Type, 2021-2031

Figure 55: Latin America Destructive Testing Market Share & BPS Analysis by Configuration, 2021 & 2031

Figure 56: Latin America Destructive Testing Market Y-o-Y Growth Projection by Sales Configuration, 2020-2031

Figure 57: Latin America Destructive Testing Market Attractiveness Analysis by Sales Configuration, 2021-2031

Figure 58: Latin America Market Incremental $ Opportunity by Configuration, 2021-2031

Figure 59: Latin America Destructive Testing Market Share & BPS Analysis by Operation, 2021 & 2031

Figure 60: Latin America Destructive Testing Market Y-o-Y Growth Projection by Operation, 2020-2031

Figure 61: Latin America Destructive Testing Market Attractiveness Analysis by Operation, 2021-2031

Figure 62:  Latin America Market Incremental $ Opportunity by Operation, 2021-2031

Figure 63: Latin America Destructive Testing Market Share & BPS Analysis by End Use, 2021 & 2031

Figure 64: Latin America Destructive Testing Market Y-o-Y Growth Projection by End Use, 2020-2031

Figure 65: Latin America Destructive Testing Market Attractiveness Analysis by End Use, 2021-2031

Figure 66:  Latin America Market Incremental $ Opportunity by End Use, 2021-2031

Figure 67: Europe Destructive Testing Market Share and BPS Analysis by Country - 2021 & 2031

Figure 68: Europe Destructive Testing Market Y-o-Y Growth by Country, 2020-2031

Figure 69: Europe Destructive Testing Market Attractiveness Analysis by Country, 2021-2031

Figure 70: Europe Market Incremental $ Opportunity by Country, 2021-2031

Figure 71: Europe Destructive Testing Market Value Share Analysis By Device Type, 2021 & 2031  

Figure 72: Europe Destructive Testing Market Y-o-Y Growth Analysis By Device Type, 2020-2031

Figure 73: Testing Market Attractiveness Analysis By Device Type, 2021-2031

Figure 74: Europe Market Incremental $ Opportunity By Device Type, 2021-2031

Figure 75: Europe Destructive Testing Market Share & BPS Analysis by Configuration, 2021 & 2031

Figure 76: Europe Destructive Testing Market Y-o-Y Growth Projection by Sales Configuration, 2020-2031

Figure 77: Europe Destructive Testing Market Attractiveness Analysis by Sales Configuration, 2021-2031

Figure 78: Europe Market Incremental $ Opportunity by Configuration, 2021-2031

Figure 79: Europe Destructive Testing Market Share & BPS Analysis by Operation, 2021 & 2031

Figure 80: Europe Destructive Testing Market Y-o-Y Growth Projection by Operation, 2020-2031

Figure 81: Europe Destructive Testing Market Attractiveness Analysis by Operation, 2021-2031

Figure 82:  Europe Market Incremental $ Opportunity by Operation, 2021-2031

Figure 83: Europe Destructive Testing Market Share & BPS Analysis by End Use, 2021 & 2031

Figure 84: Europe Destructive Testing Market Y-o-Y Growth Projection by End Use, 2020-2031

Figure 85: Europe Destructive Testing Market Attractiveness Analysis by End Use, 2021-2031

Figure 86:  Europe Market Incremental $ Opportunity by End Use, 2021-2031

Figure 87: East Asia Destructive Testing Market Share and BPS Analysis by Country - 2021-2031

Figure 88: East Asia Destructive Testing Market Y-o-Y Growth Projections by Country, 2020-2031

Figure 89: East Asia Destructive Testing Market Attractiveness by Country, 2021-2031

Figure 90: East Asia Market Incremental $ Opportunity by Country, 2021-2031

Figure 91: East Asia Destructive Testing Market Value Share Analysis By Device Type, 2021 & 2031  

Figure 92: East Asia Destructive Testing Market Y-o-Y Growth Analysis By Device Type, 2020-2031

Figure 93: East Asia Destructive Testing Market Attractiveness Analysis By Device Type, 2021-2031

Figure 94: East Asia Market Incremental $ Opportunity By Device Type, 2021-2031

Figure 95: East Asia Destructive Testing Market Share & BPS Analysis by Configuration, 2021 & 2031

Figure 96: East Asia Destructive Testing Market Y-o-Y Growth Projection by Sales Configuration, 2020-2031

Figure 97: East Asia Destructive Testing Market Attractiveness Analysis by Sales Configuration, 2021-2031

Figure 98: East Asia Market Incremental $ Opportunity by Configuration, 2021-2031

Figure 99: East Asia Destructive Testing Market Share & BPS Analysis by Operation, 2021 & 2031

Figure 100: East Asia Destructive Testing Market Y-o-Y Growth Projection by Operation, 2020-2031

Figure 101: East Asia Destructive Testing Market Attractiveness Analysis by Operation, 2021-2031

Figure 102:  East Asia Market Incremental $ Opportunity by Operation, 2021-2031

Figure 103: East Asia Destructive Testing Market Share & BPS Analysis by End Use, 2021 & 2031

Figure 104: East Asia Destructive Testing Market Y-o-Y Growth Projection by End Use, 2020-2031

Figure 105: East Asia Destructive Testing Market Attractiveness Analysis by End Use, 2021-2031

Figure 106:  East Asia Market Incremental $ Opportunity by End Use, 2021-2031

Figure 107: South Asia & Pacific Destructive Testing Market Share and BPS Analysis by Country - 2021-2031

Figure 108: South Asia & Pacific Destructive Testing Market Y-o-Y Growth Projections by Country, 2020-2031

Figure 109: South Asia & Pacific Destructive Testing Market Attractiveness by Country, 2021-2031

Figure 110: South Asia & Pacific Market Incremental $ Opportunity by Country, 2021-2031

Figure 111: South Asia & Pacific Destructive Testing Market Value Share Analysis By Device Type, 2021 & 2031  

Figure 112: South Asia & Pacific Destructive Testing Market Y-o-Y Growth Analysis By Device Type, 2020-2031

Figure 113: South Asia & Pacific Destructive Testing Market Attractiveness Analysis By Device Type, 2021-2031

Figure 114: South Asia & Pacific Market Incremental $ Opportunity By Device Type, 2021-2031

Figure 115: South Asia & Pacific Destructive Testing Market Share & BPS Analysis by Configuration, 2021 & 2031

Figure 116: South Asia & Pacific Destructive Testing Market Y-o-Y Growth Projection by Sales Configuration, 2020-2031

Figure 117: South Asia & Pacific Destructive Testing Market Attractiveness Analysis by Sales Configuration, 2021-2031

Figure 118: South Asia & Pacific Market Incremental $ Opportunity by Configuration, 2021-2031

Figure 119: South Asia & Pacific Destructive Testing Market Share & BPS Analysis by Operation, 2021 & 2031

Figure 120: South Asia & Pacific Destructive Testing Market Y-o-Y Growth Projection by Operation, 2020-2031

Figure 121: South Asia & Pacific Destructive Testing Market Attractiveness Analysis by Operation, 2021-2031

Figure 122:  South Asia & Pacific Market Incremental $ Opportunity by Operation, 2021-2031

Figure 123: South Asia & Pacific Destructive Testing Market Share & BPS Analysis by End Use, 2021 & 2031

Figure 124: South Asia & Pacific Destructive Testing Market Y-o-Y Growth Projection by End Use, 2020-2031

Figure 125: South Asia & Pacific Destructive Testing Market Attractiveness Analysis by End Use, 2021-2031

Figure 126:  South Asia & Pacific Market Incremental $ Opportunity by End Use, 2021-2031

Figure 127: Middle East & Africa Market Share and BPS Analysis by Country - 2021 & 2031

Figure 128: Middle East & Africa Market Y-o-Y Growth by Country, 2020-2031

Figure 129: Middle East & Africa Market Attractiveness Analysis by Country, 2021-2031

Figure 130: Middle East & Africa Market Incremental $ Opportunity by Country, 2021-2031

Figure 131: Middle East & Africa Market Value Share Analysis By Device Type, 2021 & 2031  

Figure 132: Middle East & Africa Market Y-o-Y Growth Analysis By Device Type, 2020-2031

Figure 133: Middle East & Africa Destructive Testing Market Attractiveness Analysis By Device Type, 2021-2031

Figure 134: Middle East & Africa Market Incremental $ Opportunity By Device Type, 2021-2031

Figure 135: Middle East & Africa Destructive Testing Market Share & BPS Analysis by Configuration, 2021 & 2031

Figure 136: Middle East & Africa Destructive Testing Market Y-o-Y Growth Projection by Sales Configuration, 2020-2031

Figure 137: Middle East & Africa Destructive Testing Market Attractiveness Analysis by Sales Configuration, 2021-2031

Figure 138: Middle East & Africa Market Incremental $ Opportunity by Configuration, 2021-2031

Figure 139: Middle East & Africa Destructive Testing Market Share & BPS Analysis by Operation, 2021 & 2031

Figure 140: Middle East & Africa Destructive Testing Market Y-o-Y Growth Projection by Operation, 2020-2031

Figure 141: Middle East & Africa Destructive Testing Market Attractiveness Analysis by Operation, 2021-2031

Figure 142:  Middle East & Africa Market Incremental $ Opportunity by Operation, 2021-2031

Figure 143: Middle East & Africa Destructive Testing Market Share & BPS Analysis by End Use, 2021 & 2031

Figure 144: Middle East & Africa Destructive Testing Market Y-o-Y Growth Projection by End Use, 2020-2031

Figure 145: Middle East & Africa Destructive Testing Market Attractiveness Analysis by End Use, 2021-2031

Figure 146:  Middle East & Africa Market Incremental $ Opportunity by End Use, 2021-2031

Explore Testing Equipment Insights

View Reports

Destructive Testing Market